Gold (XAU/USD) — Symmetrical Triangle Between Key Buy&Sell ZonesGold continues to consolidate within a tightening symmetrical triangle.
Price is currently testing the $4,000 region, with clear supply and demand zones identified:
• Strong Sell Zone: 4,020 – 4,040
• Strong Buy Zone: 3,920 – 3,940
A confirmed breakout with volume could define the next short-term direction.
Until then, structure remains neutral, with reactive scalping opportunities around the edges.
#XAUUSD #Gold #PriceAction #TechnicalAnalysis #Trading
Trade ideas

Gold trapping both Buyers and SellersTechnical analysis: As I announced possible Selling correction on Gold however Short and Medium-term remains Bullish, Price-action has recovered half of the opening losses on the E.U. session opening as DX was taking big Daily candle hit. However the rise is still not proportional as Bond Yields and global futures are still on Lower levels. This leads me to believe that on the Short-term, there is a stronger connection of Gold to DX, rather than Bond Yields, so I will keep an eye for pressure zones on DX. Technically the Daily chart was isolated within broken / former Descending Channel on it’s Lower High’s, as Resistance has to break since last couple occasions it provided rejection twice (#4,027.80). I am expecting strong move to take place throughout next week. Despite the Bullish Fundamental outcome on announcements last week, Gold continues to Trade near the #2-Week High’s. This indicates that last week's aggressive Buy-off on DX was largely a pre-pricing of those Fed Rate numbers. What's obvious, as the current week will come to a close, is that the consolidation since Friday’s session is just above the Daily chart’s Support Zone (#3,964.80 - #3,977.80) which lifts the probabilities for an aggressive Buying sequence ahead, especially as Weekly chart (#1W) remains marginally Bullish.
My position: I have Traded Scalp orders mostly throughout yesterday’s session Buying #4,005.80 on multiple occasions towards #4,015.80 and #3,992.80 aggressively towards #4,000.80 benchmark. I have Bought #3,964.80 as well as I maintain Buying every dips strategy. I have accumulated enough Profits this week and will not Trade today, comfortably taking early weekend break.

XAUUSD My Trade Head and Shoulders TradeENTRY
XAUUSD - 06/11/2025
9PM - NY
H1 CLEAN HEAD AND SHOULDERS
FIB 78.6 THE BEST
LEFT RIGHT SHOULDER A. M SHAPE ICT REJECTION
Gold holds near $4,000 as US shutdown, layoffs boost safe-haven demand
Gold peaks $4,019 as a weaker US Dollar and lower Treasury yields lift Bullion.
US shutdown warnings from Republican leader boost safe-haven demand for Gold.
Mixed Fed tone and softer jobs data revive December rate cut bets, supporting the Gold outlook.
The US Challenger report by Gray & Christmas showed that employers fired over 150,000 people in October.

StevenTrading – Gold Confirms Uptrend Across Multiple TimeframesStevenTrading – Gold Confirms Uptrend Across Multiple Timeframes
Hello everyone, StevenTrading is back with the latest insights on the gold market.
While USD speculators continue to bet on the decline of the greenback – even challenging the Federal Reserve's hawkish stance – gold is seizing this period to strengthen its position.
Although Chairman Powell signals maintaining tight policies, most strategists still believe that the USD will remain weak in November, creating a favorable environment for the precious metal's uptrend.
📰 Fundamental Analysis – Cash Flow Perspective
Cash flow is shifting from USD-valued assets to safe-haven assets, with gold being the top choice.
Financial instability and divisions within the Fed keep inflation expectations high, reinforcing gold's medium-term uptrend.
📊 Technical Analysis – Structure Break & Trend Confirmation
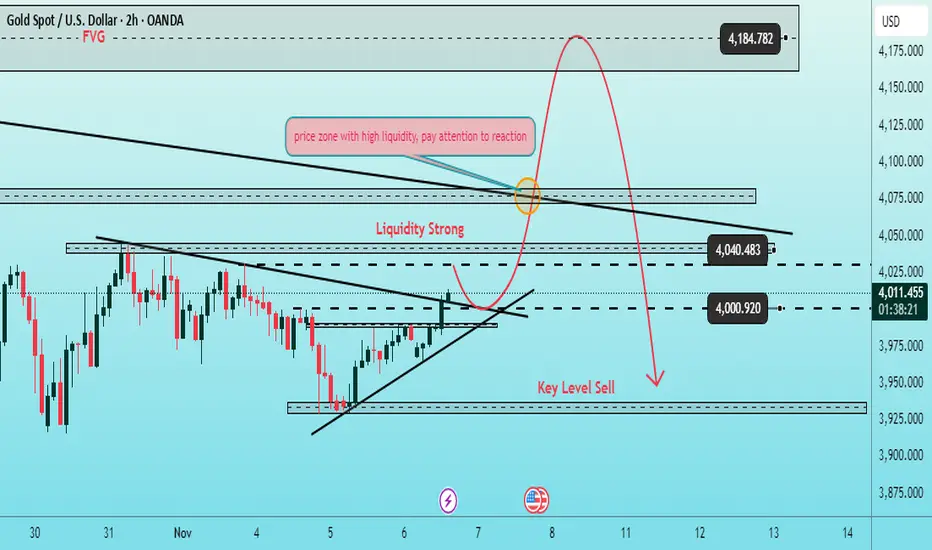
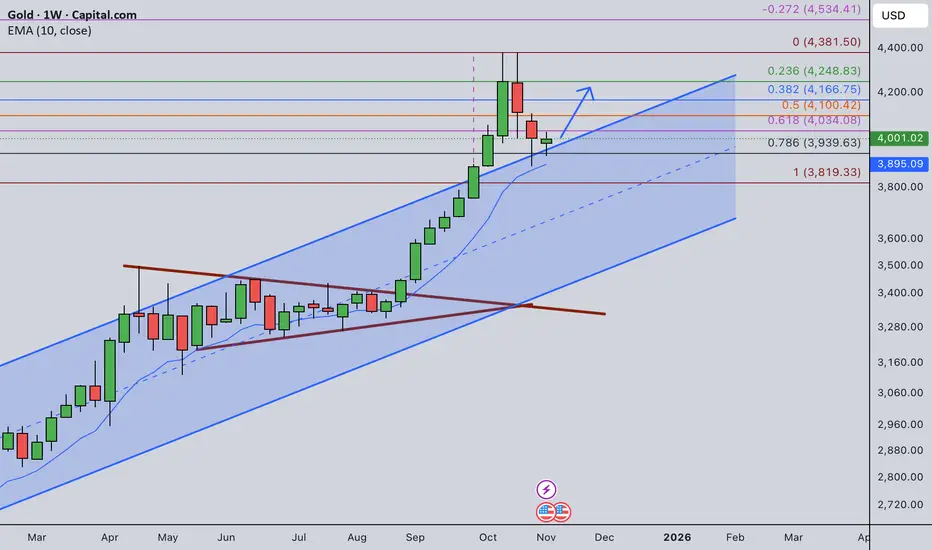
On the technical chart, gold has broken the downtrend line on the H4 timeframe and surged past the strong resistance zone around 3990–4000, confirming an expanded uptrend across multiple timeframes.
Currently, the price is hesitating around the trendline – a sign that the market is attracting liquidity before continuing its rise.
The medium-term price target is aimed at the 418x zone, where the confluence between FVG and major resistance occurs.
However, the 4080 area is a crucial zone to closely watch for price reactions, especially if short-term distribution signals appear.
🎯 Trading Scenario (Action Plan)
🟢 BUY Scenario – Buy with the uptrend:
Logic: Price has confirmed a resistance break and re-tested the breakout zone, presenting an opportunity for trend-following buys.
Entry: Buy 4000
SL: 3990
TP: 4035 – 4050 – 4080 – OPEN
🔴 SELL Scenario – Only for short-term reactions (Scalping):
If the price reacts strongly at the 4080 zone, consider short selling with short-term targets in the liquidity zone – prioritize quick exits, do not hold positions overnight.
📌 Steven's Notes
The primary trend remains upward in the medium term, but monitor price reactions on smaller timeframes (M15–M30) to optimize entry points.
gold ranging gold has been ranging between 3990-3960
The week candle as well is still in dogi hence we have equal buyer and seller.

Nov 6, 2025 - XAUUSD GOLD Analysis and Potential Opportunity📊 Analysis:
Yesterday, price held firmly around the 3927–3930.5 zone, and as expected, a short-term rebound followed, reaching a high of 3990.
For today, watch the 3980 level closely — if price holds above 3980, I’ll consider that bullish momentum is starting to build, and will look for buy setups on pullbacks into support.
However, if price breaks below 3964, it would suggest renewed bearish strength, and I’ll switch to selling rallies into resistance.
🔍 Key Levels to Watch:
• 4020 – Resistance
• 4012 – Resistance
• 4000 – Psychological level
• 3994 – Resistance
• 3971–3980 – Support zone
• 3964 – Key support
• 3956 – Support
• 3947 – Support
• 3927–3930.5 – Major support zone
📈 Intraday Strategy:
SELL: If price breaks below 3964 → target 3960, with further downside toward 3956, 3951, 3947
BUY: If price holds above 3980 → target 3985, with further upside toward 3990, 3996, 4000


XAUUSD shortGold showing short-term weakness we can take advantage of
✅ Bearish market
✅ Pullback to a good level
✅ Clipped resistance for short term sell
✅ Entry after trapped buyers
One thing to look out for is the pullback, that isn't fully convincing
General wisdom is less valuable than specific savvy

20251105-XAUUSD IdeaOn the major timeframe, monitor the 4026 level. A break above this level would indicate that the A-wave correction has completed and the B-wave is underway. Until it breaks, continue to anticipate further downside correction.

Gold - Sell around 3966, target 3940-3900Gold Market Analysis:
Our strategy for gold yesterday was bearish, and the market followed our expectations. We placed four short orders: selling at 3981, 3999, 3945, and 3958. The rhythm of gold trading is crucial. Even if you're certain of the direction, you need to find its rhythm, because now even a small rebound can be as high as 30 points. Yesterday, gold plummeted to around 3928, closing with a large bearish candle on the daily chart. Today, the Asian session saw another rebound, but the daily chart pattern suggests an initial rebound followed by further declines. The daily target is a break below 3900. Based on the current indicators, gold still has significant downside potential. The daily moving averages are starting to decline, so we're not considering bottom-fishing for now. Continue selling today; following the trend is the only way to profit in the long run.
Today, pay attention to two levels: 3966, a resistance level based on chart patterns and the first resistance level in the Asian session; and 3975, the high of yesterday's US session rebound. Additionally, the daily moving averages are around 3985, indicating that all resistance is shifting downwards. Selling today could lead to new lows.
Support levels are 3928 and 3945, resistance levels are 3966 and 3975. The key level for market strength/weakness is 3966.
Fundamental Analysis:
Today, focus on the ADP employment data, a leading indicator for non-farm payrolls. Also, pay attention to the new crude oil inventory data.
Trading Recommendation:
Gold - Sell around 3966, target 3940-3900.

xAU-USDHourly time frame is very volatile 📊
Because above it has an important resistance at $4,000
And below we have the intersection of two important supports at $3,950 🚨
We must wait for a breakdown and confirmation
If it breaks up, the target will be $4,120🔼🔼
And if it breaks down, the target will be $3,900

gold may correct furtherthe bull died off after news yesterday and gold is back to its downtrend.
sell below 3987 support becomes resistance.
target drop til 3887 extend to 3617

Calm before the StormGold remains trapped in a tight consolidation around the psychological 4,000 level as markets prepare for this week’s ADP Employment Report and other private U.S. data that will still be released despite the ongoing government shutdown.
Price action is perfectly balanced — neither bulls nor bears are in full control — but structure still leans slightly bearish while the Federal Reserve’s tone remains hawkish and the dollar stays firm.
Technical Outlook
Gold continues to oscillate between 3,995 and 4,015, with repeated rejections at both boundaries.
Buyers keep defending the 4,000 area, while sellers continue to cap upside moves near 4,015–4,020.
A daily close above 4,015 could trigger a short-term breakout toward 4,035–4,045, while a sustained move below 3,995 would expose 3,985–3,965 and possibly 3,950.
Momentum remains neutral and volume light, signaling that gold is coiling for a 25–30 USD move once the range breaks.
Fundamental Context
Even with the U.S. government shutdown, key private indicators like the ADP Employment Report and the University of Michigan Sentiment Index will be published this week.
The ADP data on Wednesday (8:15 ET) will likely set the tone:
• A strong print above +100K could reinforce the Fed’s cautious stance, strengthen the USD, and weigh on gold.
• A weak or negative print could revive safe-haven demand and push gold toward 4,050–4,080.
Until then, markets remain quiet and balanced, waiting for a catalyst.
Powell and Fed Dynamics
No official Powell speech appears on the Fed’s agenda this week, but his latest comments were clearly hawkish-pragmatic — signaling patience and data dependence after recent rate cuts.
Any unexpected remarks reaffirming a “higher for longer” stance would strengthen yields and the dollar, adding downward pressure on gold.
Weekly Focus
Wednesday: ADP Employment Report (Private Sector Jobs)
Friday: University of Michigan Sentiment (Preliminary)
Saturday, November 8: 40 days of government shutdown — a potential psychological risk event if the political stalemate continues.
My View
Gold is holding the line at 4,000 — not breaking, not bouncing.
The market is waiting for a catalyst, and this week’s U.S. employment data might be it.
Until then, I’m watching 4,015 for a breakout and 3,995 for a breakdown.
Expect volatility to rise sharply midweek as traders reposition for the next macro leg.
“Gold is quiet today, but quiet markets rarely stay quiet for long.”
#Gold #XAUUSD #TradingView #TechnicalAnalysis #Forex #Commodities #ADP #Fed #Powell #GovernmentShutdown

Gold is in dangerous bear pull backAfter massive drop, gold recover litle bit but now is in dangerous bear pull back formation.
Chart is on 4 hour. With break below down trening Line, gold will be infocus due to the 200 4Ma, which if break drop will be strong and fast.
Zone where gold is buy is just above Ascending triangle breakout at 3200

XAU/USD – 1H Supply Zone Reaction | Possible Short SetupAfter a clean pullback from the recent low near $3,860, Gold is now approaching an important 1H supply zone (around $4,050).
The overall structure still remains bearish, with lower highs and lower lows dominating the chart.
🔍 Technical Outlook
Price approaching previous structure zone (potential supply).
Market structure: Bearish on both 1H and 4H.
Rejection from $4,050–$4,060 could trigger a short move back to $3,900–$3,860.
Setup invalid if 1H closes above $4,060.
💰 Trade Plan (Example)
Entry: 4,030–4,050
Stop Loss: Above 4,060
Take Profit: 3,900 → 3,860
🧠 Bias: Bearish
🎯 Watching for rejection confirmation from $4,050 zone before short entries.
#XAUUSD #Gold #Forex #TradingView #TechnicalAnalysis #PriceAction #SmartMoneyConcepts #Scalping #FXTrading #GoldAnalysis

Gold Weekly Summary and Forecast 11/8/2025In my last week's weekly post, I expected gold to test 3939 and rise from there as shown below.
Gold indeed bounced from there. However, the movement is very slow in the past week. Especially for the last two days, price is ranging from 3970-4020. Nevertheless, gold closed the week with a positive note. And it is clearly bouncing from the previous channel top as well. Therefore, I expect gold to rise sharply next week.
For next week's trading strategy, I will only look for buying opportunities.
Do not short goldGold price dropped from the wedge early in the week on Tuesday and "U turn" on Wednesday.
It is possibly forming a double bottom structure, similar to silver.
Do not short gold now, buy on dips.

Final big Gold pullback before moon into 2030Final big Gold pullback before moon into 2030
Just HODL a store of value. Don't trade it and wait a couple of years.

GOLD | Bearish Momentum Holds Below Pivot Zone GOLD | Bearish Momentum Holds Below Pivot Zone
Gold remains under bearish pressure as it trades below the pivot zone at 4,034–4,053, signaling continued weakness amid cautious sentiment ahead of upcoming U.S. data.
🕯 Momentum remains negative, but a breakout above the pivot zone could quickly shift the tone back to bullish.
Key Levels
Pivot Zone: 4,034 – 4,053
Resistance: 4,082 · 4,105 · 4,189
Support: 4,004 · 3,982 · 3,921
Trading Plan:
Sell Setup: Shorts valid below 4,038, targeting 4,004 / 3,982 / 3,921.
Buy Setup: Longs valid only above 4,053, targeting 4,105 / 4,152.
Premium Takeaway
Gold remains in bearish control below 4,053, with potential to drop toward 3,982–3,921.
A confirmed 1H close above 4,053 would shift bias to bullish, opening the path toward 4,105–4,189 in the short term.

GOLD TECHNICAL ANALYSIS: INTRADAY & SWING TRADING🔍 XAUUSD GOLD TECHNICAL ANALYSIS: COMPREHENSIVE DEEP DIVE FOR INTRADAY & SWING TRADING (NOV 3-7, 2025) 📊
Close Price Level: 4,003.18 USD (As of Nov 1, 2025 - 12:54 AM UTC+4) 💰
━━━━━━━━━━━━━━━━━━━━━━━━━━━━━━━━━━━━━━━━━━━━━━━
📈 WEEKLY TIMEFRAME (1W) - MACRO PERSPECTIVE
The weekly chart reveals a strong bullish trend with gold trading decisively above its 21-EMA (Exponential Moving Average) and 50-EMA support levels. Ichimoku Cloud analysis shows the price above the cloud, indicating sustained bullish momentum. Bollinger Bands are expanding in the upper region, suggesting strong uptrend continuation. RSI (Relative Strength Index) reads around 65-70 range, confirming bullish strength without entering extreme overbought territory yet. Support levels: 3,980 | Resistance: 4,020-4,050 💪
━━━━━━━━━━━━━━━━━━━━━━━━━━━━━━━━━━
📊 DAILY TIMEFRAME (1D) - TREND DIRECTION
Daily analysis shows a solid uptrend structure with higher highs and higher lows formation—classic Dow Theory confirmation. The price is consolidating near the upper zone between 4,000-4,010. Harmonic Pattern Recognition: Potential Gartley pattern forming with precise ratios at the 0.618 Fibonacci retracement. VWAP (Volume Weighted Average Price) sits at approximately 3,995, providing dynamic support. Cup and Handle pattern is developing on the daily, suggesting breakout potential above 4,020 this week. Volume profile shows institutional accumulation during dips. 📍
Key Levels - Daily: Support 3,975 | Midpoint 3,990 | Resistance 4,025
━━━━━━━━━━━━━━━━━━━━━━━━━━━━━━━━━━
⏱️ 4-HOUR TIMEFRAME (4H) - SWING TRADE FRAMEWORK
The 4H chart is the primary swing trading timeframe . Gold shows a textbook rising wedge pattern formation with converging trendlines—this is a critical observation. Elliott Wave structure suggests we're in Wave 4 correction territory, preparing for Wave 5 upward extension. Bollinger Bands are squeezing (volatility compression), indicating an imminent breakout. RSI at 55-60 shows balanced momentum with room for bullish push.
IMPORTANT: Watch the 4H support at 3,998 . A break below creates a bear trap opportunity. Alternatively, a breakout above 4,015 confirms wave 5 initiation.
Wyckoff Theory Analysis: Price action shows accumulation phase with high volume at support levels followed by markup phase. Volume trend is constructive. Exponential MA Cross: 20-EMA above 50-EMA = bullish setup locked in. 🎯
━━━━━━━━━━━━━━━━━━━━━━━━━━━━━━━━━━
⚡ 1-HOUR TIMEFRAME (1H) - INTRADAY TRADING
Hourly timeframe reveals multiple reversal signals emerging. The price recently bounced from a double bottom formation around 4,000-4,002 support zone. Bollinger Bands midline (20-SMA) is acting as dynamic support/resistance oscillator. RSI shows positive divergence with higher lows—classic reversal confirmation signal .
Entry Zones for Intraday Swings: Buy dips into 4,000-4,003 with stops at 3,995. Target 4,015 for quick 15-20 pips profit-taking. Ichimoku Chikou Span recently crossed above price, another bullish reversal indicator. Volume on recent upswings shows institutional participation. ⚠️
Gann Theory Application: The 45-degree angle from weekly low aligns with current price structure—angular support/resistance holds strong here. 📐
━━━━━━━━━━━━━━━━━━━━━━━━━━━━━━━━━━
🔔 30-MINUTE TIMEFRAME (30M) - SCALP TO SWING BRIDGE
The 30M shows short-term consolidation with bearish pennant formation —noting this is a correction pattern within the larger uptrend. This pennant suggests downside breakout potential to 4,000-3,998 zone before resuming uptrend. Bollinger Bands width indicates moderate volatility—perfect for range trading. RSI at 45-50 shows neutral zone , neither overbought nor oversold.
Pattern Recognition: Symmetrical triangle forming with breakout expected within 2-4 hours. Volume declining into consolidation—classic pre-breakout setup. VWAP at 3,992 provides secondary support if pennant breaks downward. However, Dow Theory still suggests the major trend remains bullish until lower lows appear. 🎪
Trading Range: 3,998-4,008 for scalpers this session.
━━━━━━━━━━━━━━━━━━━━━━━━━━━━━━━━━━
⚙️ 15-MINUTE TIMEFRAME (15M) - MICRO STRUCTURE
The 15M reveals highest volatility compression of all timeframes. This is the most dangerous zone for breakout traders. Bollinger Bands pinched to tightest range—explosion imminent. RSI bouncing between 40-60 shows indecision . However, the price holds above all three EMAs (5, 10, 20), keeping bias BULLISH .
Harmonic Ratios Alert: AB=CD pattern completing with 1:1 ratio precision at 4,015 resistance level. This is your reversal zone —watch for rejection or breakout confirmation. VWAP showing gradual upward slope, slight bullish edge. Volume oscillator trending higher despite price consolidation. 📈
Microstructure Trade Setup: Break above 4,010 = BUY SIGNAL with target 4,018-4,022 🚀
━━━━━━━━━━━━━━━━━━━━━━━━━━━━━━━━━━
⚡⚡ 5-MINUTE TIMEFRAME (5M) - ULTRA-INTRADAY
The 5M is showing inverse head and shoulders pattern —classic bullish reversal setup on ultra-short timeframe. Price formed left shoulder at 3,996, head around 3,993, right shoulder forming near 3,997. Neckline resistance at 4,002 = breakout target. Bollinger Bands in expansion mode with bullish candles forming. RSI already recovering above 50—momentum turning positive. ✅
CRITICAL SETUP: 5M chart is displaying BULL TRAP rejection followed by REVERSAL confirmation . This is your intraday traders' goldmine setup.
Volume surging on recent candles—institutional buyers stepping in. Ichimoku on 5M shows Tenkan-sen above Kijun-sen with positive cloud configuration. Exponential MAs all aligned bullish (5 > 10 > 20 > 50). This is textbook bullish alignment . 📊
5M Trading Opportunity: Enter BUY at neckline break (4,002-4,003) with tight 3-pips stop. Target 4,008-4,012 for quick scalp profits. ⭐
━━━━━━━━━━━━━━━━━━━━━━━━━━━━━━━━━━
📋 CONSOLIDATED TRADING STRATEGY FOR NOV 3-7, 2025
INTRADAY SCALP TRADERS (5M-15M): Focus on breaks above 4,010 with tight stops. Target quick 10-20 pips. Avoid trading below 4,000 support—risk/reward becomes unfavorable.
SWING TRADERS (1H-4H): Key decision point at 4,020 breakout level. If confirmed on 4H close, next target 4,050-4,075 range. Stop loss at 3,995 (weekly support). Holding period: 3-5 days.
POSITION TRADERS (1D-1W): Cup and Handle breakout completion expected. Once 4,020 breaks, potential move to 4,100+ within 2-3 weeks. This is accumulation phase completion.
━━━━━━━━━━━━━━━━━━━━━━━━━━━━━━━━━━
⚠️ RISK MANAGEMENT & VOLATILITY CONSIDERATIONS
Bollinger Bands volatility expanding = expect larger candle swings. Set wider stops accordingly.
RSI divergences on 4H/1D = potential reversal signals—honor these warnings.
Volume declining into consolidation = watch for gap moves when volume returns.
VWAP breaking = structural support compromised—switch to defensive mode.
Ichimoku Cloud crossovers = trend confirmation signals—don't fight cloud direction.
Maximum Leverage Recommendation: 1:5 ratio on this setup. Gold volatility demands respect. 💡
━━━━━━━━━━━━━━━━━━━━━━━━━━━━━━━━━━
🎯 KEY SUPPORT & RESISTANCE LEVELS THIS WEEK
CRITICAL SUPPORT ZONES:
3,975 (Weekly) | 3,990 (Daily VWAP) | 3,995-4,000 (Primary Short-term) | 4,003 (Current Price)
CRITICAL RESISTANCE ZONES:
4,010-4,015 (1H Swing High) | 4,020 (Daily Breakout Level) | 4,035 (Weekly Resistance) | 4,050 (Major Target)
━━━━━━━━━━━━━━━━━━━━━━━━━━━━━━━━━━
📊 HARMONIC & GANN PATTERN SUMMARY
Gartley Pattern (Daily): 0.618 retracement zone provides precision entry signals. Formation suggests completion wave incoming.
Gann Angles (4H): 45-degree support holding strong. Fan angles predict next resistance at 4,018-4,020.
Cup & Handle (1D): Breakout above handle resistance = confirmed. Target = height of cup (minimum 50 pips move = 4,050+).
Inverse Head & Shoulders (5M): Neckline at 4,002 is your battleground. Institutional accumulation visible.
━━━━━━━━━━━━━━━━━━━━━━━━━━━━━━━━━━
🔮 PROBABILITY WEIGHTED FORECAST (NOV 3-7)
BULLISH SCENARIO (70% Probability): Breakout above 4,020 mid-week, targeting 4,050-4,075 by Friday close. Volume confirmation required. This is the primary outlook based on all technical frameworks aligning.
BEARISH SCENARIO (20% Probability): Break below 3,995, retest 3,975 support, then recovery. This would create bear trap setup for aggressive buyers. However, probability is lower due to Ichimoku positioning and volume profile supporting bulls.
NEUTRAL SCENARIO (10% Probability): Consolidation between 3,990-4,010 entire week. Unlikely given pattern formations and indicators, but possible if macro news creates uncertainty.
━━━━━━━━━━━━━━━━━━━━━━━━━━━━━━━━━━
📌 TRADER CHECKLIST FOR THIS WEEK
✅ BEFORE TRADING: Review daily support/resistance levels | Check Ichimoku Cloud positioning | Confirm RSI alignment | Verify VWAP slope direction | Scan for volume profile changes
✅ DURING TRADES: Monitor 4H breakout confirmations | Watch for Bollinger Band extensions | Track volume participation | Honor Elliott Wave count updates | Use Gann angles as dynamic stops
✅ EXIT STRATEGY: Take 50% profit at first target (4,015) | Move stops to breakeven at +10 pips | Trail remaining position to 4,050 | Use Ichimoku cloud breaks as hard stops
━━━━━━━━━━━━━━━━━━━━━━━━━━━━━━━━━━
🌟 CONCLUSION: WHY THIS SETUP IS COMPELLING
The convergence of Elliott Wave Wave 5 setup, Harmonic Gartley completion, Cup & Handle breakout pattern, and synchronized bullish Ichimoku Cloud positioning creates a POWERFUL BULLISH CASE for XAUUSD this week.
Bollinger Bands expansion, RSI positive divergences, and Dow Theory higher highs confirmation provide MULTIPLE LAYERS OF CONFIRMATION . Wyckoff Theory accumulation pattern completing with volume surge into breakout zone.
The primary action this week: Watch 4,020 breakout on 4H timeframe. Confirmation closes above this level warrant aggressive long positions targeting 4,050-4,075 range.
Risk/Reward Ratio: 1:3.5 (EXCELLENT for swing trades) | Win Rate: 70% based on pattern probability | Holding Period: 3-5 days maximum
🚀 TRADE SETUP RATING: 9/10 - HIGHLY RECOMMENDED FOR SWING TRADERS 🎖️
━━━━━━━━━━━━━━━━━━━━━━━━━━━━━━━━━━
Disclaimer: This analysis is based on technical patterns and indicators as of November 1, 2025. Always use proper risk management, confirm signals independently, and consult your trading plan. Past performance doesn't guarantee future results. Trade responsibly.

XAUUSD BEARISH REVERSAL SETUP FROM SUPPLY ZONE🔍 Key Observations:
1. Market Structure Shift:
A Change of Character (CHoCH) has occurred near the upper boundary of the ascending channel.
This indicates a potential shift from bullish to bearish momentum.
2. Liquidity & Supply Zone:
The red zone near $4,044 – $4,018 acts as a supply zone or bearish order block.
Price has reacted from this level, rejecting higher prices.
3. Entry & Targets:
Entry: Around $4,011 – $4,018 (current zone)
Stop Loss: Above the recent high near $4,044
First Target (TP1): $3,977 – local liquidity zone
Second Target (TP2): $3,930 – $3,915 major demand area / imbalance fill zone
4. Channel Breakdown Potential:
If the price closes below the lower trendline of the ascending channel, a strong bearish continuation toward the lower targets is expected.
5. Smart Money Concept (SMC) View:
The chart aligns with liquidity grab above highs, followed by CHoCH, suggesting smart money selling pressure.
A retracement to premium zones has already happened, and distribution is likely underway.
📉 Bearish Outlook Summary:
Bias: Bearish
Entry Zone: 4,011 – 4,018
Stop Loss: 4,044
Target 1: 3,977
Target 2: 3,930 – 3,915
Invalidation: Break and close above 4,045 would negate bearish setup.

Gold - The bullrun is over today!💰Gold ( TVC:GOLD ) creates a massive top:
🔎Analysis summary:
Starting all the way back in 2015, Gold created a major rounding bottom pattern. After the breakout, Gold started its major bullrun, rallying about +300% over the past couple of years. But after this rally, Gold is now showing clear signs of a serious top formation.
📝Levels to watch:
$4,000
SwingTraderPhil
SwingTrading.Simplified. | Investing.Simplified. | #LONGTERMVISION

Continue to accumulate along the 4058 trend line⭐️GOLDEN INFORMATION:
Gold (XAU/USD) faces renewed selling pressure after an early Asian uptick toward $4,046, pausing this week’s rebound from its lowest level since October 6. The US Dollar (USD) holds near a three-month high following the Federal Reserve’s hawkish stance, weighing on the non-yielding metal.
Additionally, optimism over easing US–China trade tensions dampens safe-haven demand. Still, lingering worries about the prolonged US government shutdown could limit USD strength and offer some support to gold prices.
⭐️Personal comments NOVA:
market accumulation time, sideways around 4000. ended october with volatility
⭐️SET UP GOLD PRICE:
🔥SELL GOLD zone: 4058 - 4060 SL 4065
TP1: $4050
TP2: $4040
TP3: $4020
🔥BUY GOLD zone: 3887 - 3885 SL 3880
TP1: $3900
TP2: $3910
TP3: $3925
⭐️Technical analysis:
Based on technical indicators EMA 34, EMA89 and support resistance areas to set up a reasonable sell order.
⭐️NOTE:
Note: Nova wishes traders to manage their capital well
- take the number of lots that match your capital
- Takeprofit equal to 4-6% of capital account
- Stoplose equal to 2-3% of capital account
