Next week's trading strategy and analysisPolicy aspect: The loose tone of the Federal Reserve remains unchanged, and the liquidity dividend continues to be released.
The expectation for interest rate cuts remains flexible: The Federal Reserve cut interest rates by 25 basis points to 3.75%-4.00% as scheduled in October. Although Powell stated that an interest rate cut in December is "not inevitable", the CME FedWatch tool shows that the probability of a 25 basis point cut in December still reaches 67.8%, which is a decrease from 95.3% before Powell's speech, but the general direction of easing has not reversed. It is worth noting that the internal hawkish and dovish differences within the Federal Reserve have intensified (Milan advocates a 50 basis point cut, Schmid opposes a cut), and the meeting minutes of November may reveal more clues on easing, providing expected support for gold prices.
The termination of balance sheet reduction is a definite positive factor: The Federal Reserve clearly stated that it would end the reduction of the balance sheet on December 1 and fully reinvest the maturing bonds, releasing approximately 60 billion US dollars of liquidity to the market each month, equivalent to "implicit QE", directly reducing the holding cost of gold, and this policy dividend has not been fully priced.
There is room for economic data disturbances: The US government shutdown has led to the postponement of the release of several key data. Market judgments on the economic fundamentals are divided. If the ISM manufacturing PMI, non-farm payrolls, etc. data in the next week are not up to expectations (current expectations are PMI 49.2, non-farm payroll increase 170,000), it will further strengthen the expectation of easing.
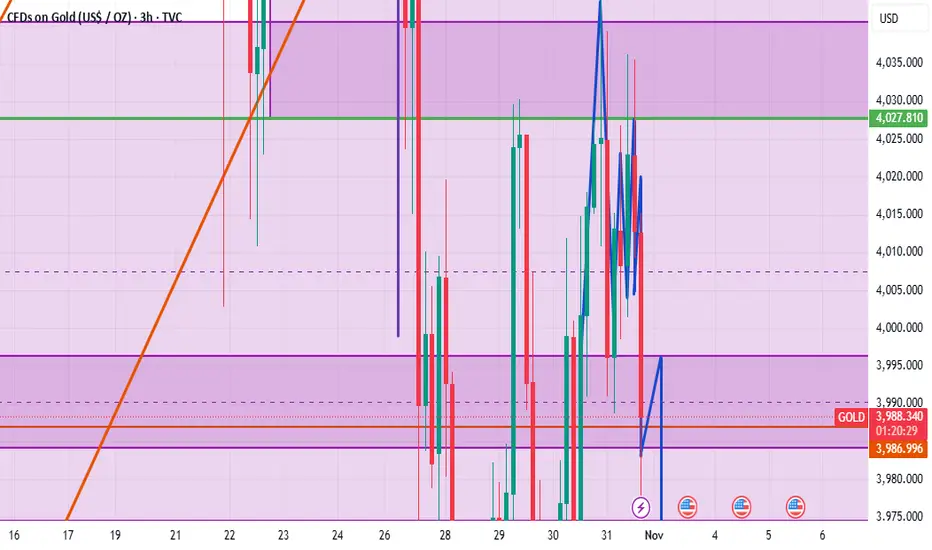
Next week's trading strategy and analysis
buy:4000-4010
tp:4025-4035-4100
sl:3995
Trade ideas

What will happen to gold on November 3rd?
I. Market Analysis
Trend Structure
Weekly Chart: Price is below the 5-week moving average, with the MACD showing a bearish crossover. Bearish forces dominate in the near term. However, the long-term ascending trendline support is near $3900. The long-term trend remains cautiously bullish as long as this level holds decisively.
Daily Chart: Moving averages are in a bearish alignment, and the Bollinger Bands are expanding downward, with price pressured near the middle/lower band. Key resistance is at 4046. Support is focused in the 3972-3950 zone. A break below 3972 could lead to a further decline towards 3950-3900.
Key Support & Resistance Levels
Resistance Zone: 4010 (Weakness Boundary) → 4023-4035 (Core Short Area) → 4047-4055 (Strong Resistance).
Support Zone: 3980 (Initial Support) → 3950-3955 (Long Area) → 3915-3885 (Deep Correction Target).
II. Trading Strategy
Core Idea: Prioritize selling on rallies, with opportunistic buying near key support levels. Strict risk control is essential.
Short Strategy (Primary)
Entry Zone: Enter short positions in batches between 4030-4035. Consider adding to shorts if price reaches 4047-4055.
Stop Loss: Above 4040-4060 (Adjust flexibly between 8-10 pips based on position size).
Targets: First target 3980, Second target 3960-3950 (Hold if broken).
Long Strategy (Secondary)
Entry Condition: Consider light long positions upon stabilization in the 3950-3955 zone after a pullback.
Stop Loss: Below 3940 (8-10 pips).
Targets: First target 3980-4000, Second target 4010 (Follow up if broken).
III. Risk Control Essentials
Position Management: Single trade position ≤ 5% of capital. Avoid heavy positions.
Stop-Loss Discipline: Strictly place stops for shorts above 4060 and for longs below 3940.
Contingency Alert: Monitor the US Dollar Index, Fed policy动向, and geopolitical risks closely. Adjust strategies promptly if key levels are breached.
IV. Summary
Gold's short-term technical posture is bearish, but the long-term trend requires monitoring the effectiveness of the 3900 support.
If price rallies and faces resistance in the 4030-4055 zone next Monday, prioritize short entries.
If price pulls back and stabilizes near 3950, consider light long positions for a bounce.
If price strongly breaks above 4060 or below 3940, a reassessment of the trend will be necessary.

XAUUSD – Corrective phase in progressGold is currently moving within a corrective phase, which appears to be developing as a WXY structure.
Price is now completing wave X, with one final minor wave C to the upside likely remaining.
The more probable scenario suggests a limited bullish move toward the 4140–4180 zone before continuing lower as part of wave Y.
Bullish trigger: 4046 (for the final leg of wave C)
Bearish alternative: A confirmed breakdown and consolidation below 3960 would invalidate the current count and shift focus to a continuation of the broader bearish move — in that case, the wave structure will be updated accordingly.

XAUUSD wave structure analysis on H1, M15 timeframesH1 swing is bullish => current is pullback down
M15 swing is bearish => currently is pullback up
We can look for selling opportunities when the price goes up to the supply zone of M15

XAU/USD Technical Analysis – Bearish Rejection at ResistanceXAU/USD) is currently trading around the $4,009 level after rebounding from a recent intraday low. The price action shows a clear rising channel structure, with the upper boundary acting as a significant resistance zone near $4,040 – $4,050.
The chart highlights a resistance level where price has repeatedly failed to sustain upward momentum, indicating a potential double-top or distribution pattern forming in this area.
If price fails to break and hold above the $4,020 – $4,040 resistance zone, bearish momentum may resume, potentially pushing gold toward the $3,950 area initially, followed by a deeper correction to the target level near $3,913.
Conversely, a decisive breakout and close above $4,050 could invalidate the bearish outlook, opening the way for further bullish continuation.
Key Levels:
Resistance Zone: $4,020 – $4,050
Immediate Support: $3,990
Target Level: $3,913
Trend Bias: Short-term bearish under resistance
Conclusion:
Gold is approaching a critical resistance area, and a rejection could confirm a short-term bearish reversal pattern. Traders should watch for confirmation near $4,020–$4,040 for potential short entries targeting $3,913. CME_MINI:NQ1! CME_MINI:MNQ1! CME_MINI:ES1! CME_MINI:MES1! COMEX_MINI:MGC1! CBOT_MINI:YM1! NYMEX:CL1! CME:BTC1! COMEX:SI1! NSEIX:NIFTY1! CME_MINI:RTY1!

Gold (XAUUSD): Possible buy setupGold (XAUUSD): Possible buy setup. All clear. Wait for a break, confirm, keep, tp.
Cheers

EXPECTATION FOR COMING WEEKS This sell today clears the way for a major sell from monday going to somewhere around 3860 before the rate and CPI buy start from there with momentum and incase the buy fail then that will lead to another long term sell , i will update anyway, no matter what happens.
LiamTrading - XAUUSD: Prospect of $5,000 USD and Priority BUY...LiamTrading - XAUUSD: Prospect of $5,000 USD and Priority BUY Strategy at POC $3973
Hello traders community,
Gold is positioned between an extremely optimistic long-term outlook (forecast of $5,000 USD in the next 12-18 months by Bank of America) and short-term technical adjustments.
Although Gold has broken the upward trendline, a sustainable downward trend has not been confirmed.
BUY positions are still prioritized!
🔥 LONG-TERM CONTEXT & INFLATION
Long-Term Driver: Gold prices adjusted for inflation have DOUBLED over the past 4 years.
Highlight: Gold reinforces its role as an anti-inflation asset as real prices soar to all-time highs.
📊 DETAILED TRADING PLAN (ACTION PLAN)
Strategy: Buy at POC Zone to leverage liquidity advantage.
🟢 BUY Scenario (BUY Primary) - Buy at High Value Zone
Logic: The $3973 - 3975$ zone is right above the Buy POC (highest value zone).
Entry (BUY): $3973 - 3975$
SL: $3968$
TP1: $3988$ | TP2: $4000
Buy Target 2: Buy when price retests the trendline around $4002$.
🔴 SELL Scenario (SELL Scalping) - Preemptive strike at resistance zone
Entry (SELL): $4032 - 4034$
SL: $4040$
TP1: $4022$ | TP2: $4015
📌 SUMMARY & DISCIPLINE (Liam's Note)With the $5,000 USD forecast and inflation factors, the risk of SELL is increasing.
Focus on BUY at POC $3973$ and absolute SL.
Trade responsibly and with discipline!

The end of goldGreetings, a pattern similar to the bullish trend has formed on the 4-hour timeframe, and as long as it is below 4000, it will reach 3600. May you be successful and victorious.

XAUUSD 15m Analysis (31st October 2025) TRADE IDEA SWING
Happy Friday guys, take it easy. Cheers
BUY/SELL SCENARIOS:
BUYS:
1) Body Candle Close the 4046.35 level.
2) Retest the 15m Bullish CHOCH at the 4046.35 level.
3) Create a 3/5m Bullish Engulfing Candle to capitalise on BUYS towards the 4144.50 level.
SELLS:
1) Body candle close below the 4016.34 level.
2) Retest the 15m Bearish CHOCH at the 4016.34 level.
3)Create a 3/5m Bearish Engulfing Candle to capitalise on SELLS towards the 3915.50 level.
Trade smart, Trade according to your trading plans guys.

XAU New Target Signal received, XAU is developing a new 4 hour bullish uptrend pattern. Target $4.7k to $4.8k.
This message is for educational purposes only.
Always DYOR.
Note: Tradingview doesn't allow me to share my technical analysis chart.

XAUUSDRisk warning, disclaimer: the above is a personal market judgment based on published information and historical chart data on Tradingview, all analysis is only subjective. Hope investors consider, that I am not responsible for your investment decision.
Thank you.
Good luck

xAU-USDThe hourly timeframe of the ANAs
has a downtrend line that must be broken to climb 📊🕯
and next to it, it has created a support level at 3022
So to climb in the ANAs and take a safe long, you should wait for the downtrend line to break 🚨🚀

GOLD IN A DANGER ZONE, SAFE ASSETS DAYS ARE GONE FOPR A WHILE?after a rally with small corrections since 2019. gold never saw a bear season or 35-39% correction
2026 might be the year for that to happen
DYOR

XAUUSD M30 TIME FRAME CHART ANALYSIS TARGET HIT Gold running 350++pips hit
Xauusd King here
Today 1000+pips hit gold
If you don't know about market don't trade


LONG XAUUSD 29 10 2025 This is totally Price analysis ass you can see in the 4hr chart we are targeting 4400 as of 29.10.2025 we closing the9nthly candle let us see how we close and open the following month

Gold Prices Retreat from Record High- FOMC on TapGold prices are retreating from record highs with a decline of more than 11.3% now testing a major pivot zone at the 38.2% retracement of the August advance at 3973- looking for a reaction off this mark with a break / close below needed to suggest a more significant high is in place / a larger correction is underway. Subsequent support objectives rest with the 50% retracement / October open at 3846/59 with broader bullish invalidation steady at 3700/20.
Initial resistance remains with the 10/21 reversal close at 4125 with a breach / close above 4251 needed to mark resumption of the broader uptrend. Keep in mind this is a massive week for event risk with the FOMC, BoC, ECB, and the BoJ interest rate decisions on tap as the government shutdown extends into the fourth week. Stay nimble into the releases and watch the weekly close here for guidance.
-MB

XAUUSD - Will Gold Continue to Fall?!Gold is trading below the EMA200 and EMA50 on the 30-minute timeframe and is trading in its descending channel. The reduction in its downward momentum in the demand range will provide us with a better risk-reward buying position. A move towards the supply range above the channel will be our next short trade!
Gold prices fell below $4,000 per ounce for the first time since October 10, following a sharp $125 decline.
According to a Reuters survey, the average gold price in 2026 is expected to reach $4,275 per ounce, while silver prices are projected to average $50 per ounce in the same year.
For 2025, the survey anticipates an average gold price of $3,400, up from $3,220 in the previous poll, while the average silver price is forecasted to rise to $38.45 from $34.52 previously.
Analysts at Nomura stated that U.S.–China relations have entered a repetitive cycle of tension, escalation, and temporary détente, likely forming a “new normal” in the long term.
Lu Ting, Nomura’s chief China economist, noted that the world’s two largest economies appear to be settling into a predictable pattern of “strain–escalation–pause”, which may define the framework of their relationship in the foreseeable future.
Recent trade talks in Kuala Lumpur hinted at a temporary easing of friction, with both sides reportedly considering limited concessions, such as extending tariff suspensions and resuming soybean imports from the U.S.
However, deep-seated disputes remain unresolved — including export restrictions on rare earth elements, compliance with trade commitments, and broader geopolitical disagreements — all of which cloud the outlook for bilateral relations.
Lu cautioned that while short-term cooperation may continue due to mutual economic dependence, long-term strategic competition between Washington and Beijing is expected to intensify.
Nomura believes this recurrent cycle of conflict and reconciliation will likely become the enduring pattern of U.S.–China relations.
Such a backdrop implies persistent volatility in global markets, particularly in commodities and technology sectors, which are highly sensitive to trade developments between the two nations.
Investors should prepare for alternating periods of optimism and renewed tension.
Meanwhile, Donald Trump’s proposed tariffs against Canada may turn into a major self-inflicted setback, as the move faces both a legal challenge before the U.S. Supreme Court and bipartisan opposition.
Next week, the Supreme Court is set to hear a case focusing on Trump’s use of the International Emergency Economic Powers Act (IEEPA) to justify these tariffs. Trump initially invoked an emergency declaration related to fentanyl to impose them — despite the fact that such powers are typically reserved for sanctions against U.S. adversaries.
The case represents not only a test of the tariffs’ legality, but also a measure of Trump’s and MAGA’s influence over the Court.
Notably, Senator Lisa Murkowski, a Republican, joined over 200 Democrats in sending a letter to the justices urging them to strike down the tariffs.
The oral arguments are scheduled for November 5, and the final ruling, which could serve as a major market mover, is expected sometime next year.
Currently, prediction markets estimate a 38% probability that the tariffs will be overturned.
At the same time, Morgan Stanley reported that U.S. dollar positioning has turned positive for the first time in several months, reflecting renewed investor confidence in the U.S. economic outlook.
This shift comes amid rising political instability in Japan and France, which has diminished the appeal of non-dollar assets and strengthened capital flows toward the greenback.
Strategists at the bank added that demand for downside protection against the dollar has declined, indicating that investors perceive a low risk of a sharp correction in the near term.
Nevertheless, Morgan Stanley warned that this uptrend might not be sustainable — if U.S. economic data, particularly employment figures, fail to show significant improvement, the dollar could again face renewed downward pressure, and rate-cut expectations from the Federal Reserve could rise.
Finally, Treasury Secretary Scott Bassent confirmed that five candidates have been shortlisted to succeed Jerome Powell as Federal Reserve Chair:
Christopher Waller, Michelle Bowman, Kevin Warsh, Kevin Hassett, and Rick Rieder.
Bassent stated that one more round of interviews will take place, and he plans to submit the final shortlist to President Trump after Thanksgiving, with a final decision expected before year-end.

XAUUSD Bearish Short-Term, Bullish Longer-TermFundamental approach:
- Gold prices traded lower this week after setting fresh record highs earlier in Oct, pressured by profit-taking and cautious sentiment ahead of delayed US inflation data.
- Geopolitical uncertainty and expectations of further Fed easing continued to support underlying demand for safe havens in the longer term.
- US President Trump'sTrump's new sanctions on Russia and export restrictions toward China, alongside the prolonged US government shutdown, reinforced demand early in the week. At the same time, stabilization in trade rhetoric and rising yields curbed momentum later.
- However, a stronger US dollar and rising Treasury yields amid improved global risk appetite and optimism around an upcoming US. China dialogue also reduced safe-haven demand in the short term, especially with today's CPI, which is expected to rise.
Technical approach:
- Gold consolidated within the range of 4054-4113. The price is below the converging EMAs, indicating that a bearish momentum persists.
- If the XAUUSD breaches the support at 4054, the price may decline further toward the next support level at 3950.
- On the contrary, remaining above 4054 may prompt a retest of the upper range at 4143, confluenced with the EMA21.
Analysis by: Dat Tong, Senior Financial Markets Strategist at Exness

20251028-XAUUSD IdeaThe major timeframe continues to exhibit a decline–consolidation–decline structure, confirming that it has officially entered a corrective phase.
Next, observe where Wave A completes and whether there is any market reaction around the 3791 level.

Analysis of goldIn my opinion, gold’s deep correction is still ongoing, at least until the 3800 area, which could act as a strong support level.
There’s a possibility that the price might rise again, mainly due to news about issues between China and the U.S.
Under normal conditions, I don’t see any motivation for buyers, and the chart confirms this view. It’s better to wait until the price reaches the 3800 zone — taking positions on either side at the current levels is risky.
