XAUUSD – 4H | Gold forecast: bullish recovery from demand zone 👋 Hi traders!
Gold is rebuilding structure above 4 000 after a liquidity sweep below 4 040 — buyers are stepping in again, showing strong reaccumulation.
Setup:
🎯 TP1: 4 160 — first structural target
🎯 TP2: 4 260 — liquidity objective
⛔ SL: 3 980 — below demand zone
Outlook:
Bias remains bullish while price holds above 4 000.
If momentum sustains, I expect continuation toward 4 160 → 4 260.
Ivanna View:
Smart Money keeps buying from the lows — expecting a clean expansion phase soon.
If you enjoy simple and structured market breakdowns, follow for more insights 💛
Trade ideas

xausudsecond scenario both giving wave 4 scenarios within different longer term counts. That give different wave levels as such this one can see 3700 area before next move or 38% att 3300 area. No doubt trend at this time is down but levels of reevrsal will be determined with pa

How to Identify Higher Highs and Lower Lows AccuratelyIn price action trading, identifying Higher Highs (HH) and Lower Lows (LL) may seem simple, but it’s actually one of the most essential foundations for reading market structure.
If you get it wrong, you’ll often end up trading against the trend without realizing it.
1. Understanding Higher Highs & Lower Lows
Higher High (HH): a new peak that’s higher than the previous one → indicates the uptrend is still intact.
Lower Low (LL): a new trough lower than the previous one → confirms the downtrend continues.
It sounds simple, but the tricky part lies in choosing the correct main swing to read from.
2. Common Mistakes That Mislead Traders
Many traders identify HH–LL patterns on very small timeframes, which causes confusion because of minor pullback waves inside the bigger trend.
Example:
The M5 chart might show HH–HL (uptrend), while the H1 chart is clearly forming LL–LH (downtrend).
If you buy based on the small timeframe, you’re essentially buying into a pullback.
💡 Pro tip: Always identify the main market structure on higher timeframes (H1–H4) before looking for entries on smaller ones.
3. How to Identify Them Accurately
Find the main swing:
Look for the points where price truly reverses with strong candles or noticeable volume.
Mark clear highs and lows using the swing high/swing low tool.
Check structural continuity:
If HH and HL remain intact → the trend is bullish.
If LL and LH keep forming → the trend is bearish.
If the structure breaks (for example, a HH forms in a downtrend) → the market may be shifting direction.
4. Practical Tips
Use the H4 timeframe to determine the overall trend.
Then, drop to M15 or M30 to locate precise HH/LL points for entry.
Avoid identifying HH/LL inside sideways (ranging) markets — it’ll only confuse your analysis.
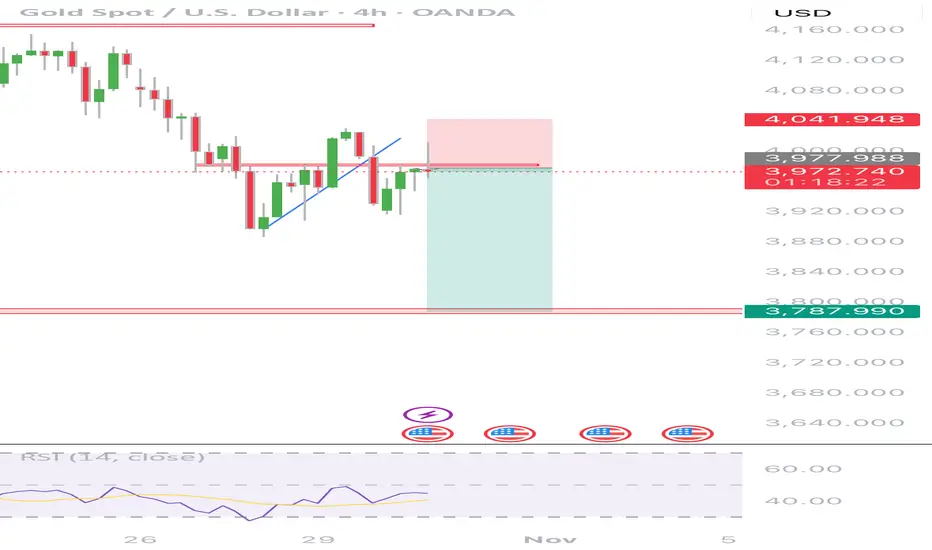
Gold 4-Hour Timeframe Analysis(Nuclear testing Resumed)Gold appears to be setting up for another potential short opportunity. Despite yesterday’s rate-cut announcement, price action showed limited bullish momentum, even after Chair Powell signaled the likelihood of an additional cut in December. This lack of upside response suggests continued bearish sentiment.
Additionally, geopolitical risk remains elevated. Reports indicate former President Trump may push to resume nuclear testing, in response to President Putin’s recent strategic posturing and threats involving advanced weapons systems. While such developments typically support safe-haven assets, gold has yet to reflect meaningful bullish follow-through following these headlines.
Overall, current structural behavior on the 4-hour chart continues to favor bearish movement unless a significant shift in fundamentals or market sentiment emerges
Gold's downward trend shows no signs of stopping sell on ralliesGold prices priced in the Fed's rate cut expectations yesterday, and quickly retreated after the data release. The bullish momentum was short-lived. After gold prices broke through $4000, almost everyone in the market believed a rebound was imminent. However, I maintain my view: yesterday's rebound was merely a corrective bounce after a sharp decline, just a sign of market recovery. The market is only rebounding, not reversing. Our short positions bought at 4020 have yielded substantial profits; you can refer to my post yesterday to verify its accuracy. The overall trend for gold remains bearish and volatile. Today, during the Asian session, we recommend selling on any rebounds.
The 1-hour moving averages for gold continue their downward crossover and bearish alignment, and the price has now fallen back below the moving averages, indicating that the bears are still slightly stronger. After the Fed data release, the price quickly retreated after reaching 4007, and the resistance at the 4000 level suggests that selling on rallies is the best strategy. The bulls failed to hold above 4000, and the bears have the upper hand.
Market conditions are constantly changing. Now that the bullish expectations have been priced in, gold has returned to a weak trend, and there is still room for further decline. The gold correction will continue.
Today's trading strategy: Short gold at 3985-3995, with a target of 3930-3920.

gold next week still downtrend target $3950🧭 Current Market Context (XAUUSD around 4111):
Price is below EMA 9 and failed to break above 4200–4250.
The structure shows lower highs → bearish continuation still dominant.
Momentum is weak, and buying pressure hasn’t confirmed reversal yet.
📉 Primary Plan (Bearish Bias – More Likely)
Entry: Wait for a 4H close below 4070–4050. Enter short/sell once confirmed.
Targets:
TP1 = 3950
TP2 = 3600
TP3 = 3500
TP4 (long-term) = 3100
Stop Loss:
Above 4250 (or above last swing high).
✅ Reason:
Trend still bearish.
EMA and structure show resistance above price.
Strong downside targets available.
✅ Reason: That breakout would invalidate bearish structure and shift momentum up.
⚠️ Key Tips
Don’t trade inside 4050–4250 (range zone, no clear direction).
Follow 4H or Daily candle confirmations — avoid early entries.
Risk only 1–2% of account per trade.
If shorting, take partial profit near 3600 and trail stops.

XAUUSD/GOLD 1H BUY PROJECTION 29.10.25It looks like you’ve uploaded a trading chart with marked levels and annotations. Here’s a quick breakdown of what’s visible:
Structure: The price had been in a downtrend, then broke the descending trendline, indicating a potential change of character.
Monthly Low Retested: The blue box labeled “MONTHLY LOW RETESTED” shows the area where price retested a previous low and found support.
Bullish Engulf Confirmed: Suggests a bullish reversal candlestick pattern forming near support.
Parallel Uptrend Channel: The two upward-sloping blue lines outline a new ascending channel, implying a short-term bullish bias.
Trade Setup:
Entry Zone: Around 3,950–3,960
Stop Loss: Below ~3,935
Take Profit / Resistance R1: Around 4,000–4,020
Bias: The chart suggests a long (buy) setup, expecting a move upward toward resistance within the parallel channel.
Would you like me to help you analyze the risk/reward ratio or validate the technical setup (e.g., confluence with higher timeframe structure or indicators)?

Dow Theory – A Compass to Help Traders Read Market TrendsHello everyone,
While Fibonacci, Trendlines, or Price Action can help you find precise entry points, nothing is more fundamental and reliable for understanding the market’s overall movement than Dow Theory . This isn’t an obscure or overly academic concept—it’s very practical. In fact, it underpins most of the trend-following strategies that traders use today.
Whether you trade Forex, Gold, Stocks, or Crypto, the core question remains the same: Is the market trending up, trending down, or just in a temporary correction? If you can’t answer this, all other technical analyses become meaningless. That’s why Dow Theory was developed—to serve as a compass, helping traders grasp the trend and make precise decisions.
Applying Dow Theory in Trading
The key to using Dow isn’t memorizing its principles; it’s about reading the real market and turning insights into action. When combined with tools like EMA and MACD , the market picture becomes much clearer: EMA shows the direction and momentum of price, while MACD alerts you to potential reversals.
For example, when prices are rising and EMA is pointing up, a MACD crossover or divergence signals a potential entry along the trend. At the same time, watching price patterns such as Head & Shoulders or Double Top/Bottom helps you anticipate trend reversals, avoiding false moves and short-term traps.
Of course, all these tools only work effectively if you manage your risk carefully , set Stop Loss levels based on price structure, and risk only a small portion of your account per trade. Dow reminds us that a trend continues until there’s a clear reversal signal, so don’t fight the market just because of a few opposing candles.
Once you grasp this principle, reading charts , identifying trends , and trading with the flow of money becomes natural and precise, without guesswork. More importantly, you’ll know when to stay out to preserve capital and when to step in to maximize profits.
That’s why Dow Theory remains a solid foundation for any trader looking to trade with the trend, whether in Forex, Gold, Stocks, or Crypto. So, are you ready to catch the market waves with Dow and capitalize on every swing?
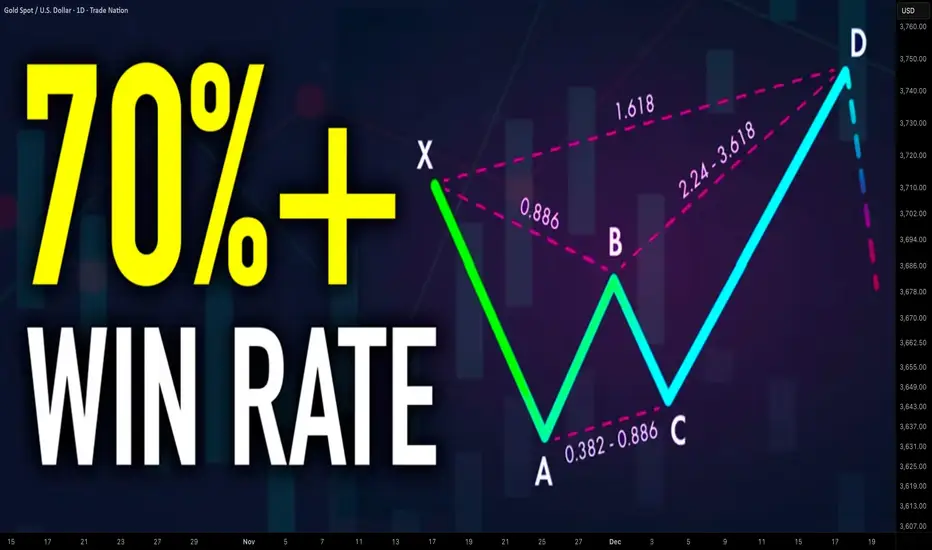
Best Harmonic Patterns For Beginners in Forex Gold Trading
In the today's article, I will share with you 4 best harmonic patterns for beginners. We will discuss the structure of each pattern and the rules.
Harmonic ABCD Pattern
That pattern is based on 3 legs of a price movement:
AB leg - impulse leg,
BC leg - retracement with the range of XA leg,
CD leg - impulse leg that has the same direction, the same time horizon and the same length as the XA leg
AB and BC legs should be equal or almost equal, that makes the pattern harmonic.
The completion point of the pattern - D point can be applied for predicting a pullback.
ABCD pattern can be bullish and bearish.
In a bullish ABCD pattern, AB leg is bearish.
D point of the pattern will be a safe point to buy from.
In a bearish ABCD pattern, AB leg is bullish.
D point will be a safe place to sell from.
The next 3 patterns will be based on 4 legs of a move:
XA, AB, BC, CD and will have XABCD structure with the initial point of the pattern being X point.
D point will be a completion point of the pattern from where a pullback will be anticipated.
The type of the harmonic pattern will be identified with Fibonacci numbers. The exact placement of each point of the pattern will define the name of the pattern.
Harmonic Gartley Pattern
In Harmonic Gartley,
B point of the pattern should strictly be between 618 and 786 retracement of the XA leg.
C point should lie between 618 and 786 retracement of AB leg.
D point will be 1.272 extension of AB leg.
Bullish Gartley Pattern will be based on a bullish XA leg.
Bearish Gartley will be based on a bearish XA leg.
Harmonic Bat Pattern
In Harmonic Bat,
B point of the pattern should strictly be between 50 and 618 retracement of the XA leg.
C point should lie between 618 and 1 retracement of AB leg.
D point will be 886 retracement of XA leg.
Bullish Bat Pattern will be based on a bullish XA leg.
Bearish Bat will be based on a bearish XA leg.
Harmonic Cypher Pattern
In Harmonic Cypher,
B point of the pattern should strictly be between 382 and 618 retracement of the XA leg.
C point should lie between 1.272 and 1.414 extension of XA leg.
D point will be 786 retracement of XC leg.
Bullish Cypher will be based on a bullish XA leg.
Bearish Cypher will be based on a bearish XA leg.
These patterns are phenomenally accurate and they are very simple to recognize.
❤️Please, support my work with like, thank you!❤️
I am part of Trade Nation's Influencer program and receive a monthly fee for using their TradingView charts in my analysis.
Channel Resistance Holding - Short OpportunityHello Followers, I am going to share you my opinion on gold next move..
Gold is working in a parallel channel couple of days, gold has formed a proper channel, it is respecting lower lows and lowers highs. gold Current Price is 3975.. It is possible that now gold fly high till the resistance area 4020/4045. And then it will form an other an otherwise around the target area 3850. If gold break the resistance then we have an stoploss around4090..
KEYPOINTS:
Current Price 3975
Target Area 3850
Resistance area 4020/4045
Stop Loss Point 4090

gold can back to 3700 areagold can back to 3700 area then start new + wave
now i put sellstop in last low( trend line break mean can go downer) with tp= fibo 60% and sl=last high on H4
waite time= 1 week
Alert= break high is new buy signal can push gold near 5000
wish you win

XAUUSD 15m | Liquidity Sweep → Demand Zone → Bullish ContinuatioAfter a clean liquidity sweep below the previous low (marked with the $ sign), price reacted strongly from a demand zone, showing a shift in market structure to the upside.
We’ve since seen a bullish displacement that created a Fair Value Gap (FVG) and a clear retest zone where price is now reacting.
This setup aligns with a short-term bullish bias, aiming for a continuation toward higher liquidity resting above recent swing highs.
⸻
📊 Setup Breakdown:
• Pair: XAUUSD
• Timeframe: 15m
• Bias: Bullish
• Entry: ~3970
• Stop-Loss: 3883.9
• Target: 4151
• Risk-to-Reward: ~1:4
⸻
🔍 Confluences:
• Liquidity sweep below equal lows
• Strong bullish displacement and market structure shift
• Price mitigating demand zone / FVG
• Clean imbalance above targeting liquidity at 4,150
⸻
🧠 Trade Idea:
Looking for continuation toward 4,150 as long as 3,913 holds. Any deeper retrace into the demand zone is still valid as long as structure remains intact.
⸻
#XAUUSD #Gold #SmartMoney #PriceAction #LiquiditySweep #FVG #TradingView #ICTConcepts

XAUUSD is on hunt [710 pips TP hit in last setup]Today's Buyers were dominant on both Tokyo & EU session hold the Range of 3935-4000.
As we were buy from 3935-3940 zone and our Tps Hit at 4005
What are my conditions For This setup?
Currently 2 buy zones we have
I expecting the market has to rise from 3975-3972 area
H1-H4 candle closing should be above 3975-3980.
Targets: 4005- 4028
✳️Secondly if H4-H1 candle closes below 3970 our buying will be compromised & and market will again retest 3930 for bottom liquidity

Gold Holds Firm Ahead of FOMC DecisionGold has shown a clear break of structure (BOS) on the 1H timeframe, confirming a shift from a previous downtrend into a bullish continuation phase. After rebounding from the support area, the price is holding above both moving averages, signaling strong buying interest. A short-term consolidation phase could lead to another upside move toward the next resistance zone as long as support holds.
Key Levels:
Buy Entry: 4000
Take Profit: 4070
Stop Loss: 3960
Reasoning:
Technically, price action confirms a trend reversal with multiple bullish structure breaks (BOS 1H & 2H) and consistent higher lows. Buyers continue to defend the support area, keeping momentum aligned with the broader bullish bias.
Fundamentally, softening U.S. dollar sentiment and stable Treasury yields support gold’s recovery, as traders look for safety ahead of key U.S. economic data and the upcoming FOMC communication.
Disclaimer:
This analysis is for educational purposes only and does not constitute financial advice.

GOLD | Bearish Bias Holds Below $3,944 Amid Trade OptimismGOLD – MARKET OVERVIEW | Trades Below $4,000 as Risk Appetite Rises
Gold continues to slide, as optimism over a potential U.S.–China trade deal and improving global outlook weakens demand for safe-haven assets.
The metal is now down nearly 10% from its all-time high of $4,377 (Oct 20), with the recent rally losing steam as traders take profits amid signs of progress in trade negotiations between the world’s two largest economies.
Technical Overview
Gold dropped nearly $150, exactly as projected in our previous outlook.
The price remains under bearish pressure while below 3,944, targeting 3,893, and a break below that could extend the decline toward 3,855 → 3,818.
However, a 1H close above 3,944 would indicate a potential reversal, opening the way for a retest of 3,970 → 4,011.
Key Technical Levels
Pivot Zone: 3,932 – 3,944
Support: 3,893 · 3,855 · 3,819
Resistance: 3,970 · 4,011 · 4,053
Outlook:
Gold stays bearish below 3,944, with downside potential toward 3,855 if trade optimism persists.
Only a confirmed 1H close above 3,944 would shift bias back to short-term bullish toward 4,011.

POTENTIAL FOR THE GOLD MARKETXAU/USD 4H - As you can see I have marked out two potential outcomes for this pair on how I feel price could play out over the course of the next few days, both setups are valid and seem realistic.
Setup B is the most likely setup in my eyes and this is because I feel price is exhausted, the Demand in the market is running out, hence the big move to the downside. I feel price will have to come lower in order to pick up more Demand before the next bull run.
However price has traded down and into a Demand Zone and we are seeing large amounts of volume being introduced, and with the current state of the US economy the Gold Spot could still just be out-powering the Dollar.
Setup A would be following the prevailing trend and overall be a safer option as this market is bullish dominant but its important we wait for entry confirmation before we execute, looking for the break to the upside first followed by a pullback.

XAUUSD Weekly Technical Forecast: Deep Dive AnalysisTraders, gear up for a pivotal week in Gold! As of the close at 4,112.84 on Oct 25th , XAUUSD is at a critical juncture. This analysis blends classic theory with modern indicators for intraday swings and positional trades. Bulls and bears are in a fierce battle ⚔️.
The stage is set for a significant volatility expansion. The key is to identify the dominant auction.
🎯 1D & 4H: The Swing Trade Panorama (Swing Bias)
The higher frames dictate the primary trend. The 1D chart shows a potential completion of an Elliott Wave corrective pattern (ABC) , suggesting a new impulsive wave up may be imminent.
Dow Theory : Higher highs & higher lows remain intact on the 1D, confirming the primary uptrend. ✅
Wyckoff Theory : We appear to be in a 'Spring' or 'Sign of Strength' phase after a re-accumulation period around the 4,080-4,100 zone.
Ichimoku Cloud : Price is trading above the Kumo (cloud) on 1D, a bullish bias. The Tenkan-sen (blue line) is a key dynamic support.
Key S&R : Major support rests at 4,080 (previous resistance, 50 EMA). Resistance is at the recent high of 4,140 .
A decisive 4H close above 4,130 could trigger a Bullish Breakout 🚀 targeting 4,180-4,200. Conversely, a break below 4,080 on high volume could see a drop to 4,040.
⏰ Intraday Focus: 1H, 30M, 15M, 5M (Intraday Bias)
For intraday action, lower timeframes offer precision entries.
Harmonic & Gann Theory : A clear Bullish Bat Pattern has potentially completed on the 1H chart. The PRZ (Potential Reversal Zone) aligns perfectly with the 4,100-4,105 support. Gann's 50% retracement level from the last swing up also converges here.
Bollinger Bands (20,2) : On the 1H/4H, price is hugging the upper band, indicating strong momentum. A squeeze on the 30M chart suggests a volatility expansion is due.
RSI (14) : On the 1H, RSI is in the 55-60 range, showing healthy momentum without being overbought. Watch for bearish divergence on a new high as a reversal signal.
VWAP & EMA Confluence : The 20 and 50 EMAs are providing dynamic support on pullbacks. For day trades, the VWAP on the 15M/5M charts will be your best friend for trend alignment. Long above, short below.
🚦Trade Plan: Entries, Exits & Risk Management
Identifying reversals is key. Use Japanese Candlesticks at key S&R levels. A bullish engulfing or morning star pattern at the 4,100 support, confirmed by a rising volume spike, is a high-probability long signal.
Swing Long Entry : On a 4H close > 4,130, or a pullback to 4,100-4,105 with bullish confirmation.
Swing Short Entry : On a 1D close < 4,080, targeting 4,040.
Intraday Long : Buy on a bounce from VWAP/20 EMA on the 15M chart with RSI > 50.
Intraday Short : Sell on a rejection from the 4,125-4,130 resistance with a bearish RSI divergence.
Stop-Loss : Always 15-20 pips below/above your entry trigger candle.
💡The Bottom Line:
The bullish structure is favored as long as 4,080 holds. The confluence of Harmonic patterns, Wyckoff accumulation, and bullish Ichimoku alignment points to a potential leg higher. However, respect the levels. A break below support will invalidate the bullish thesis.
Track these charts live:
1D:
4H:
1H:
30M:
15M:
5M:
⚠️ Disclaimer: This post is educational content and does not constitute investment advice, financial advice, or trading recommendations. The views expressed here are based on technical analysis and are shared solely for informational purposes. The stock market is subject to risks, including capital loss, and readers should exercise due diligence before investing. We do not take responsibility for decisions made based on this content. Consult a certified financial advisor for personalized guidance.

Gold Has Entered the Fifth Wave — A Drop Below 3800 Is PossibleGold continued its Wave-4 rebound today, but following a news catalyst, Wave-5 downward momentum began, and the market structure has become clearer. In such conditions, what traders need most is patience.
From the daily chart perspective, there still appears to be room for further downside. Based on my expectation, this decline may break below 3800. Of course, the market is always changing, and our outlook is based on probabilities — no one can guarantee the market will move exactly as expected. However, recent price action has been largely in line with our forecast, and I believe many of you have already secured profits from this move — that’s what matters.
Additionally, I will be traveling tomorrow and won’t be able to monitor the market in real time. So during your trades, please stay alert and prioritize risk control. Protect your capital first — profits will come naturally afterward. The market never lacks opportunities, so don’t sacrifice long-term stability for short-term gains.
Stay calm, stay disciplined, and trade safely!

GOLD Long IdeaI have already entered in gold on the 15 min timeframe however it is based off the weekly FVG hopefully price will hold and target is at all time highs

Gold sellPrice is in a POI and intraday structure is bearish. Plus, at current price action there is a structural disruption.

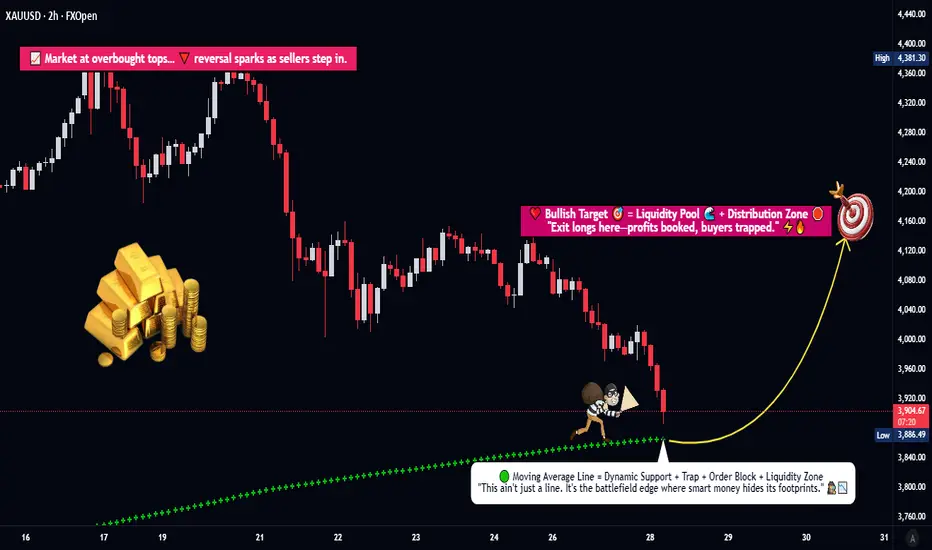
Is This the Start of Gold’s Next Major Upswing?🦸♂️ Title: XAU/USD Heist: The Golden Pullback Play (Swing/Day Trade) 💰
📈 Executive Brief (The "Why")
The shiny rock is pulling back to a key support zone! We're looking for a potential bullish continuation swing. The plan is to catch the dip as it retests a dynamic support level, aiming for a ride back up to a major resistance area. This is a classic "buy the dip" setup in a structurally strong asset.
🎯 The Trade Plan (The "How")
Asset: XAU/USD (Gold)
Bias: Bullish
Strategy: Pending Order on a Pullback
📍 Entry Zone:
YOU CAN ENTER THE MARKET AT ANY PRICE LEVEL AFTER THE WEIGHTED MOVING AVERAGE PULLBACK @ ~3860.00
(Look for a bullish rejection candle or momentum shift confirming the bounce)
🚨 Stop Loss (The "Escape Route"):
This is thief SL @ ~3760.00
Place your SL after the breakout I mentioned price level. This level is below the recent swing low, invalidating the bullish structure if breached.
🎯 Take Profit (The "Cash Out"):
OUR target @ ~4150.00
This aligns with a strong resistance + overbought + trap is there so kindly escape with profits. We're taking profits before price potentially reverses.
⚖️ Risk & Reward Management (The Fine Print)
Note to the Thief OGs: Dear Ladies & Gentleman, I am not recommending to set only my SL & TP. It's your own choice. You can make money, then take money at your own risk. Manage your position size accordingly! The provided levels are a framework, not a financial command.
🌍 Related Pairs to Watch (The Intel)
TVC:DXY (U.S. Dollar Index): Gold's arch-nemesis! 👊 A weaker DXY often means a stronger Gold price. Watch this for correlation cues.
$EUR/USD: The biggest component of the DXY. A strong Euro often pressures the Dollar, which can boost Gold.
$XAG/USD (Silver): Gold's volatile cousin. Often moves in the same direction but with more amplitude.
AMEX:GLD / AMEX:IAU : Gold ETF proxies; they track the physical metal's price.
Key Correlation Point: Gold is typically inversely correlated with the U.S. Dollar. Keep one eye on the Dollar Index for confirmation of your Gold trade's direction.
✨ Community Boost
“If you find value in my analysis, a 👍 and 🚀 boost is much appreciated — it helps me share more setups with the community!”
#Gold #XAUUSD #Trading #SwingTrading #TechnicalAnalysis #Finance #Pullback #WMA #DXY #Forex
Is gold about to experience a new rally?Is gold about to experience a new rally?
Currently, the gold market is experiencing significant volatility at high levels, and it's time to choose a direction, as shown in the chart.
After a series of sharp gains, there has been a significant technical pullback this week, but the core logic driving gold's long-term upward trend remains unchanged.
Policy expectations are in focus:
The market currently generally expects the Federal Reserve to cut interest rates by 25 basis points at next week's meeting.
This is the most important event currently hanging over the market, and any unexpected announcement could trigger significant market volatility.
Beware of volatility amplification: Due to unstable market sentiment and major events expected next week, gold price volatility has significantly increased.
Exchanges have also increased margin requirements for gold futures, which may force some leveraged traders to exit the market, further exacerbating market volatility.
As shown in Figure 4h:
Technical Analysis: Strong support exists in the $4,000-4,050 range. The pullback from the high has formed a bearish flag pattern, with significant resistance above.
Current Position: After plummeting from its all-time high of $4,379 to $4,010, gold is currently stabilizing above the key psychological level of $4,100.
Support and Resistance:
Key Support: $4,080, $4,030, and $4,000 are three key support levels.
If $4,000 falls below, the correction could intensify.
Key Resistance: Upside resistance lies near $4,170 and $4,220. A break above $4,220 could lead to a retest of $4,300.
Technical Pattern: Short-term consolidation.
The key trading strategy for Monday (October 28) is range-bound trading.
Key Trading Strategy:
Buy on dips: If gold can hold between $4,090 and $4,100 after Monday's opening, consider building a position in batches, with a short-term target of $4,150 to $4,170.
Short on rallies: If gold rebounds to resistance near $4170 or $4220 and shows signs of resistance, consider shorting with a small position, with a short-term target below $4100.
Risk Management Tips:
Stop-loss for long positions: It is recommended to set a stop-loss below $4080. If the price falls below $4080, be wary of the risk of a further decline to $4030.
Stop-loss for short positions: It is recommended to set a stop-loss above a key resistance level (such as $4220).
Important Tips:
Trade cautiously and maintain a small position: With the Federal Reserve's interest rate decision expected early next Thursday (October 31st), market uncertainty is extremely high.
It is recommended to reduce positions and avoid heavy holdings before mid-next week.
Avoid chasing highs and lows: In the current volatile market, chasing orders is extremely risky and can easily be wiped out by short-term fluctuations.
Always wait for the price to retreat to support or rebound to resistance before taking action.

XAU / USD 30 Minute Chart ( Buy Scalp In Progress )Hello traders. As per my last chart, I took the trade at the green line marked on the chart. I caught around 80 pips or so and closed 75% of the trade. The remaining 25% of the trade is my runner. My stop loss as well above my entry point, so zero loss. One trade, boom. Done for the day. Big G gets my thanks. Hope some of you caught the move up.
