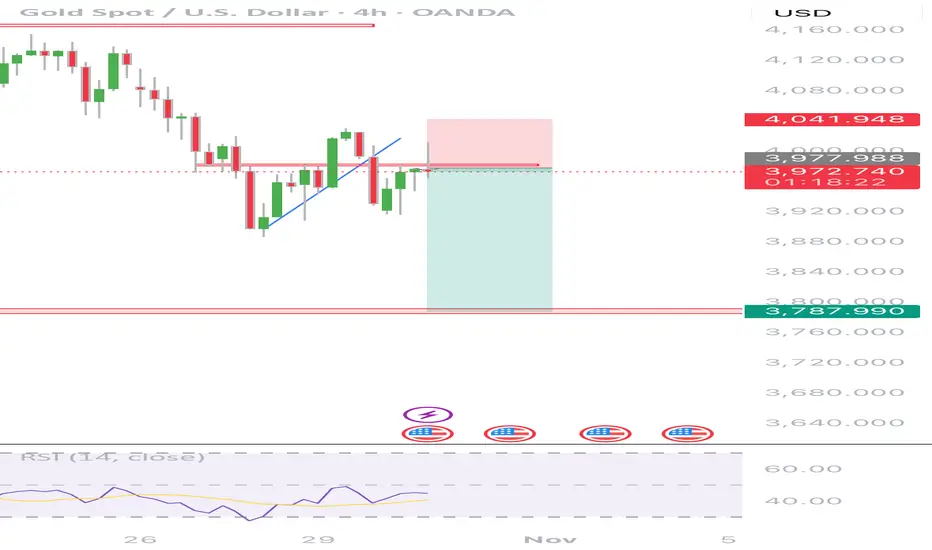
Gold 4-Hour Timeframe Analysis(Nuclear testing Resumed)Gold appears to be setting up for another potential short opportunity. Despite yesterday’s rate-cut announcement, price action showed limited bullish momentum, even after Chair Powell signaled the likelihood of an additional cut in December. This lack of upside response suggests continued bearish sentiment.
Additionally, geopolitical risk remains elevated. Reports indicate former President Trump may push to resume nuclear testing, in response to President Putin’s recent strategic posturing and threats involving advanced weapons systems. While such developments typically support safe-haven assets, gold has yet to reflect meaningful bullish follow-through following these headlines.
Overall, current structural behavior on the 4-hour chart continues to favor bearish movement unless a significant shift in fundamentals or market sentiment emerges
Trade ideas
Gold's downward trend shows no signs of stopping sell on ralliesGold prices priced in the Fed's rate cut expectations yesterday, and quickly retreated after the data release. The bullish momentum was short-lived. After gold prices broke through $4000, almost everyone in the market believed a rebound was imminent. However, I maintain my view: yesterday's rebound was merely a corrective bounce after a sharp decline, just a sign of market recovery. The market is only rebounding, not reversing. Our short positions bought at 4020 have yielded substantial profits; you can refer to my post yesterday to verify its accuracy. The overall trend for gold remains bearish and volatile. Today, during the Asian session, we recommend selling on any rebounds.
The 1-hour moving averages for gold continue their downward crossover and bearish alignment, and the price has now fallen back below the moving averages, indicating that the bears are still slightly stronger. After the Fed data release, the price quickly retreated after reaching 4007, and the resistance at the 4000 level suggests that selling on rallies is the best strategy. The bulls failed to hold above 4000, and the bears have the upper hand.
Market conditions are constantly changing. Now that the bullish expectations have been priced in, gold has returned to a weak trend, and there is still room for further decline. The gold correction will continue.
Today's trading strategy: Short gold at 3985-3995, with a target of 3930-3920.

Potential bearish drop?The Gold (XAU/USD) has rejected off the pivot and could drop to the 1st support, which aligns with the 78.6% Fibonacci retracement.
PivotL 4,016.90
1st Support: 3,791.73
1st Resistance: 4,131.50
Disclaimer:
The above opinions given constitute general market commentary, and do not constitute the opinion or advice of IC Markets or any form of personal or investment advice.
Any opinions, news, research, analyses, prices, other information, or links to third-party sites contained on this website are provided on an "as-is" basis, are intended only to be informative, is not an advice nor a recommendation, nor research, or a record of our trading prices, or an offer of, or solicitation for a transaction in any financial instrument and thus should not be treated as such. The information provided does not involve any specific investment objectives, financial situation and needs of any specific person who may receive it. Please be aware, that past performance is not a reliable indicator of future performance and/or results. Past Performance or Forward-looking scenarios based upon the reasonable beliefs of the third-party provider are not a guarantee of future performance. Actual results may differ materially from those anticipated in forward-looking or past performance statements. IC Markets makes no representation or warranty and assumes no liability as to the accuracy or completeness of the information provided, nor any loss arising from any investment based on a recommendation, forecast or any information supplied by any third-party.

The end of goldGreetings, a pattern similar to the bullish trend has formed on the 4-hour timeframe, and as long as it is below 4000, it will reach 3600. May you be successful and victorious.

What is the purpose of this back-and-forth market manipulation?#XAUUSD OANDA:XAUUSD TVC:GOLD
Gold prices have broken through short-term resistance due to news, and the hourly and 4-hour charts show prices above the middle Bollinger Bands. Therefore, we need to adjust our strategies accordingly. However, the market is currently fluctuating rapidly, and entering the market rashly in the short term still carries significant risks. Therefore, the wise choice is to wait and see, and enter the market only after the market stabilizes. In the short term, the upside resistance level to watch remains at 4030. If gold breaks through this level strongly during the US session, the price may test 4050. The initial support level to watch is 3980-3960. If the price retraces but does not break through this level, consider taking small long positions in gold in batches, with a target of 4010-4030. Temporary adversity is the best test for traders; setbacks only make us stronger. Success belongs to the confident, opportunity belongs to the pioneers, and miracles belong to the persistent! 💪💪💪

gold can back to 3700 areagold can back to 3700 area then start new + wave
now i put sellstop in last low( trend line break mean can go downer) with tp= fibo 60% and sl=last high on H4
waite time= 1 week
Alert= break high is new buy signal can push gold near 5000
wish you win

XAU/USD Bullish Outlook - Strategic Entry & Exit Plan🟡💰 XAU/USD — “Gold Rush or Police Trap?” ⚡ Thief Strategy Playbook 🎯
Asset: XAU/USD “Gold vs U.S. Dollar”
Market Type: Crypto / Metals Cross (Swing / Day Trade)
Bias: Bullish 🟢
🔓 Thief’s Entry Game Plan (Layer Method)
This isn’t your typical sniper-entry… this is the Thief Strategy™ — a layering style method using multiple limit orders for flexible accumulation.
💎 Layer Entries:
4000.00 ✅
4025.00 ✅
4050.00 ✅
(You can increase or adjust the layers based on your risk appetite & setup.)
🛡️ Stop Loss (Thief’s SL): @3950.00
“Dear Ladies & Gentlemen (Thief OG’s) — I’m not recommending my SL; it’s just my escape route.
Trade smart, take your profits, and move at your own risk.”
🎯 Target Zone — “Police Barricade Ahead 🚨”
The 4200.00 zone acts as a strong resistance + potential trap area — heavy liquidity and overbought conditions live there.
Be wise, secure the bag 💼, and slip out before the market cops show up.
📊 Key Technical Notes
Momentum shows gold buyers reclaiming upper zones after liquidity grabs.
Higher-timeframe structure: Still bullish unless 3950.00 breaks cleanly.
RSI divergence & volume spike hint at layered re-accumulation potential.
🔗 Related Pairs to Watch & Correlations
💵 TVC:DXY — Inverse correlation; stronger dollar → gold pullback risk.
BITSTAMP:BTCUSD — Occasionally follows gold sentiment under risk-off conditions.
💹 TVC:SILVER (XAGUSD) — Often moves in tandem; can confirm metal-sector strength.
💱 FX:USDJPY — Watch for safe-haven flows; yen strength = gold demand uptick.
⚙️ Market Sentiment (London Session Focus)
📈 Bullish tone continuing through European hours.
🔍 Institutions layering bids near 4000–4050 liquidity pocket.
⏱ Short-term pullbacks expected before breakout continuation.
✨ “If you find value in my analysis, a 👍 and 🚀 boost is much appreciated — it helps me share more setups with the community!”
📜 Disclaimer:
This is a Thief-style trading strategy — just for fun & educational purposes only.
Not financial advice. Trade responsibly — steal profits, not peace. 🕶️
#XAUUSD #Gold #ThiefTrader #SwingTrade #LayerEntry #Forex #DayTrading #TechnicalAnalysis #MarketStrategy #GoldTrading #XAU #PriceAction #SmartMoney #LondonSession #TradingViewIdeas

If $GOLD is at its peak, is $BTC next?Gold has been rejected at the 0.618 level of the Fibonacci channel on the 3M chart.
The Stoch RSI demonstrates a striking similarity to past cycles:
The bullish structure, which continued in the overbought region in October 2010, peaked 273 days later in July 2011.
Momentum, which continued in the overbought region again in October 2019, reached its peak 365 days later in October 2020.
Today, history paints a similar picture once again.
The bullish structure, which began in the overbought region in October 2024, may have reached its peak approximately one year later, in October 2025, just as in previous cycles.
Gold appears to be completing its historical rhythm once again.
Note: The Bitcoin / Gold pair is developing in the opposite direction.

Channel Resistance Holding - Short OpportunityHello Followers, I am going to share you my opinion on gold next move..
Gold is working in a parallel channel couple of days, gold has formed a proper channel, it is respecting lower lows and lowers highs. gold Current Price is 3975.. It is possible that now gold fly high till the resistance area 4020/4045. And then it will form an other an otherwise around the target area 3850. If gold break the resistance then we have an stoploss around4090..
KEYPOINTS:
Current Price 3975
Target Area 3850
Resistance area 4020/4045
Stop Loss Point 4090

Is This the Start of Gold’s Next Major Upswing?🦸♂️ Title: XAU/USD Heist: The Golden Pullback Play (Swing/Day Trade) 💰
📈 Executive Brief (The "Why")
The shiny rock is pulling back to a key support zone! We're looking for a potential bullish continuation swing. The plan is to catch the dip as it retests a dynamic support level, aiming for a ride back up to a major resistance area. This is a classic "buy the dip" setup in a structurally strong asset.
🎯 The Trade Plan (The "How")
Asset: XAU/USD (Gold)
Bias: Bullish
Strategy: Pending Order on a Pullback
📍 Entry Zone:
YOU CAN ENTER THE MARKET AT ANY PRICE LEVEL AFTER THE WEIGHTED MOVING AVERAGE PULLBACK @ ~3860.00
(Look for a bullish rejection candle or momentum shift confirming the bounce)
🚨 Stop Loss (The "Escape Route"):
This is thief SL @ ~3760.00
Place your SL after the breakout I mentioned price level. This level is below the recent swing low, invalidating the bullish structure if breached.
🎯 Take Profit (The "Cash Out"):
OUR target @ ~4150.00
This aligns with a strong resistance + overbought + trap is there so kindly escape with profits. We're taking profits before price potentially reverses.
⚖️ Risk & Reward Management (The Fine Print)
Note to the Thief OGs: Dear Ladies & Gentleman, I am not recommending to set only my SL & TP. It's your own choice. You can make money, then take money at your own risk. Manage your position size accordingly! The provided levels are a framework, not a financial command.
🌍 Related Pairs to Watch (The Intel)
TVC:DXY (U.S. Dollar Index): Gold's arch-nemesis! 👊 A weaker DXY often means a stronger Gold price. Watch this for correlation cues.
$EUR/USD: The biggest component of the DXY. A strong Euro often pressures the Dollar, which can boost Gold.
$XAG/USD (Silver): Gold's volatile cousin. Often moves in the same direction but with more amplitude.
AMEX:GLD / AMEX:IAU : Gold ETF proxies; they track the physical metal's price.
Key Correlation Point: Gold is typically inversely correlated with the U.S. Dollar. Keep one eye on the Dollar Index for confirmation of your Gold trade's direction.
✨ Community Boost
“If you find value in my analysis, a 👍 and 🚀 boost is much appreciated — it helps me share more setups with the community!”
#Gold #XAUUSD #Trading #SwingTrading #TechnicalAnalysis #Finance #Pullback #WMA #DXY #Forex
XAUUSD – Gold Eyes a Breakout Above $4,030: Momentum Still Build🟢 XAUUSD | Gold Breakout Setup – Educational Analysis
Gold continues to show constructive price action following sustained bullish momentum across intraday timeframes. After a healthy consolidation phase, the market is now testing a critical resistance zone around $4,030.
A clean breakout and confirmed 1H close above $4,030 would signal renewed strength, aligning with the broader bullish structure observed on higher timeframes (4H & Daily).
🔹 Technical Outlook
The current structure suggests the potential for continuation toward higher liquidity zones if the breakout holds.
Sustained trading above $4,030 would confirm buyer control, invalidating the short-term correction phase.
📈 Trade Plan (Educational Setup)
Entry (Buy Stop): $4,030
Stop Loss (SL): $4,000
Take Profit Targets (TP):
TP1 → $4,060
TP2 → $4,090
TP3 → $4,120
TP4 → $4,150
TP5 → $4,180
TP6 → $4,210
💡 Analyst’s Commentary
This setup aims to capture the potential breakout continuation, with risk contained below the $4,000 psychological support.
Momentum confirmation on H1 and H4 closes will be key for trade validation.
Traders may consider partial profit-taking along the way and trailing stops to secure gains.
⚖️ Risk/Reward: ≈ 1 : 3.5
🕓 Timeframe: H1 – Short-Term Swing
⚠️ Disclaimer:
This analysis is shared for educational and research purposes only as part of Middle East Trading Academy’s ongoing market study.
It does not constitute financial advice or an investment recommendation.

gold next week still downtrend target $3950🧭 Current Market Context (XAUUSD around 4111):
Price is below EMA 9 and failed to break above 4200–4250.
The structure shows lower highs → bearish continuation still dominant.
Momentum is weak, and buying pressure hasn’t confirmed reversal yet.
📉 Primary Plan (Bearish Bias – More Likely)
Entry: Wait for a 4H close below 4070–4050. Enter short/sell once confirmed.
Targets:
TP1 = 3950
TP2 = 3600
TP3 = 3500
TP4 (long-term) = 3100
Stop Loss:
Above 4250 (or above last swing high).
✅ Reason:
Trend still bearish.
EMA and structure show resistance above price.
Strong downside targets available.
✅ Reason: That breakout would invalidate bearish structure and shift momentum up.
⚠️ Key Tips
Don’t trade inside 4050–4250 (range zone, no clear direction).
Follow 4H or Daily candle confirmations — avoid early entries.
Risk only 1–2% of account per trade.
If shorting, take partial profit near 3600 and trail stops.

xauusd 1h🔹 Overall Outlook and Potential Price Movements
In the charts above, we have outlined the overall outlook and possible price movement paths.
As shown, each analysis highlights a key support or resistance zone near the current market price. The market’s reaction to these zones — whether a breakout or rejection — will likely determine the next direction of the price toward the specified levels.
⚠️ Important Note:
The purpose of these trading perspectives is to identify key upcoming price levels and assess potential market reactions. The provided analyses are not trading signals in any way.
✅ Recommendation for Use:
To make effective use of these analyses, it is advised to manually draw the marked zones on your chart. Then, on the 5-minute time frame, monitor the candlestick behavior and look for valid entry triggers before making any trading decisions.

My ultimate target for a gold dip: $3700My ultimate target for a gold dip: $3700
As shown in Figure 4h:
My ultimate target for a gold dip: $3700
$3950: Primary Resistance (Aggressive Shorting Zone)
$4060: Secondary Resistance (Conservative Shorting Zone)
If my analysis doesn't indicate that you set a stop-loss on your short position, or if you don't understand my clear trading plan, I recommend reviewing my strategy and analysis from yesterday.
Today, gold prices fell to around $3900 as expected, and we made a substantial profit. Now we patiently await a rebound and a pullback, potentially testing resistance around $3950.
As long as gold prices remain around or below $3950, our strategy remains: continue shorting.
Note: If gold prices rebound and stabilize above $3950, caution is advised. Exit the market cautiously and wait and see. Meanwhile, gold prices will continue to test resistance in the $4000-4050 range.
The primary strategy for the coming week is to short at high levels.

POTENTIAL FOR THE GOLD MARKETXAU/USD 4H - As you can see I have marked out two potential outcomes for this pair on how I feel price could play out over the course of the next few days, both setups are valid and seem realistic.
Setup B is the most likely setup in my eyes and this is because I feel price is exhausted, the Demand in the market is running out, hence the big move to the downside. I feel price will have to come lower in order to pick up more Demand before the next bull run.
However price has traded down and into a Demand Zone and we are seeing large amounts of volume being introduced, and with the current state of the US economy the Gold Spot could still just be out-powering the Dollar.
Setup A would be following the prevailing trend and overall be a safer option as this market is bullish dominant but its important we wait for entry confirmation before we execute, looking for the break to the upside first followed by a pullback.

technical analysis of your provided XAU/USD (GoldTimeframe: 15 minutes
Current Price: $3,963.81
Trend Structure: Price recently broke out from a descending channel.
Key Levels:
Support Zone: $3,920 – $3,940
Immediate Resistance: $3,980
Target Zone: $4,142
📉 Technical Breakdown
Descending Channel Breakout
The chart shows gold had been moving in a clear downward channel.
The recent candles show attempts to break above the upper trendline, suggesting potential bullish momentum building up.
Support Level
A strong demand zone is visible around $3,920 – $3,940.
This zone has been marked as a possible retest area before continuation to the upside.
Price Projection
The chart projects a bullish scenario, where price may retrace slightly to support before targeting the $4,142.60 level.
This suggests a swing-buy setup, with confirmation depending on a strong bounce from the support level.
Market Structure
The formation of higher lows near the lower boundary of the channel signals momentum reversal.
A confirmed breakout with volume above $3,980 will lik TVC:GR10Y TVC:GR02Y EURONEXT:PSI1! EURONEXT:EV6X2025 EURONEXT:GE8Z2025 EURONEXT:PO6X2025 ely validate the bullish continuation.
🎯 Trading Plan Suggestion (Analytical View)
Buy Zone: $3,940 – $3,950 (after confirmation candle)
Take Profit Target: $4,142
Stop Loss: Below $3,915 (to protect against false breakout)
⚠️ Notes
Watch for price rejection near $3,980, as it could form temporary consolidation. EURONEXT:PO6X2025 EURONEXT:SNAX2025 EURONEXT:EV8Z2025 EURONEXT:PSI1! EURONEXT:XA8Z2025 EURONEXT:XA6X2025 EURONEXT:PO8Z2025
If price closes below $3,920, bearish momentum may resume.

GOLD THIS IS LOOKING LIKE BREAKOUT OF THE TRENDLINE ,IF ITS TRUE ,WE ARE HEADING TO 3981-3985 SELL ZONE BASED ON THE STRUCTURE OF THE MARKET.
GOLD TRADING STRATEGY.
US10Y =US10Y refers to the yield on the United States 10-Year Treasury Note, which is a key benchmark interest rate indicating the return investors receive for lending money to the US government over a 10-year period.
the US 10-Year Treasury yield is around 3.97% to 4.00%. This yield fluctuates based on factors such as inflation expectations, Federal Reserve monetary policy, economic growth outlook, and market demand for safe assets.
The US10Y yield is crucial because:
It serves as a benchmark for mortgage rates, corporate bonds, and other interest rates.
Moves in the US10Y reflect market sentiment about economic health and inflation.
It influences the US dollar strength, equity markets, and global capital flows.
It plays a role in central bank decisions, including the Federal Reserve’s rate policy.
In summary, US10Y is an essential financial indicator and market barometer reflecting long-term US government borrowing costs and overall economic confidence.
DXY ALSO KNOWN AS DOLLAR INDEX
The US Dollar Index (DXY or Dollar Index) is a measure of the value of the United States dollar relative to a basket of six major foreign currencies. It provides a broad gauge of the dollar's strength or weakness on the global stage.
The index is a weighted geometric mean of the dollar’s value compared to these currencies, weighted as follows:
Euro (EUR): 57.6%
Japanese Yen (JPY): 13.6%
British Pound (GBP): 11.9%
Canadian Dollar (CAD): 9.1%
Swedish Krona (SEK): 4.2%
Swiss Franc (CHF): 3.6%
A rise in the DXY means the US dollar is strengthening compared to these currencies; a fall means the dollar is weakening. The index was originally set to 100 in March 1973 after the collapse of the Bretton Woods system. It’s widely used by traders, economists, and policymakers to assess US dollar trends and global economic conditions.
In essence, the DXY reflects the overall demand for the dollar relative to other major currencies and serves as a benchmark for the dollar’s international value.
The Dollar Index (DXY) and the US 10-Year Treasury Yield (US10Y) are two of the most significant macro factors influencing the price of gold.
Impact of DXY on Gold
Gold is priced in US dollars globally, so the strength or weakness of the dollar (measured by DXY) directly impacts gold prices.
When the DXY rises (stronger US dollar), gold becomes more expensive in other currencies, usually reducing demand and pushing gold prices lower.
Conversely, a weaker dollar (lower DXY) makes gold cheaper for holders of other currencies, supporting higher gold prices.
Thus, gold and DXY often have a strong inverse relationship.
Impact of US10Y on Gold
The US10Y yield reflects long-term real interest rates and opportunity cost of holding non-yielding assets like gold.
Rising US10Y yields increase the opportunity cost of holding gold, pressuring gold prices downward.
Falling yields lower the opportunity cost, making gold more attractive as a store of value and driving prices up.
Additionally, US10Y yields are influenced by inflation expectations. Rising inflation often drives gold prices higher as a hedge, while rising real yields (nominal yield minus inflation) tend to pressure gold.
Combined Effects on Gold
A strengthening US dollar (higher DXY) combined with rising US10Y yields generally exerts downward pressure on gold prices.
Conversely, a weakening dollar and declining US10Y yields tend to boost gold prices.
For example, if economic uncertainty rises and real yields fall, gold typically benefits even if the dollar fluctuates.
please monitor DXY and US10Y alongside inflation and geopolitical risks to gauge gold price trends.
In summary, gold prices have an inverse correlation with the US dollar (DXY) and generally move opposite to the US 10-Year yield movements, driven by relative currency value and real yield opportunity cost dynamics.
technical sell zone
3981.22
technical sell zone on structure 4075.92
GOODLUCK
#GOLD #XAUUSD

How about a big profit short trade in gold?
Hello everyone
The gold correction is still ongoing and we should wait for a good and beautiful correction.
If you want to make good profits from the market, just follow my page.
Don't forget to support me, friend!!!

GOLD Under Pressure! SELL!
My dear subscribers,
My technical analysis for GOLD is below:
The price is coiling around a solid key level - 4023.4
Bias - Bearish
Technical Indicators: Pivot Points High anticipates a potential price reversal.
Super trend shows a clear sell, giving a perfect indicators' convergence.
Goal - 3987.3
My Stop Loss - 4041.7
About Used Indicators:
By the very nature of the supertrend indicator, it offers firm support and resistance levels for traders to enter and exit trades. Additionally, it also provides signals for setting stop losses
Disclosure: I am part of Trade Nation's Influencer program and receive a monthly fee for using their TradingView charts in my analysis.
———————————
WISH YOU ALL LUCK

Gold Trade Set Up Oct 27 2025Gold has broke structure to the downside once again on the 1h so i am expecting a continuation back down but first i want to see a sweep of EQH and tap into 1h FVG before looking for internal 5m structure to sell down to SSL

Gold prices could fall below $4,000 today.Gold prices could fall below $4,000 today.
Progress in US-China trade negotiations has eased tensions between the two major economies, weakening gold's safe-haven appeal.
Investors are awaiting the results of the Federal Reserve's latest monetary policy meeting (expected to be released around October 30th), which will determine the future direction of interest rates.
If the Fed sends a clear signal of a rate cut, gold prices are expected to resume their upward trend.
Key Technical Analysis: If gold prices fall below the $4,000 mark,
further downward adjustments are possible. In the short term, focus on support around $4,000.
Day Trading Strategy:
Resistance: 4060-4080
Support: 4000-4020
-----------------------------------
Short Sell Level: 4040-4050
Stop Loss: 4070
Target: 4000-3900-3800
The above is today's trading strategy.

Gold sellPrice is in a POI and intraday structure is bearish. Plus, at current price action there is a structural disruption.

Bearish Continuation Setup with Defined Risk/RewardKey Observations and Trading Setup
Price Action Context: The price recently made a high around $4,045 and appears to be consolidating or forming a lower high after a previous upward move.
Identified Setup: A bearish (sell) trade setup is clearly marked on the chart.
The Entry Price appears to be around $4,009.24 (the current price shown on the OHLC data).
The Stop Loss (the maximum acceptable loss level) is placed at $4,030.62, just above a recent swing high, indicating the point where the bearish bias would be invalidated.
The Target (Take Profit) is set at $3,980.22, indicating the desired level to exit the trade for a profit.
Visual Representation:
The red box highlights the area of risk (above the entry up to the stop loss).
The green box highlights the area of potential reward (below the entry down to the target).
The white arrow clearly illustrates the expected downward price movement.
