XAU/USD Update 2 Buying OpportunityNext move on the way. Focus on proper risk management & stay disciplined. Wishing you successful trades..!
Key Reason:
1. Unmitigated demand order flow along with proper BOS.
2. BISI still in pending.
3. If buyers remain strong. Then we'll see pump in gold price. High probability setup for buying.
Confirmation is most important part. Let's see how it will work.
Trade ideas

XAU/USD Update 1Next move on the way, focus on proper risk management & stay disciplined. Wishing you successful trades..!
Key Reason:
1. 1 hour supply area.
2. In smaller time frame we've IMB inside this supply area.
3. Confirmation is very important. Let's see how it will work.

XAUUSD UPDATE : Alert ! BEARISH PRESSURE still EXISTMonday open, price still under pressure below 4161 resistance.
It could be the early sign for 4160 - 4150 level as a strong resistance area, and price have a big possibility to make a downside continuation / more correction to a lower price below 4000.
Becareful for a retest action !
Have a great week ahead !

XAUUSD SELL IDEAPrice falls below the $4,000 level. It calls for possible short sell. I’m looking forward to selling XAUUSD from the current market price. Therefore a sell opportunity is envisaged.

Policy essence: "Eagle-wing rhetoric" concealing a loose coreThe trend significance of the interest rate cut decision: This interest rate cut is the second one in 2025, with a cumulative easing of 50 basis points, and the dovish forces in the voting results were significantly dominant - Milan's radical proposal to cut interest rates by 50 basis points was not passed, but the only opponent against the rate cut was Schmidt, with 10 votes in favor, highlighting the "loose consensus". This is a fundamental difference from the "consecutive rate hikes" tone in 2023. Historical data shows that the probability of initiating continuous easing within 3 months after the first rate cut is 83%, with the average gold price rising by more than 7%, and the current price has not reflected this trend.
The liquidity booster from the termination of the balance sheet: The Fed clearly stated that it would completely end the balance sheet reduction on December 1st. The easing strength of this action has been severely underestimated by the market. From historical experience, within 1 month after the termination of the balance sheet reduction in 2019, the gold price rose by 4.2%, while the bank reserves have dropped to the critical level of 2.93 trillion US dollars, and the termination of the balance sheet reduction will directly release over 300 billion US dollars of liquidity. This "interest rate cut + balance sheet expansion" combination is precisely the core driving force for the rise of gold, and the price of 3924 US dollars underestimates this pricing.
The misleading sentiment of Powell's statement: Powell emphasized that the interest rate cut in December is "not a certainty", which is actually a cautious statement in the absence of data - the US government shutdown led to the delayed release of data such as the September CPI, and the Fed needs to reserve flexibility for its policies. However, the non-farm payrolls added only 12,000 in October (far below the expected 113,000), and the core data of weak private sector employment has already laid the groundwork for the interest rate cut in December. Interest rate futures show that the probability of an interest rate cut in December is still 67%, and the speech did not completely reverse this.
Today's gold trading strategy
buy:3915-3925
tp:3940-3950
sl:3895

GOLD LONGThe bears pushed down the price of gold , I believe the bulls are getting ready now, I doubt gold will move up by this week surely anything is possible so I'll be keeping an eye on it...

XAUUSD LongThe M formation that was created is still yet to be completed. safe to say that price action has now favored the turn to complete the M pattern. wait for a solid on the resistance from the 3983.00 price level

Gold Intraday – Oct 30 (No.1)Scalping setup based on early London session volatility.
Expecting rejection near 2380 and possible short fade toward 2370 zone.
⚠️ Quick play — not advice, just sharing my intraday view.

#XAUUSD: Massive Drop Is In Making! Bears In ControlDear all,
We are seeing significantly increased bearish volume since yesterday now we think price is likely to remain bearish for couple of days or week so price could make major correction. Please wait for price to settle down.
Good Luck
Team Setupsfx_

Is gold about to experience a new rally?Is gold about to experience a new rally?
Currently, the gold market is experiencing significant volatility at high levels, and it's time to choose a direction, as shown in the chart.
After a series of sharp gains, there has been a significant technical pullback this week, but the core logic driving gold's long-term upward trend remains unchanged.
Policy expectations are in focus:
The market currently generally expects the Federal Reserve to cut interest rates by 25 basis points at next week's meeting.
This is the most important event currently hanging over the market, and any unexpected announcement could trigger significant market volatility.
Beware of volatility amplification: Due to unstable market sentiment and major events expected next week, gold price volatility has significantly increased.
Exchanges have also increased margin requirements for gold futures, which may force some leveraged traders to exit the market, further exacerbating market volatility.
As shown in Figure 4h:
Technical Analysis: Strong support exists in the $4,000-4,050 range. The pullback from the high has formed a bearish flag pattern, with significant resistance above.
Current Position: After plummeting from its all-time high of $4,379 to $4,010, gold is currently stabilizing above the key psychological level of $4,100.
Support and Resistance:
Key Support: $4,080, $4,030, and $4,000 are three key support levels.
If $4,000 falls below, the correction could intensify.
Key Resistance: Upside resistance lies near $4,170 and $4,220. A break above $4,220 could lead to a retest of $4,300.
Technical Pattern: Short-term consolidation.
The key trading strategy for Monday (October 28) is range-bound trading.
Key Trading Strategy:
Buy on dips: If gold can hold between $4,090 and $4,100 after Monday's opening, consider building a position in batches, with a short-term target of $4,150 to $4,170.
Short on rallies: If gold rebounds to resistance near $4170 or $4220 and shows signs of resistance, consider shorting with a small position, with a short-term target below $4100.
Risk Management Tips:
Stop-loss for long positions: It is recommended to set a stop-loss below $4080. If the price falls below $4080, be wary of the risk of a further decline to $4030.
Stop-loss for short positions: It is recommended to set a stop-loss above a key resistance level (such as $4220).
Important Tips:
Trade cautiously and maintain a small position: With the Federal Reserve's interest rate decision expected early next Thursday (October 31st), market uncertainty is extremely high.
It is recommended to reduce positions and avoid heavy holdings before mid-next week.
Avoid chasing highs and lows: In the current volatile market, chasing orders is extremely risky and can easily be wiped out by short-term fluctuations.
Always wait for the price to retreat to support or rebound to resistance before taking action.

XAUUSD: Market Analysis and Strategy for October 30Gold Technical Analysis:
Daily chart resistance: 4090, support: 3840.
4-hour chart resistance: 4050, support: 3890.
1-hour chart resistance: 4030, support: 3916.
Technical Analysis: Gold prices rebounded technically after falling nearly 5% over four consecutive trading days. The market faced short-term headwinds due to Powell downplaying the possibility of a December rate cut; however, widening divisions within the Federal Reserve regarding interest rate decisions have introduced new uncertainty to the market. Meanwhile, the trade easing agreement reached between the US and China has weakened safe-haven demand.
The daily chart shows a stepped decline, with four consecutive days of losses up to the previous trading day, and the moving average system has formed a death cross. After the European market opened today, prices rebounded rapidly. Short-term resistance levels to watch are 4010 and 4030. If gold can hold above 4010 and remain firmly above 4000, it will likely attract previous buying interest and resume its long-term upward trend. Conversely, if gold fails to recover and hold above 4000, selling on rallies is advisable.
Looking at the 1-hour chart, the moving averages have formed a golden cross, and the MACD/KDJ indicators are providing upward momentum. In the short term, focus on the continuation of the upward trend, paying particular attention to yesterday's rebound high of 4006 and the previous trading day's rebound high around 4030.
Trading Strategy:
SELL: 4050~4056 near
BUY: 3966~3960 near
More Analysis →

Gold on side Swings on Fed aftermathAs discussed throughout yesterday's session: 'My position: I am Buying Gold aggressively throughout yesterday's session all along especially when #3,952.80 benchmark got invalidated to the upside. Gap to the downside on Asian market opening delivered excellent chances to Buy more as I closed all orders with #4,000.80 Take Profit. Keep in mind that I might Sell #4,024.80 now (aggressive Scalp to the downside) only to Buy more. #4,052.80 benchmark and #4,100.80 extension are my Targets.'
If you followed Trading plan I announced above, you would be in excellent Intra-day Profits. I have Sold Gold from #4,027.80 High's multiple times and re-Bought Gold from #4,004.80 especially delivering excellent results and altered all my Trading activity (no need to gamble on Fed Rate decision aftermath). My Profit is excellent and will sit out today's session as it will be full of side-Swings where I will continue comfortable Trading throughout tomorrow's session.

GOLD | Bearish Bias Holds Below $3,944 Amid Trade OptimismGOLD – MARKET OVERVIEW | Trades Below $4,000 as Risk Appetite Rises
Gold continues to slide, as optimism over a potential U.S.–China trade deal and improving global outlook weakens demand for safe-haven assets.
The metal is now down nearly 10% from its all-time high of $4,377 (Oct 20), with the recent rally losing steam as traders take profits amid signs of progress in trade negotiations between the world’s two largest economies.
Technical Overview
Gold dropped nearly $150, exactly as projected in our previous outlook.
The price remains under bearish pressure while below 3,944, targeting 3,893, and a break below that could extend the decline toward 3,855 → 3,818.
However, a 1H close above 3,944 would indicate a potential reversal, opening the way for a retest of 3,970 → 4,011.
Key Technical Levels
Pivot Zone: 3,932 – 3,944
Support: 3,893 · 3,855 · 3,819
Resistance: 3,970 · 4,011 · 4,053
Outlook:
Gold stays bearish below 3,944, with downside potential toward 3,855 if trade optimism persists.
Only a confirmed 1H close above 3,944 would shift bias back to short-term bullish toward 4,011.

It’s Not Just a Chart, It’s a Mind Game — Stay Calm, GoldRiders.First of all — congratulations to everyone who followed yesterday’s setups!
We sold in the morning and made profits, then bought during the U.S. session — and won again.
Even though the technical analysis was pointing opposite to the news direction, price movement proved once more that the chart often leads before headlines.
Some followers were confused when I mentioned the news was positive for the dollar — which normally means gold should fall — yet buyers secured safe profits above 3938. That was a wise move reflecting good risk control.
Despite the positive Richmond Manufacturing Index and Consumer Confidence data (both supportive for USD), gold respected the technical levels more than fundamentals.
This is normal, as low to medium-impact data rarely outweigh technical setups, unlike major events such as interest rate decisions, which can override technical signals completely.
From the chart:
After dropping from 4019 early yesterday to 3886 around noon, gold reversed and started forming a higher high.
Currently, any dip below 3945 signals minor weakness, below 3928 indicates stronger bearish pressure,
and a confirmed breakdown happens only under 3898–3883.
On the upside, strong resistance persists between 3970–3983, tested since last evening.
A breakout above it could open the way to 4017–4020.
Important Warning:
Today is high-risk.
Expect volatility not only during the FOMC rate decision at 9:00 PM and Jerome Powell’s speech at 9:30 PM,
but possibly much earlier — the “volatility show” can start anytime.
So please trade cautiously.
If you’re new, still learning, or your emotions or account size can’t handle sharp swings —
sit out today and observe.
For learners, use a demo account as if it’s real — that’s one of the best lessons you’ll ever get.
Also note: Meta, Microsoft, and Alphabet (Google) will release earnings today — adding even more volatility.
Bullish Scenario (Buy)
Entry: Safe entry above 3983 (aggressive from 3967)
Targets: (3972–3976) – 3982 – 3994 – 4000 – (4007–4012) – 4021 – 4031 – 4046 – 4055 – 4064 – (4072–4077) – 4084 – 4097 – 4103 – 4117
Don’t feel safe with any buy before breaking 3983. The next key resistance is 4020.
Bearish Scenario (Sell)
Entry: Safe entry below 3928 (aggressive from 3938)
Targets: (3932–3930) – 3922 – 3913 – 3906 – 3901 – 3895 – 3887 – 3873 – (3860–3856) – 3842 – 3821 – 3813 – (3804–3800) – 3793
Notes:
1- This page doesn’t engage with sarcastic or disrespectful comments — if you don’t like the post, just scroll.
Professional discussions are always welcome.
2- If you found this analysis useful, share it — your support makes a real difference!
✍️ We appreciate it, if you drop a comment if you received the analysis clearly.
Disclaimer:
This analysis reflects my personal opinion and market observation only.
It is not investment advice or a buy/sell recommendation.
Trading in financial markets involves high risk, and all decisions remain the trader’s responsibility.
XAUUSD - Bears are taking over Gold remains under bearish pressure as it trades below key moving averages and fails to reclaim the 61.8% retracement zone. A confirmed 4H close below $3,920 would strengthen the case for a continuation toward the Fibonacci extension targets listed below.
🎯 Fibonacci Extension Targets (Bearish)
Using the latest swing high to swing low:
Target 1 (38.2%) → $3,832
Target 2 (61.8%) → $3,808
Target 3 (100%) → $3,776
Bias: Bearish continuation
Confluences:
Trend Structure: Price is forming lower highs and lower lows after rejecting from the previous swing high, confirming a bearish market structure.
EMA Ribbon / Dynamic Resistance: The price is trading below the EMA ribbon, which is now acting as a strong dynamic resistance zone.
Fibonacci Retracement: Price rejected from the 61.8% retracement level of the previous downswing — a key bearish retracement zone.
Momentum Indicators: Bearish momentum increasing as candles close below the midline of the ribbon with low buying pressure.
Volume/Confirmation: Decreasing bullish volume on retracement, followed by renewed selling pressure.


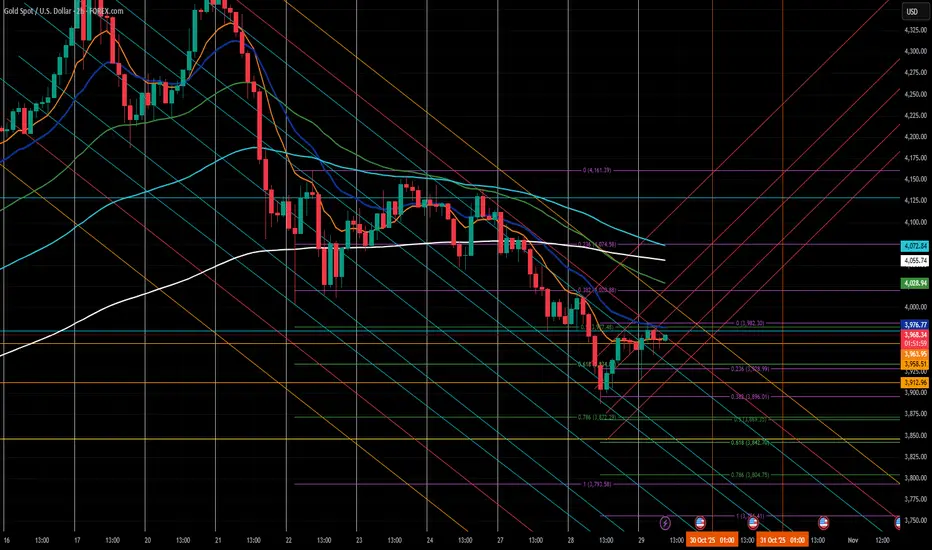
XAU/ USD Bullish trend analysis Read The captionSMC Trading point update
-
Technical analysis of XAU/USD (Gold Spot)
Timeframe: 1H (OANDA)
Technical Basis: Smart Money Concepts (SMC) + EMA Confluence
---
Market Structure
Current trend: Bearish, price respecting a descending wedge/channel.
Recent Break of Structure (BOS) confirms bearish momentum continuation.
Price is retracing after forming a new low and may move back to mitigate imbalance (FVG).
---
Key Technical Areas
Retracement Levels:
0.5 – 0.79 Fibonacci zone marks the premium shorting area.
Fair Value Gap (FVG) zone between 0.62–0.79 levels is the ideal entry region.
EMA Resistance:
EMA-50 ≈ 4,067
EMA-200 ≈ 4,120
Both EMAs align with the supply zone, strengthening sell bias.
---
Projected Move
1. Expected retracement toward the 4,067–4,100 zone (supply/FVG region).
2. Potential short entry within that area.
3. Bearish continuation targeting the next structural low at 3,960 (as marked).
---
Targets
Next Target (retracement zone): 4,089
Final Bearish Target: 3,960
Mr SMC Trading point
---
Summary
Gold remains under bearish pressure within a contracting structure. A retracement to the premium zone (4,067–4,100) offers potential short opportunities aligned with structure and EMA resistance. A break below 3,995 would further confirm bearish continuation toward 3,960.
---
Pelas support boost 🚀 this analysis

Gold price trading below 4000⭐️GOLDEN INFORMATION:
Gold (XAU/USD) steadies near $3,950 per ounce in Asian trading on Thursday, snapping a four-day losing streak. Prices find support from ongoing central bank buying and renewed ETF inflows, which have tightened supply in both official and market channels. However, gains remain capped after Fed Chair Jerome Powell signaled that another rate cut in December is uncertain, pushing 10-year Treasury yields above 4% and raising the opportunity cost of holding non-yielding bullion. The Fed had earlier delivered a widely expected 25-basis-point rate cut.
⭐️Personal comments NOVA:
Gold price is moving sideways, accumulating below 4000. Gold's long-term correction downtrend
⭐️SET UP GOLD PRICE:
🔥SELL GOLD zone: 4030 - 4032 SL 4037
TP1: $4020
TP2: $4010
TP3: $4000
🔥BUY GOLD zone: 3886 - 3884 SL 3879
TP1: $3900
TP2: $3910
TP3: $3925
⭐️Technical analysis:
Based on technical indicators EMA 34, EMA89 and support resistance areas to set up a reasonable sell order.
⭐️NOTE:
Note: Nova wishes traders to manage their capital well
- take the number of lots that match your capital
- Takeprofit equal to 4-6% of capital account
- Stoplose equal to 2-3% of capital account

Is the Yellow Metal Ready to BUST Out?Hold onto your hats, traders!
It's been a very wild ride in the FX_IDC:XAUUSD market, proving that what goes up (to a Double Top 🏔️🏔️) must come down (with a vengeance!). After a decisive rejection at the $4381 peak, Gold took a spectacular 8.64% dive last Tuesday, landing sharply at the $4002 low 📉. Talk about a waterfall! 🌊
But don't count the bulls out yet! Gold showed some backbone, bouncing 3.97% back up to $4161 before settling into a cage match. It's now consolidating in a classic Triangle pattern (a.k.a. Compression) 📐, ranging from the $4002 floor up to the stronger resistance near $4135.
The Great Consolidation: Triangle Tension 😮💨
The key takeaway? That $4000 psychological support is a BEAST. 💪 It survived test after test during the Asia, EU, and US sessions last Tuesday and Wednesday! This resilience allowed Gold to build support: first at the $4065 level (the Fib 0.382) and then down to the $4043 low, followed by rock-solid support near the $4000 zone.
As Friday closed out the week, Gold was still testing the lower $4100 area, pulling back to $4096. So, what’s next for the shiny metal?
That $33 candle Friday, was a direct reaction to the release of the slightly softer-than-expected US September Consumer Price Index (CPI) inflation data.
My Outlook: Patience is Gold, But the FED is Key 🔑
While some market watchers are singing a bearish tune 🐻, I see this as a healthy consolidation phase. Gold has already corrected 50% from its massive move (from $3631 low to the $4381 high). While a deeper correction to the 0.618 Fib at $3918 is possible, I don't see the catalyst right now to push it that far.
My bet? Gold will continue to consolidate in $4050 - $4150 range until the major announcement from the FED 🏦. The sharp reversal from the Double Top might just be the clean-out needed to launch prices higher once the rate cut announcement (or even just the dovish talk of future cuts) takes place! The last inflation data was a mixed bag, which gives the FED room to sound reassuringly dovish.
The FED Announcement is the main event this week. Mark your calendars! 🗓️
🔥 Key Economic Events: Central Bank Super Week! 🔥
This week is absolutely jammed with market-moving events across the globe. Get ready for volatility! 🌪️
Monday, October 27, 2025
8:30 AM ET: USD 🇺🇸 Durable Goods Orders (MoM) (Sep)
10:00 AM ET: USD 🇺🇸 New Home Sales (Sep)
Tuesday, October 28, 2025
10:00 AM ET: USD CB Consumer Confidence (Oct)
Wednesday, October 29, 2025 (The Fed Day) 🏦
All Day: HKD Holiday - Chung Yeung Day
9:45 AM ET: CAD BoC Interest Rate Decision
10:30 AM ET: USD Crude Oil Inventories
2:00 PM ET: USD Fed Interest Rate Decision
2:30 PM ET: USD FOMC Press Conference
10:00 PM ET (Approx.): JPY BoJ Interest Rate Decision
Thursday, October 30, 2025 (ECB and GDP Day)
2:00 AM ET: EUR German GDP (QoQ) (Q3)
4:00 AM ET: EUR German CPI (MoM) (Oct)
8:15 AM ET: EUR Deposit Facility Rate (Oct)
8:15 AM ET: EUR ECB Interest Rate Decision (Oct)
8:30 AM ET: USD GDP (QoQ) (Q3)
8:45 AM ET: EUR ECB Press Conference
9:30 PM ET: CNY Manufacturing PMI (Oct)
Friday, October 31, 2025 (Inflation and Month End)
6:00 AM ET: EUR CPI (YoY) (Oct)
8:30 AM ET: USD Core PCE Price Index (MoM) (Sep)
8:30 AM ET: USD Core PCE Price Index (YoY) (Sep)
9:45 AM ET: USD Chicago PMI (Oct)
-------------------------------------------------------------------------
This is just my personal market idea and not financial advice! 📢 Trading gold and other financial instruments carries risks – only invest what you can afford to lose. Always do your own analysis, use solid risk management, and trade responsibly.
Good luck and safe trading! 🚀📊

XAUUSD | Scalp Zones & Sentiment Check
Planning for volatility around news sentiment. Looking for a confirmed bounce in the BUY zone for a long, or a fast scalp on momentum. #XAUUSD #Volatility #Scalping

Gold Rebounds to Order Block — Downside Risk Remains🔍 Market Context
After forming a Change of Character (ChoCH) and a clear Break of Structure (BoS) to the downside, gold dropped sharply from 4,080–4,100 USD, confirming a shift from bullish to bearish structure.
Price is now making a technical rebound, forming Lower Highs toward the Order Block 4,012 USD — aligning with a small Fair Value Gap (FVG) , suggesting new selling pressure may emerge.
This rebound is seen as a “pullback retest supply” within a completed bearish setup.
If the 4,012 USD supply zone reacts strongly, price may extend its drop toward lower liquidity pools.
💎 Key Technical Structure
BoS (bearish): confirms a break below prior bullish structure.
Order Block (OB): 4,010–4,020 USD → main supply area confluencing with FVG.
FVG zone: 3,985–4,010 USD → technical retracement zone.
Supply Zone: 3,891–3,895 USD → temporary support, may be swept.
Liquidity Zone: 3,850–3,860 USD → key liquidity target.
📈 Trading Scenarios
1️⃣ SELL Setup – Retest OB 4,010–4,020 USD
Entry: 4,010 – 4,020
SL: 4,035
Take Profit: 3,985 - 3,965 - 3,945 - 3,915 - 3,890/Open
✅ Condition:
Wait for price to retest FVG–OB with clear bearish confirmation (strong rejection, bearish engulfing, or minor ChoCH on M15).
➡️ Trend-follow setup – sell after price retests supply zone.
2️⃣ BUY Setup – Reversal at Liquidity Zone 3,850 USD
Entry: 3,850 – 3,860
SL: 3,830
TP1: 3,870 - 3,885 - 3,900 - 3,920 - 3,940/Open
✅ Condition:
Wait for strong absorption or bullish reversal signal (long-tail rejection or bullish ChoCH on M15–H1).
➡️ Counter-trend scalp setup for reversal traders.
⚠️ Risk Management
Prioritise SELLs below 4,035 USD.
BUYs only valid with confirmation at Liquidity Zone.
Avoid mid-range trading (3,920–3,970) to reduce noise.
💬 Conclusion
Gold remains in a bearish trend after breaking prior bullish structure.
As long as price stays below 4,035 USD , downside momentum prevails.
Next major target: 3,891 – 3,851 USD .
👉 Strategic Plan:
Sell 4,010–4,020 | SL 4,035 | TP 3,985 → 3,890 🎯
Buy 3,850–3,860 | SL 3,830 | TP 3,870 → 3,940 🎯
💎 Price never lies — liquidity always reveals the truth.
⏰ Timeframe: 1H
📅 Updated: 29/10/2025
✍️ Analysis by: Captain Vincent

XAUUSD: The Bullish ABCD Pattern Signals Potential Price SurgeHey everyone, it's Erik!
The price has decreased within the bullish ABCD pattern, a pattern that often indicates that the sellers have exhausted their strength, with their momentum weakening near the bottom.
Recently, the price broke above the upper trendline, signaling that buyers are starting to intervene, shifting the market dynamics in their favor.
If the price stays above this recently broken level, we could see a significant rise. My target is for the price to reach around 4,130, a reasonable level based on the current setup.

