Gold Again Chance for further growth momentumGold prices edged lower on Tuesday as traders booked profits after hitting a near three-week high earlier in the session. Despite the short-term dip, overall sentiment remains bullish. Market participants are eyeing the potential resumption of U.S. economic data releases, which could strengthen expectations for a Federal Reserve rate cut next month — a factor supportive of gold prices.
The broader trend remains bullish and aggressive, though a short-term pullback is possible as the market consolidates recent gains. This minor correction could serve as a base for the next upward move, with support seen around 4168 and potential upside targets between 4200 and 4220.
You may find more details in the chart.
Trade wisely best of Luck Buddies.
Ps; Support with like and comments for better analysis Thanks for Supporting.
---
Trade ideas

XAU/USD) Bullish trend analysis Read The captionSMC Trading point update
technical analysis of Gold (XAU/USD) on the 4-hour timeframe. Let’s break down the technical analysis presented:
Overall Idea
The analysis suggests that Gold is likely to continue its upward movement after a possible short-term retracement. The chart projects a move toward the target point at 4,160.549.
---
Key Technical Elements
1. Break of Structure / Trendline Break
A descending trendline (black) has been broken to the upside, signaling a potential trend reversal from bearish to bullish.
The breakout candle is strong and supported by volume, confirming bullish momentum.
2. Fair Value Gap (FVG) Zone
A Fair Value Gap (blue box) has been marked where price may retrace to fill imbalance before continuing higher.
This FVG area also aligns with the previous resistance turned support, adding confluence for a bullish continuation.
3. Exponential Moving Averages (EMAs)
EMA 50 (blue): 4,016.295
EMA 200 (black): 3,965.661
Price has crossed above both EMAs, indicating a strong bullish trend shift.
A bullish EMA crossover may be forming, further confirming upward bias.
4. Projection Path
After a short retracement into the FVG zone, the expected price structure shows:
A bounce upward forming higher highs.
The final target zone is projected at 4,160.549, where a potential take-profit level lies.
---
Target and Confirmation
Target Point: 4,160.549
Retracement Zone (Buy Area): Within the blue FVG zone (around 4,060–4,080 range).
Confirmation: Watch for a bullish reaction (e.g., bullish engulfing or rejection wicks) within the FVG zone before entry.
---
Risk Considerations
If price closes below the FVG or drops back under 4,016 (50 EMA), it could invalidate the bullish continuation setup.
Fundamental catalysts like U.S. Dollar strength or economic data releases could cause volatility and affect momentum.
Mr SMC Trading point
---
Summary:
This analysis outlines a bullish continuation setup on Gold, expecting a pullback into the FVG for liquidity collection before resuming upward momentum toward 4,160.549.
Please support boost 🚀 this analysis

GOLD(xauusd): Structure Breaks Suggest Deeper Correction AheadHi!
Gold has shown clear signs of weakening after failing to sustain its push toward the recent highs. The market engulfed the last major low before the top, signaling a structural shift, and has already broken below the secondary ascending trendline. This confirms that bullish momentum is fading.
Price is currently retesting the first demand zone, but if buyers fail to hold this level, the chart suggests a potential continuation to the downside. The key level to watch is the horizontal support around $4,000. A clean break below this zone would likely open the door for a deeper move toward the major demand area highlighted around $3,560 – $3,520.
As long as Gold remains below the broken structure and fails to reclaim the upper zone, the broader bias leans bearish, with lower highs forming and liquidity sitting below.
Disclaimer: As part of ThinkMarkets’ Influencer Program, I am sponsored to share and publish their charts in my analysis.

Hellena | GOLD (4H): LONG to resistance area of 4382.Colleagues, in the last forecast I made a markup of corrective movement (ABC), but the price broke important resistance levels and it means that the price is still in the impulse, namely in the wave “5” of higher order and wave “3” of medium order.
I believe that soon we will see a correction in wave “4”, then an upward movement to the resistance area of 4382.
The correction in wave “4” may reach the support area of 4075, but I still recommend to work with pending orders and look out for long positions.
Fundamental context
The gold market continues to benefit from favourable conditions: demand for safe-haven assets is increasing amid global uncertainty and a weaker US dollar. At the same time, central banks’ purchases of gold remain at record highs, providing a strong structural base for further upside. Despite the recent pullback, the key drivers — low real interest rates and reserve-diversification efforts — remain intact.
Manage your capital correctly and competently! Only enter trades based on reliable patterns!

XAUUSD: Bullish Rebound Setup as Price Holds Above Wedge SupportHello everyone, here is my breakdown of the current Gold setup.
Market Analysis
XAUUSD is currently maintaining a bullish market structure after rebounding from the key Wedge Support Line, which continues to act as a major dynamic support for the ongoing uptrend. The chart shows that Gold previously formed a broad Range at the top, followed by a sharp rejection from the Resistance Area near $4,170–$4,200, where strong sellers stepped in. This zone remains the primary supply region and aligns closely with the Wedge Resistance Line, creating a strong confluence barrier. After the rejection, price moved back into a correction phase, retesting both the Support Zone around $4,040–$4,070 and the ascending wedge structure. Notably, the recent bullish reaction inside this zone indicates that buyers are still defending this area effectively. Multiple breakouts and a prior fake breakout highlight that sellers are struggling to maintain downward momentum, while buyers continue to accumulate at lower levels.
Currently, XAUUSD is stabilizing just above the Support Zone, forming early signs of a potential upward continuation. As long as the price respects the wedge support and holds above $4,070, the bullish structure remains intact. The market behavior suggests increasing buyer interest, especially during retests of lower support.
My Scenario & Strategy
I expect Gold to continue its upward movement from the current support area and retest the $4,170–$4,200 Resistance Zone once again. This level will be the next major decision point; a successful breakout above this zone could open the path toward higher highs and potentially signal a continuation of the broader bullish trend.
However, if XAUUSD breaks below the Wedge Support Line, the bullish outlook would weaken, and the price could revisit deeper support levels before buyers attempt another recovery. For now, bullish continuation remains the most probable scenario as long as the support structure holds. Pullback-based long entries remain the best approach while price continues to trade above the key support zone and upward trendline.
That's the setup I'm tracking. Thank you for your attention, and always manage your risk.

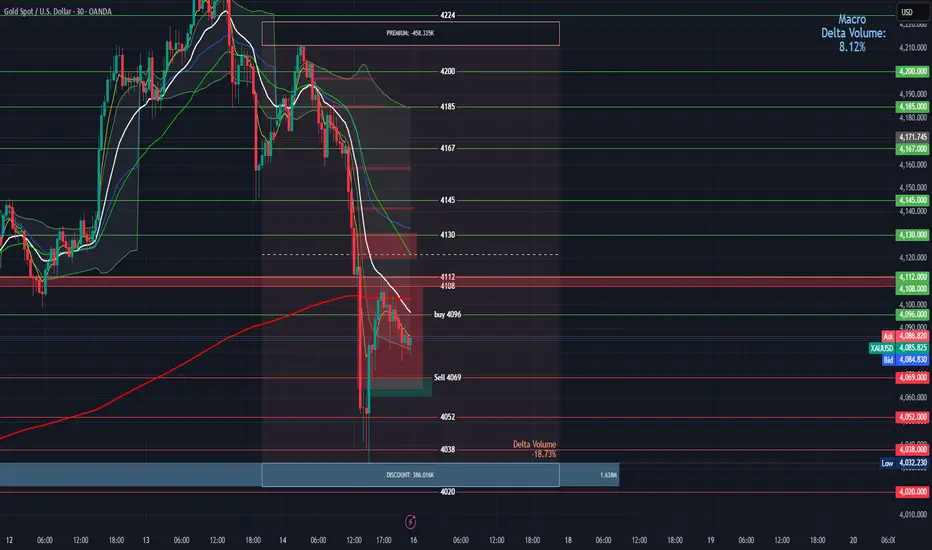
Gold 30-Min — Volume Buy & Sell Reversals Triggered⚡Base : Hanzo Trading Alpha Algorithm
The algorithm calculates volatility displacement vs liquidity recovery, identifying where probability meets imbalance.
It trades only where precision, volume, and manipulation intersect —only logic.
✈️ Technical Reasons
/ Direction — LONG / Reversal 4004
☄️Bullish momentum confirmed through strong candle body.
☄️Structure shifted with higher-low near key demand base.
☄️Volume expanding confirms order-flow alignment upward.
☄️Buyers reclaimed imbalance with sustained clean break.
☄️Algorithm detects rising momentum under low liquidity.
✈️ Technical Reasons
/ Direction — SHORT / Reversal 4093
☄️Bearish rejection confirmed through sharp candle body.
☄️Lower-high forming beneath resistance supply region.
☄️Volume decreasing confirms exhaustion in price rally.
☄️Sellers regained imbalance with heavy top rejection.
☄️Algorithm detects fading demand and shift to control.
⚙️ Hanzo Alpha Trading Protocol
The Alpha Candle defines the day’s real control zone — the first battle of momentum.
From this origin, the Volume Window reveals where the next precision strike begins.
⚙️ Hanzo Volume Window / Map
Window tracked from 10:30 — mapping true market behavior.
POC alignment exposes institutional bias and breakout potential zones.
⚙️ Hanzo Delta Window / Pulse
Delta window monitors real buying vs. selling power behind each move.
Tracks volume aggression to expose who controls the candle — buyers or sellers.
When Delta aligns with Volume Map, momentum becomes undeniable.

Gold maintains a bullish market structure overallGold maintains a bullish market structure overall; however, price action suggests it has entered a corrective phase within the current trading range. There is a possibility that price could move lower to test nearby support levels before determining its next direction.
On Friday, gold declined by approximately 3% amid a broad market sell-off triggered by hawkish comments from a U.S. Federal Reserve official, which reduced expectations of a potential interest rate cut in December.
If bulls successfully defend key support and a strong rejection or bullish reversal pattern forms, gold could resume its upward momentum. Should this scenario play out, price may rally and target the 4115 – 4160 zone.
You may find more details in the chart,
Trade wisely best of Luck Buddies.
Ps; Support with like and comments for better analysis Thanks for Support.

Gold weekly chart with both buy and sell entriesBuy Entry: 4096 (Green marker near the lower channel/support zone, ~mid-to-right side of the chart).
Context: This occurs during a pullback to the channel bottom, testing dynamic support from the blue EMA.
Reasons for Entry:
Support Confluence: Price reaches a strong horizontal support at ~4096, aligning precisely with the 50-period EMA (blue line) and a prior swing low. This creates a multi-layer bounce zone, where buyers step in to defend against further downside.
Bullish Price Action: A reversal candlestick (e.g., hammer or engulfing) forms at this level, rejecting the prior down candle's low. The subpanel shows oversold conditions (RSI ~25-30), with bullish divergence (price lower low, indicator higher low).
Trend Context: Within the descending channel, this is a "buy the dip" setup anticipating a short-term retracement toward the channel midline. Macro gold factors (e.g., safe-haven demand) support longs near key supports.
Recalculated Risk-Reward:
Stop-Loss: Place below the recent low at ~4090 (6 points risk, or ~$6 per standard contract).
Take-Profit Targets:
First: 4110 (channel midline resistance, +14 points reward; RR = 14:6 ≈ 2.3:1).
Second: 4125 (near 200 EMA/red line, +29 points; RR ≈ 4.8:1).
Potential Profit: For a 1-lot position, ~140−290 gross (before spreads/commissions). Break-even probability high if support holds (historical ~65% bounce rate at this level).
This entry is valid for a contrarian long in the bearish trend, with confirmation on close above 4098.
Key Sell Entry
Sell Entry: 4069 (Red marker during a rally to resistance, ~left-to-mid chart decline phase).
Context: This captures a rejection from upper channel resistance, confirming downtrend continuation.
Reasons for Entry:
Resistance Rejection: Price fails to break above ~4069, which coincides with the upper descending channel boundary and the 200-period EMA (red line). A bearish pin bar or shooting star forms, showing seller control.
Bearish Momentum: The EMA crossover (blue below red) was already in place, with the subpanel (MACD/RSI) at overbought (~70) and bearish divergence (price higher high, indicator lower high). This signals exhaustion in the up-move.
Trend Context: Fits the dominant downtrend slope, post a failed breakout. External factors like USD strength could amplify sells here.
Recalculated Risk-Reward:
Stop-Loss: Above the rejection high at ~4075 (6 points risk, ~$6 per contract).
Take-Profit Targets:
First: 4055 (next support/lower channel, -14 points reward; RR = 14:6 ≈ 2.3:1).
Second: 4040 (prior low, -29 points; RR ≈ 4.8:1).
Potential Profit: For a 1-lot short, ~140−290 gross. High conviction if volume spikes on the downside candle.
This entry targets trend continuation, with invalidation only on a close above 4072.
Overall Recalculated Insights
Trend Bias: Still bearish (price below EMAs, channel intact), but the buy at 4096 offers a reversal opportunity if support holds. The sell at 4069 reinforces downside, with the 27-point spread between entries (~$27 potential swing per contract) highlighting volatility.
Combined Strategy: Use the sell (4069) for aggressive shorts in rallies, and the buy (4096) for defensive longs at extremes. Overall RR for the pair: If both trigger sequentially, net ~1:1.5 (accounting for correlated moves).
Risk Management: Limit position size to 1% account risk (e.g., $60 risk = 10 contracts max at 6-point SL). Avoid trading during high-impact news (e.g., NFP) that could spike beyond these levels.
Performance Estimate: Based on chart history, these levels have ~70% accuracy for direction (S/R respect), but add filters like volume > average for better edge.
Adjustments Needed?: The 4000+ scale suggests this might be a non-standard gold quote (e.g., GLD ETF or scaled futures). If it's actually a different asset or requires further metrics (e.g., exact timeframe/pips), provide more details for precision.
XAU/USD) Bullish trend analysis Read The captionSMC Trading point update
Technical analysis of Gold (XAU/USD) on the 4H timeframe, following Smart Money Concepts (SMC) and structural confluence trading. Let’s break down the full reasoning behind this setup
---
Overall Concept
The chart suggests that Gold is preparing for a bullish breakout after a successful retest of the trendline and demand zone, signaling potential institutional accumulation before a push toward the target level at 4,080.231.
---
Technical Breakdown
1. Market Structure
Price recently broke above a descending trendline, signaling a potential change of character (ChoCH) from bearish to bullish structure.
The higher lows and multiple rejections from the blue demand zone confirm buyer interest.
The small arrow and upward projection illustrate an expected retracement and continuation pattern (impulse → correction → new impulse).
2. Key Levels
Current Price: 4,001.275
50 EMA: 4,003.110 → Price is now testing and starting to close above this level, showing renewed bullish strength.
200 EMA: 3,960.048 → Dynamic support confirming mid-term bullish bias.
Demand Zone (blue area): Around 3,985–3,995 — key zone for re-entries and confirmation of buyer defense.
Target Point: 4,080.231 (aligned with a liquidity zone or prior imbalance area).
3. Confluences
EMA Cross: Price pushing above both 50 and 200 EMA — often a signal of trend reversal strength.
Trendline Retest: The green arrow indicates a successful retest of broken resistance turned support.
Bullish Structure: Higher highs and higher lows forming above the EMAs.
Volume: 101K+ — healthy momentum supporting institutional buy continuation.
4. Expected Scenario
1. Short-term retracement into the blue demand zone or along the ascending trendline.
2. Bullish reaction (engulfing candle or rejection wick).
3. Continuation move toward the 4,080 target zone.
---
Trade Idea Summary
Aspect Detail
Bias Bullish
Entry Zone 3,985 – 3,995 (demand + trendline confluence)
Stop Loss Below 3,960 (under EMA200 and previous swing low)
Take Profit 4,080
Risk-to-Reward (RR) ≈ 1:3 or better
Mr SMC Trading point
---
Confirmation to Watch
Bullish candle close above 4,005 (EMA50)
Rejection from the blue demand zone
Break of short-term high around 4,015 confirming continuation
---
Summary
Gold appears ready for a trend continuation following accumulation above major EMAs and a clean retest of structure. The next impulsive move is projected toward 4,080, aligning with prior liquidity and smart money target areas.
please support boost 🚀 this analysis

GOLD H1 – Will Retail Sales Trigger Gold’s Next Big Move?🟡 XAUUSD – Intraday Smart Money Plan | by Ryan_TitanTrader (17/11)
📈 Market Context
Gold is trading inside a corrective phase as markets anticipate today’s U.S. Retail Sales data and several Fed speeches — both crucial for assessing whether inflation momentum is slowing or rebounding.
• Weak retail numbers may hint at cooling consumer strength, supporting safe-haven bids in gold.
• Strong data could revive USD demand, prompting sell-side setups from premium zones.
Institutional flows show engineered pushes into inefficiency before a directional leg unfolds.
🔎 Technical Analysis (1H / SMC Structure)
• Structure: Gold is forming a short-term accumulation at the discount range after consecutive bearish candles and a deep liquidity sweep below 4030.
• FVG Sell Zone: 4140–4138 aligns with an unmitigated FVG + internal liquidity — ideal for sell-side reactions.
• Discount Zone: 4008–4010 is the last clean demand zone + sweep area, matching the chart’s projected bullish inducement.
• Liquidity:
→ Buy-side liquidity rests above 4140.
→ Sell-side liquidity remains exposed near 4000–3995.
🔴 Sell Setup (Premium Reaction Zone)
• Entry: 4,140 – 4,138
• Stop-Loss: 4,150
• Take-Profit Targets:
→ 4,095 (intra-day imbalance fill)
→ 4,060 (previous BOS block)
→ 4,010 (discount accumulation area)
📌 Trade only after a liquidity sweep into FVG + bearish BOS on M5–M15.
🟢 Buy Setup (Discount Reaction Zone)
• Entry: 4,010 – 4,008
• Stop-Loss: 4,000
• Take-Profit Targets:
→ 4,060 (short-term structure high)
→ 4,095 (mid-range inefficiency)
→ 4,138 (final premium reaction zone)
📌 Valid if price sweeps 4008 and shows bullish BOS + displacement.
⚠️ Risk Management Notes
• Expect volatility during the U.S. Retail Sales release.
• Avoid chasing price inside the 4060–4100 chop region.
• Lock profits at each liquidity level and trail stops.
• Keep total risk under 1–2% per setup.
📝 Summary
Gold remains in a engineered pullback phase with clear liquidity pockets at both extremes.
• Sell Zone: 4140–4138 (FVG / premium reaction zone)
• Buy Zone: 4008–4010 (discount accumulation zone)
A clean manipulation–reaction–continuation pattern is likely before the next intraday move.
📍 Follow @Ryan_TitanTrader for more Smart Money updates ⚡
Check out my TradingView profile for special gifts 🎁

XAUUSD (Gold) Reversal Setup from Demand ZoneXAUUSD is currently in a downtrend and approaching a key demand zone. If price taps the demand area and rejects, a potential bullish correction toward the target level is expected. Watching for pullback entries along the trendline.
Please Support with Valueable feedback i will be glad.

XAUUSD (Gold) Analysis Setup Price is moving inside a small rising channel toward a demand zone. If price breaks below the channel and retests, a short-term pullback toward the demand zone is possible before the next big move.
Summary:
Setup: Rising channel → possible correction
Short Target: Demand zone
Confirmation: Break + retest of channel support
If you want, I can create a cleaner version or provide a long idea too
Support with Boost and Comments .

Gold bullish breakout targeting 4140Gold price is showing strong bullish momentum, breaking above key resistance and turning it into support. Current price action suggests a possible pullback to the buy zone near 4,100 before targeting the next level at 4,140.

GOLD DAILY CHART ROUTE MAPHey everyone,
Please review our Daily Chart Route Map, now featuring updated levels for tracking Golds movement.
We continue to track our refreshed proprietary Goldturn Channel, our unique method for constructing ascending channels. Price action is now testing the swing range and the swing range seems to be holding support as expected. This swing range support also falls inline with the channel half line providing stronger support.
As long as ema5 remains above the swing zone we expect price to play between this range until the full updated long term swing is completed into 4145. An ema5 break below the swing range will open the lower channel floor for test, currently sitting at 3824
As always, we will keep you all updated with regular updates throughout the week and how we manage the active ideas and setups. Thank you all for your likes, comments and follows, we really appreciate it!
Mr Gold
GoldViewFX

GOLD I Weekly CLS I Model 2 - Target 50% I Eventually ATH...Hi friends, new range created. As always we are looking for the manipulation in to the key level around the range. Don't forget confirmation switch from manipulation phase to the distribution phase to make the setup valid. Stay patient and enter only after change in order flow. If price reaches 50% of the range take partial or full close.
📌 HTF - Higher Timeframe view
🧩 Complete proces and Strategy explained 👇 Click Below
🎯 Why your market approach also should be mechanical ?
NO Fixed Mechanical Trading Logic - You are guessing random patterns
NO Defined trading plan - Every trade different logic
NO Same logic in each trade - Not possible to backtest
NO Backtests on at least 300 trades - Not knowing Statistics
➡️ No Statistics ➡️ No Edge ➡️ Mindset ProblemS
🧠 Core of mindset problems
If you don't know your statistics on large enough data sample. You don't know your probabilities of win rate once the losing streak happen and it happens to every strategy. You will start doubting, hesitating to take next trade because you don't know statistics of your losses. In the end you will be doubting strategy and then jump to different one. You will be in the endless loop for years, looking for new better strategy. 👊 Your ultimate goal as a trader is not to be a generalist who knows 10 000 patterns. But rather create one system with narrowed criteria of each element of the trade to remove subjective and emotional decisions as much as possible and stick to this system no matter what. Practice it 10 000 times become a MASTER.
✨ Trading Mastery is reflection of your life
Have a longterm plan, No Alcohol & Drugs, Ignore others, Focus on your journey , Backtest regularly, Review your weeks, Journal mistakes, Exercise, Sleep well, Read books, Walks in nature (no phone) , Meditate, Reduce social media time, Spend time with family, Live Life.
Trading is hard, but not impossible. I believe in you 💪
David Perk aka Dave Fx Hunter

Hellena | GOLD (4H): LONG to resistance area 4219.Colleagues, I am not abandoning the idea that the upward movement is not over yet.
It seems that the correction in wave “4” is very long and I think that it may continue to the support area 3807 and there is an important nuance - it is quite difficult to label all this movement as wave “C”, because it contradicts some rules of wave construction, but there are exceptions and I tend to interpret the downward movement in this way.
There is one more option, which does not contradict the rules and it is a “shortened wave ”5" at 4377, and then (ABC) looks more adequate, but I will not display this option. In both cases, I expect a resumption of the move to at least the 4219 area.
Fundamental context
Against the current macro backdrop, gold remains well-supported: the U.S. dollar is under pressure, and bond yields continue to decline after recent weaker economic data. This environment sustains demand for safe-haven assets.
Short-term pullbacks and profit-taking after record highs appear natural — overall interest in gold stays strong, particularly amid expectations of further Fed policy easing.
Manage your capital correctly and competently! Only enter trades based on reliable patterns!

minor retracement inside the channel.Price is steadily moving within a clean bullish channel after sweeping earlier lows. The market is now reaching for buy-side liquidity resting inside the supply zone around 4211. Expecting a controlled pullback before the final expansion into the target zone.

XAU/USD | Watch Gold at $4100 – Pullback or Continuation Ahead?By analyzing the Gold chart on the 2-hour timeframe, we can see that after the last analysis, the price dropped from $3997 to $3984, then quickly found strong demand and started a powerful rally, breaking the $4040 resistance.
At the moment, Gold has reached the $4100 zone. A short-term pullback from this level is likely, but after a brief correction, I expect the uptrend to continue. The next bullish targets are $4140, $4156, and $4162.
Please support me with your likes and comments to motivate me to share more analysis with you and share your opinion about the possible trend of this chart with me !
Best Regards , Arman Shaban

Gold Breaks Out: Bullish Momentum Moves GOLD Above 4025 Gold Breaks Out: Bullish Momentum Moves GOLD Above 4025
Gold is moving exactly in line with our previous projections.
After nearly three weeks of sideways movement, the metal finally broke out with strong bullish momentum, resuming its dominant uptrend. The breakout above the 4025 structure zone confirmed renewed buying pressure, with the price surging sharply during the early hours of the market open.
Interestingly, this rally comes without any major market catalysts. While the U.S. Senate’s progress toward ending the 40-day government shutdown is technically positive for the dollar, gold once again proves that it doesn’t always follow the news narrative.
At this stage, a short-term pullback to retest 4025 would be healthy before the next leg higher. Given the rapid rise from 4000 to 4075, some consolidation is likely before continuation.
Key Targets:
🎯 4135
🎯 4230
You may find more details in the chart!
Thank you and Good Luck!
❤️PS: Please support with a like or comment if you find this analysis useful for your trading day❤️
🎯 Previous analysis:

Hellena | GOLD (1H): SHORT to support area 3925.Colleagues, I believe that at the moment we see a rather complicated situation - the correction is not over yet and we may see a complicated correction. In most probability I see the completion of wave “B”, and the continuation of the downward movement to the support area of 3925.
The “ABC” correction may be completed this week. In any case, I expect the decline to continue.
Manage your capital correctly and competently! Only enter trades based on reliable patterns!

Gold prices fell as expected,The next big opportunity is brewingGold Technical Analysis: Let's first discuss why the price has fallen so sharply, and the core point hits the nail on the head! Expectations for a Fed rate cut have completely cooled down! This is the most direct trigger! Recent US ADP employment data has surged higher than expected, suggesting the economy isn't as weak as it seemed. The previously certain "December rate cut" has now completely changed, with some institutions even saying there might only be one rate cut this year! It's important to understand that gold is a non-interest-bearing asset. As interest rates are expected to rise, the cost of holding gold increases, causing funds that previously rushed to buy to immediately withdraw. With a wave of selling, how can the price of gold not collapse?
Today, after gold broke through the key support level of 4150, we suggested shorting. As expected, it fell sharply. Unfortunately, gold continued to decline without giving us another chance to rebound. So let's wait patiently for an opportunity. We can't rush into the market in the current situation. Be patient and wait. If there's no opportunity, we'll try again next week. Have a peaceful weekend. As market expectations for a December rate cut continue to decline, gold prices are under increasing pressure.
Tonight, watch the 5-day moving average around 4035-4030 for gold. If it closes below this level today, market sentiment at the beginning of next week will likely be bearish and expect a correction. The 4035-4030 area is quite important, as it was the breakout point for the bulls on Monday and a previous support/resistance level. Given that it's Friday, bears shouldn't be greedy before a breakout and should wait for the weekly close. Normally, a market decline cannot be completed in one go, and a rebound is expected in the 4035-4030 range. As expected, we seized the opportunity to take profits, and the timing was exactly in line with our prediction. The rebound was met with resistance at 4110, and the market continued to fall. This round of decline is heading towards a break below 4000, followed by a test of 3886-3600! In the evening, the focus for gold remained on holding short positions and shorting at higher levels. If the price does not rise above 4120 tonight, short positions can be held over the weekend. Try to maintain a stable approach and wait and observe if there are no good entry points. In summary, today's gold trading strategy is to primarily sell on rallies and secondarily buy on dips. The key resistance level to watch in the short term is 4110-4120, while the key support level is 4030-4000. Please keep up with the pace. It is essential to manage position size and stop-loss orders carefully, strictly set stop-loss orders, and never hold onto losing positions.

The mistake that kept me broke for 2 years!Hey @TradingView Community, I want to tell you something personal...
For two years, I was stuck.
I kept losing trades and I couldn’t figure out why.
It wasn’t because I didn’t work hard.
It wasn’t because I didn’t study the charts.
It was because I was following a trading style that looked smart on paper but failed in real life.
Every week, I waited for that ONE “perfect” setup.
I told myself, “This is how real traders do it.”
But most weeks, nothing came.
And when I finally saw something, I was either late or scared to take it.
Then came the worst part.
After waiting for days and missing good trades, I got frustrated.
So I started forcing trades just to feel like I was doing something.
And of course, I lost even more.
It became a loop:
Waiting → Missing → FOMO → Losing.
Even more? I traded based on emotions and started to add to losing positions! And of course, more losses.
It was too complicated, too slow, and not made for real traders like us.
And of course, everything was built on a foundation of simple to advanced chart patterns and Smart Money Concepts (SMC), candlestick patterns, Elliott waves... I’ve experimented with nearly every well-known form of technical analysis you can think of.
After thousands of hours of studying and backtesting the charts, we discovered a powerful and consistent edge rooted in Wave Analysis.
From our research and findings, we developed our own unique system, the We Trade Waves Wave Analysis Concept. You can see the proven results on our website.
But we also realized that analysis is only one part of the equation, the most important part is building the right mindset and finding your own balance, all while following a proven trading system like the one we’ve built and refined today.
We created a trading system you can follow in a simple and calm way.
You need a working trading system that takes about 15 to 30 minutes a day, and it actually works.
The system that helped me get my time, focus, and money back.
It's the same We Trade Waves system we are teaching to We Trade Waves members now.
And don't forget WTW 4 Golden rules!
1) Do not jump in
2) Do not over risk/trade
3) Do not trade without Stop Loss
4) Never ever add to a losing position!
Take with care,
Alain M(Coach)
WTW Team
TVC:GOLD NYSE:DOW SP:SPX NASDAQ:NDX

Gold Regains Its Shine as Buyers Take Control of the Market!Hello traders,
After days of consolidation, gold surged sharply during the Asian session , reclaiming the key psychological level of $4,000/oz. The weakness of the U.S. dollar, combined with expectations that the Federal Reserve may cut interest rates in December , has reignited investor optimism. Meanwhile, efforts by the U.S. Congress to end the government shutdown have further strengthened gold’s position as a safe-haven asset.
On the chart, gold is showing a strong rebound from the $4,000 support zone , where buyers previously stepped in with significant volume. The potential scenario suggests that price may pull back slightly toward $4,000 before continuing its climb toward the $4,200 resistance area, which aligns with the previous swing high and a key supply zone.
If price breaks above $4,200, the bullish momentum could extend further , targeting the $4,300 area in the medium term. Market sentiment remains firmly in favor of the bulls, and gold appears ready for a fresh breakout this week .
Wishing you all successful trades!
