XAU/USD Gold support breakdown strong bearish trend📉 GOLD (XAU/USD) Sell Setup Alert 💰✨
🔹 Current Trend: Bearish momentum continues on the 1H timeframe
🔹 Support Breakdown Possible: from $3935 zone
🎯 Technical Targets:
1️⃣ TP1: $3894
2️⃣ TP2: $3826
⚠️ Watch for confirmation candles & volume before entry
📊 Always follow your risk management plan — protect your capital!
💬 What’s your view on this setup?
👇 Drop your thoughts in the comments!
📈 Like | 🔁 Share | 💬 Comment | 🔔 Follow for more live trade updates & insights!
#XAUUSD #GoldAnalysis #ForexTrading #PriceAction #SellSetup #RiskManagement #TraderMindset
Trade ideas

GOLD XAUUSD CHARTLONDON finally played into my 15 min structure 3885-3880 and its moving in 3935 first take profit and 3945-3940 target 2.the correction ic not up 50% retracement yet ,so it could continue to drop.
the fomc rate outlook caution is playing on long position.
the last chart posted was detailed into new buy position on 15 min chart after my first layer of buy floor at 3945-3940 failed.
the second layer was 100% accurate and its the hand of GOD.
NOTE =TRADING THE FOREX IS 100% PROBABILITY
NO STRATEGY IS HOLY GRIL.
RISK MANAGEMENT IS KEY.
GOODLUCK
#GOLD #XAUUSD

Gold Rebounds Strong – Next Stop 4230!Gold (XAUUSD) showed a sharp decline in last two days, marking a strong correction phase after making new highs. However, today’s price action indicates that buyers are stepping back in around the 4000 psychological Major support Area.
Currently, gold is trading near 4113, and now there are high possibilities that gold will go for long till the Target level 4160 and Target level 4230..
KEY POINTS
Current price 4113
Target level 4160
Target level 4230
Major support 4130/4100

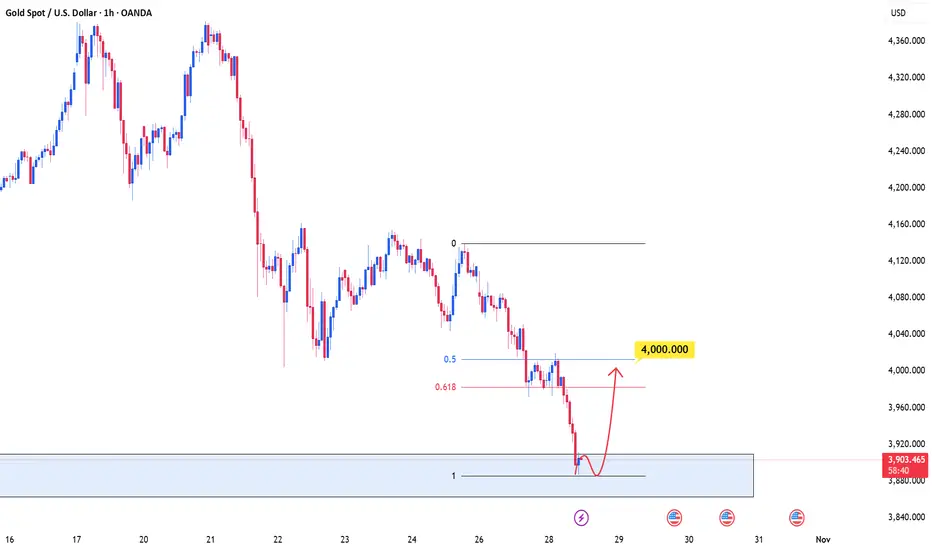
GOLD will return to the Fibonacci level after a sharp declineOANDA:XAUUSD The price recently experienced a sharp sell-off and, after being strongly rejected at a key resistance level, is now entering a stabilization phase. We’re currently in a consolidation phase, where the selling pressure is gradually subsiding.
If buyers can hold this level and push the price higher, the next target will be the Fibonacci retracement zone of 0.5–0.618, ranging between 4,000 and 4,020. This is a critical area, as it could mark the point where sellers may re-enter the market, creating further fluctuations.
Wishing you all successful trades and substantial profits!
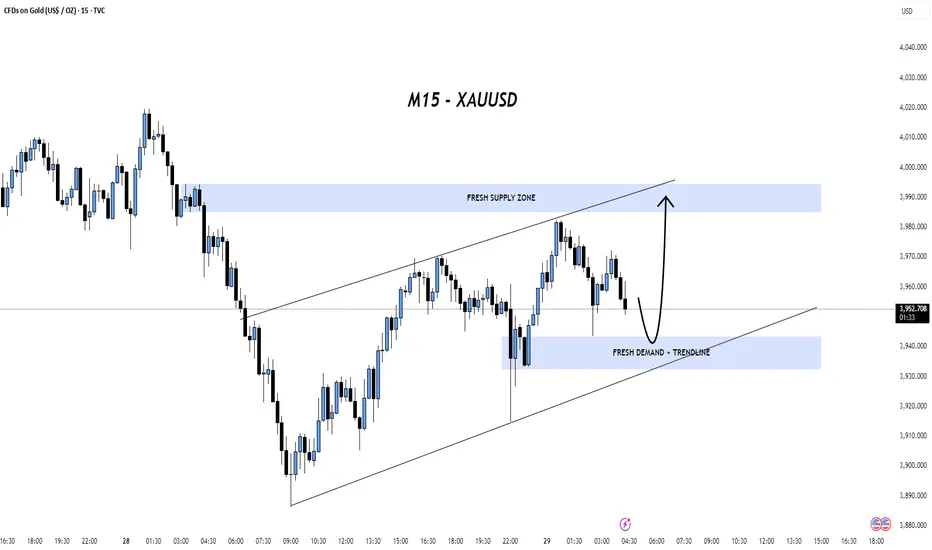
GOLD TimeFrame - M15Reason i choose focus : BUY/SELL
🟢FRESH DEMAND + TL ZONE 🟢
🟢WAITING REJECTION = BUY 🟢
🟢NEXT PRICE MAKE HH M15 🟢
Gold Consolidates Weakly Around $3925 – Sellers Still in Control📊 1. Market Overview
Gold prices rebounded slightly from the $3900 level, reaching $3931 before losing momentum. The market is now moving sideways around $3925 in a weak consolidation phase. The U.S. dollar remains firm as Treasury yields stay elevated, while traders await the upcoming PCE inflation data, limiting gold’s recovery potential.
🔍 2. Technical Analysis
• Main Trend: Bearish, with weak corrective rebounds.
• Immediate Resistance: $3930 – $3935
• Higher Resistance: $3948 – $3960
• Near-term Support: $3900 – $3890
• EMA50 & EMA200 (H1): EMA50 remains below EMA200, confirming the ongoing bearish bias.
• Candlestick Pattern: Small lower-tail candles around 3925 indicate mild buying but no clear reversal signal.
• RSI (H1): 45 – neutral, suggesting potential range-bound movement before breaking above 3930 or below 3900.
💡 3. Outlook
Gold is currently in a short-term accumulation phase after a steep drop, but the broader trend remains bearish. A rejection from the $3930–$3935 resistance zone could trigger another decline toward $3900 or even $3880. Conversely, a decisive breakout above $3935 with strong volume may extend the rebound toward $3960.
🎯 4. Trading Strategy
🔻 SELL XAU/USD: $3928 – $3932
🎯 TP: 40 / 80 / 200 pips
🛑 SL: $3938

XAUUSD | Gold to drop 2000PIPS, where is the best sell zone?🔍 Market Context
After breaking the medium-term uptrend structure at the main Trendline , gold has formed a clear sequence of Lower High – Equal Low (EqL) , indicating a phase shift from bullish to bearish.
Currently, the price is fluctuating around the 3,960–3,970 USD zone – this is a temporary liquidity accumulation area before heading up to retest the resistance at 4,015–4,050 USD , which was previously a Demand Zone now turned into a Supply Zone .
If a strong bearish reaction occurs here, it is highly likely that the price will extend its decline towards the Order Block 3,945–3,960 USD zone, or even deeper to the Premium Zone 3,884 USD .
💎 Key Technical Structure
Main Trendline: broken, confirming a structure change (ChoCH).
Resistance Zone: 4,010–4,015 → quick reaction resistance.
Supply Zone: 4,043–4,060 → strong technical pullback zone.
Premium Zone: 3,884–3,900 → discount zone, potential temporary bottom.
📈 Trading Scenarios
1️⃣ SELL Zone 1 – Scalp Reaction at Resistance Zone
Entry: 4,010 – 4,015
SL: 4,025
Take Profit : 4,005 - 3,995 - 3,975 - 3,965 - Open
➡️ Quick scalp reaction at nearby resistance – suitable for London/NY session trading.
2️⃣ SELL Zone 2 – Major Retest at Supply Zone
Entry: 4,043 – 4,060
SL: 4,065
Take Profit : 4,050 - 4,040 - 4,030 - 4,020 - 4,010/Open
➡️ Main setup – retest of supply zone confluencing with broken trendline, high probability if strong rejection on H1/H4.
3️⃣ SELL Continuation – Break & Retest below 3,945 USD
Entry: 3,945 – 3,950
SL: 3,965
TP: 3,884
➡️ Setup breaks EqL bottom confirming downtrend continuation, targeting Premium Zone.
4️⃣ BUY Setup – Reversal at Premium Zone 3,900 USD
Entry: 3,900
SL: 3,880
TP1: 3,910 - 3,920 - 3,930 - 3,940 - 3,950/Open
✅ Condition:
Only buy when a strong reaction candle appears (long-tail rejection / ChoCH bullish on M15–H1).
➡️ This is the final discount zone before major capital can return to the market – technical reversal setup, low risk / high reward.
⚠️ Risk Management
Prioritize SELL at supply zones, BUY at Premium – avoid trading mid-range.
Reduce volume in scalp setup (Sell 1).
If price closes above 4,070 → short-term downtrend is invalidated.
💬 Conclusion
Gold remains under short-term bearish pressure, however, the 3,884–3,900 USD zone could act as strong support.
The suitable strategy is to capitalize on the two resistance zones for Selling and observe technical Buying at the Premium bottom.
👉 Comprehensive Strategy:
Sell 4,010–4,015 | SL 4,025 | TP 4,005 → 3,965 🎯
Sell 4,043–4,060 | SL 4,065 | TP 4,050 → 4,010 🎯
Buy 3,900 | SL 3,880 | TP 3,910 → 3,950 🎯
🔥 “Trade with patience, react at precision zones — that’s how consistency is built.”
⏰ Timeframe: 1H
📅 Update: 28/10/2025
✍️ Analysis by: Captain Vincent

GOLD $4091 | a Short Position basic rule is when one sees a parabolic move
it's time to sell on the way up instead of aping in
difficult to contain fomo however
just have to pull t he trigger after a week of confirmation or red candle
the bounce should be opportunity to size up
and STOPS ha s to be higher
as you can get wicked ouot

XAUUSD - Buy to sell move :)I am currently anticipating a buy to sell move on Gold. Overall, Gold is in solid bullish momentum and over the last week and a half, price has been in a correctional phase. Based on the 4H time frame price has respected and rejected my demand zone, and I see price pushing to 4035 which is a 61.8% FIB level before rejecting that level and pulling back to 3886 and continuing in bullish momentum. 🚀
Whats your outlook? 🥶

Gold Intraday Trading Plan 10/29/2025Gold dropped as expected yesterday from 4000 all the way to 3887. It slowly recovered and closed the day at 3952. I am looking to sell from 3973-3984, targeting 3850 today.

Bullish bounce off 50% Fibonacci support?The Gold (XAU/USD) is falling towards the pivot, which aligns with the 50% Fibonacci retracement and could bounce from this level to the swing high resistance.
Pivot: 3,847.44
1st Support: 3,701.62
1st Resistance: 4,357.81
Disclaimer:
The above opinions given constitute general market commentary, and do not constitute the opinion or advice of IC Markets or any form of personal or investment advice.
Any opinions, news, research, analyses, prices, other information, or links to third-party sites contained on this website are provided on an "as-is" basis, are intended only to be informative, is not an advice nor a recommendation, nor research, or a record of our trading prices, or an offer of, or solicitation for a transaction in any financial instrument and thus should not be treated as such. The information provided does not involve any specific investment objectives, financial situation and needs of any specific person who may receive it. Please be aware, that past performance is not a reliable indicator of future performance and/or results. Past Performance or Forward-looking scenarios based upon the reasonable beliefs of the third-party provider are not a guarantee of future performance. Actual results may differ materially from those anticipated in forward-looking or past performance statements. IC Markets makes no representation or warranty and assumes no liability as to the accuracy or completeness of the information provided, nor any loss arising from any investment based on a recommendation, forecast or any information supplied by any third-party.

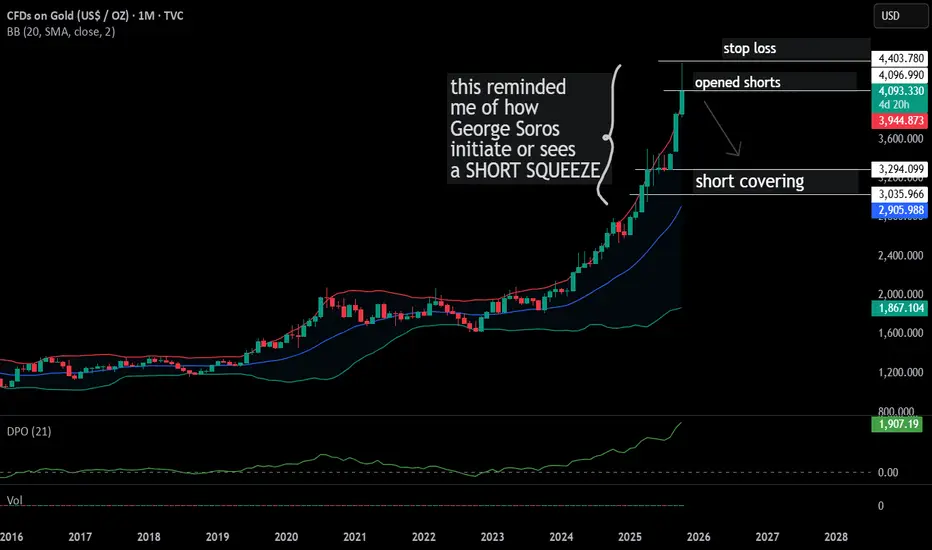
my crush told me about gold After people all over the world lined up in front of gold shops, you can already assume that within the next three months, the market will inevitably collapse. However, I don’t believe the current decline marks the true end. Investors haven’t completely lost hope in the market yet. And as long as there’s hope, there’s still buying demand.
A sharp one-way crash from here would be too easy for short-term speculators, short traders, and the so-called “Smart Money” — the top 1% who have driven gold prices up since the beginning of the year with enormous capital. They won’t sell their positions at prices that are too low or too quickly.
That’s why I think there’s a high chance of one more rebound, possibly pushing prices to the level where people start believing gold will reach $5,000 per ounce. Of course, the market never moves the way the majority expects.
Therefore, I see the $4,600–$4,8XX zone as an ideal area to take profits or open short positions. Nothing can rise parabolically forever — greed always has an end, and eventually, it turns into fear. When that happens, the market collapses.
NFA — I’m just writing this so I can sleep.

Latest Gold Trend Analysis and Trading Strategy :
I. Fundamental and News Analysis
This week is a "super week" for the gold market, with multiple risk events overlapping, expected to trigger significant market volatility:
Political and Economic Events:
The 2025 APEC Leaders' Informal Meeting is being held, and U.S. President Trump has begun his Asia tour, drawing attention to geopolitical dynamics.
The fifth round of Sino-U.S. trade consultations has made progress, with the U.S. explicitly stating it will "no longer consider" imposing 100% tariffs on China. The easing of trade tensions has weakened gold's safe-haven demand.
Central Bank and Data Focus:
The Federal Reserve, Bank of Japan, European Central Bank, and other central banks will announce interest rate decisions, with the market closely monitoring signals on monetary policy.
The U.S. will release the September Core PCE Price Index (a key inflation indicator for the Fed) and the Q3 GDP data, which will directly impact interest rate expectations.
II. In-Depth Technical Analysis
Overall Trend Positioning:
Gold is currently in a wide-range consolidation phase and has not yet formed a unilateral trend.
Last Friday's CPI data, which was bullish, failed to push gold prices higher, indicating weak bullish momentum. The adjustment period may extend until the Fed's interest rate decision (early Thursday morning).
Key Levels and Patterns:
Resistance Zone: 4020–4050 (short-term)
If the rebound breaks above 4050 and fills the 4100 gap, the short-term trend will need to be reassessed.
Support Zone: 3950–3920 (key defensive area for declines)
If the 4000 level is effectively broken, a decline toward the 3800 target may begin (based on the previous upward triangle pattern calculation).
Pattern Signals:
The 1-hour chart shows a triangle convergence consolidation, with a slightly bearish structure.
A double top formed at 4380 last week, indicating short-term bearish dominance.
III. Core Trading Strategy
Primary Approach: Focus on selling on rallies, with buying on dips as a secondary strategy. Strict risk control is essential.
Key Resistance: 4020–4050
Key Support: 3950–3920
Specific Action Plan:
Short Strategy (Primary):
Entry: Sell in batches in the 4020–4050 zone (position ≤ 30%)
Stop Loss: 4060
Target: 3980–3950, with a break below targeting 3920
Long Strategy (Secondary):
Entry: Lightly test buying in the 3950–3920 zone (position ≤ 20%)
Stop Loss: 3900
Target: 3980–4000
IV. Risks and Contingency Tips
Data Risks:
Ahead of the Fed's interest rate decision on Thursday, the market may remain volatile. Be cautious of sudden news triggering breakouts.
If Core PCE and GDP data exceed expectations, the current technical pattern may be broken.
Trading Discipline:
Total position size should be controlled within 50%, with a single stop loss not exceeding 3% of capital.
If the price breaks above 4050 and holds, pause short positions and observe the performance at the 4100 resistance level.
If the 3920 support is broken, abandon long positions and look toward the 3880–3850 zone.
Note: The current market is event-driven and volatile. Technical signals need to be flexibly adjusted based on real-time news. It is recommended to closely monitor the effects of U.S. Treasury yields and the U.S. Dollar Index during the European and U.S. trading sessions.

XAU/USD - Structural Reset and Reversion to Major Sell FrameworkThe recent bullish attempt has officially failed to establish structure, revealing that the brief upward move was merely a corrective exhaustion from the previous selling leg. Despite the short-term relief, momentum quickly reverted, and a new sell-side framework has now formed - one that’s far more aligned with broader structural behavior.
This new formation mirrors the previous major sell triangle, but with a more refined and realistic target zone, highlighted by the purple box. Price remains positioned near the upper boundary of the red structure, suggesting that selling pressure is once again dominant.
Unless buyers can produce a confirmed break above the current structural pivot, the path of least resistance remains to the downside, with measured targets pointing toward the completion zone inside the new sell continuation area.
In short - the market has reset its rhythm. The unstructured pump has faded, and the primary bearish structure is back in control.

XAUUSD Gold Price is currently trading around 3,933, showing a downward correction after a strong bullish rally. The market has reached a key support zone near 3,920 – 3,900, where a potential rebound could occur. A bullish breakout from the minor descending trendline could trigger an upward move toward the first target zone at 4,050 – 4,100. If momentum continues, the next major target lies around 4,200.
However, if price breaks below the current support, further downside may extend toward the next support zone near 3,850 – 3,800.
Overall, price action suggests a critical decision point, with potential for a trend reversal if support holds.
"Thank you for your support! If you found this idea valuable or learned something new, please consider liking and leaving a comment. I’d really appreciate hearing your feedback and thoughts."

“Gold Rebounds from Demand Zone — Short-Term Recovery Ahead”Analysis:
Gold (XAU/USD) on the 4-hour chart shows a strong corrective decline after forming an SMC trap near the 4,250–4,300 zone, where liquidity was swept before a sharp selloff. Price has now reached the High Probability POI (Point of Interest) around the 3,850–3,880 region, showing early signs of a bullish reaction.
The recent candle structure indicates buyers are stepping in from this demand zone, confirming a potential short-term reversal. If momentum sustains, the first target zone lies around 3,950–3,980, aligning with minor resistance and previous imbalance fill.
Outlook:
📈 Bias: Bullish correction (short-term)
🧭 Key Support: 3,850 – 3,880
🎯 Target: 3,950 – 3,980
⚠️ Invalidation: Break below 3,840 may reopen bearish continuation toward 3,780

XAUUSDGold looks bullish off the H4 tf, but will need to see some highs cleared. It’s moving nicely already.

XAU/USD Bullish trend analysis Read The captionSMC Trading point update
Technical analysis of XAU/USD – Bullish Continuation Setup (1H Chart)
Technical Overview:
Instrument: Gold Spot (XAU/USD)
Timeframe: 1 Hour
Current Price: $4,114
Next Target: $4,220
---
Chart Breakdown:
1. Demand Zone (Blue Box):
The price has respected a key bullish order block / demand zone between $4,040 – $4,080, showing strong buyer reaction (green arrows).
2. Ascending Trendline Support:
Multiple rejections from the ascending trendline confirm higher lows, signaling ongoing accumulation from buyers.
3. Fibonacci Retracement:
The market retraced around the 0.618 – 0.786 Fibonacci levels — a strong buy zone for continuation setups.
4. Moving Averages (EMA 50 & EMA 200):
EMA 50 (Blue) is trying to cross above the EMA 200 (Black), hinting at a possible bullish crossover.
A successful break above both EMAs would confirm bullish momentum.
5. Bullish Flag / Wedge Pattern:
The structure shows a bullish flag/wedge forming after an impulsive upward move — indicating potential for another breakout rally.
---
Trade Idea:
Buy Zone: $4,070 – $4,100
Target 1: $4,160
Target 2: $4,220 (main target on chart)
Invalidation (Stop Loss): Below $4,030
Mr SMC Trading point
---
Market Bias:
Bullish Bias – As long as the price holds above the highlighted demand zone and the ascending trendline, buyers remain in control. A breakout above recent highs will confirm momentum toward the next target.
---
Pelas support boost 🚀 this analysis

GOLD recovers ahead of US CPI data, key data dayArticle summary:
“Gold rebounded in the Asian session on October 24, trading around $4,139/ounce, as safe-haven flows surged amid renewed geopolitical tensions and investors awaited September US CPI data, which could determine the Federal Reserve’s monetary policy moves in the short term.
The recovery momentum was reinforced by expectations of an early Fed rate cut, along with the impact of Washington’s new oil sanctions on Russia and escalating US-China trade tensions. Meanwhile, technically, gold held support around $4,100, suggesting the medium-term uptrend remains intact.”
OANDA:XAUUSD maintained its recovery momentum in the Asian session on October 24, trading around $4,139/ounce, after rising sharply in the Thursday session thanks to the return of safe-haven flows amid fresh geopolitical developments. The move came as global markets await key US inflation data (September CPI), which is seen as key to shaping the direction of the Federal Reserve's monetary policy in the short term.
Economic data
The US Bureau of Labor Statistics (BLS) will release its September Consumer Price Index (CPI) tonight.
Forecasts show the US core CPI rising 0.3% month-on-month and remaining at 3.1% year-on-year, suggesting persistent inflationary pressures despite signs of cooling energy prices.
The market has all but priced in a 25 basis point rate cut by the Fed at its policy meeting next week. In a low-interest-rate environment, gold, a non-yielding asset, tends to benefit from lower opportunity costs.
“Gold’s goal is to continue its rally ahead of the CPI data,” says Valeria Bednarik of FXStreet.
Political and Geopolitical Events
Gold prices rebounded after the US imposed new sanctions on two major Russian energy companies, Lukoil and Rosneft. This is the first sanctions of President Donald Trump's second term and is seen as a significant escalation in the pressure campaign against Moscow.
According to Jorge Leon, Director of Geopolitical Analysis at Rystad Energy, "This move marks a major and unprecedented escalation in Washington's campaign against Russia."
The sanctions could impact global oil supplies, indirectly increasing the appeal of gold as a hedge against risks in an uncertain environment.
In addition, US-China tensions have also resurfaced as the White House considers restricting China’s use of US software, retaliating against Beijing’s rare earth export controls and raising port fees for US-flagged ships. These signals reinforce the “selective risk-off” sentiment in global markets.
In short, the current developments suggest that gold is repositioning itself in a medium-term bull cycle, as the market simultaneously assesses geopolitical risks and the prospect of Fed easing.
If CPI data reinforces the case for a Fed rate cut at the upcoming meeting, gold could retain its appeal as a key safe-haven asset in the fourth quarter.
Technical Outlook Analysis OANDA:XAUUSD
Technical analysis:
Gold prices are maintaining a technical recovery after a strong correction from the peak of 4,379 USD/ounce. Currently, the price is trading around 4,118 USD, approaching the Fibonacci support zone of 0.618 (4,110 USD), an important milestone to determine the short-term supply-demand balance.
On the daily chart, gold is still in the medium-term uptrend channel formed since mid-August, with the MA21 average line (4,000 USD area) continuing to act as a dynamic support base. RSI has reached the 50 area and is showing signs of forming a slight bottom, reflecting the weakening selling momentum.
In terms of patterns, the candlestick cluster of the last 2 days shows a "hammer - recovery confirmation" pattern, suggesting that demand is reappearing at the technical bottom.
Trend Assessment:
If the $4,100 zone holds, there is a high probability that gold will enter a bullish consolidation phase towards the $4,200 mark. However, a break of the $4,000 zone would open up a deeper correction towards the $3,950 area.
In the context of lower interest rate expectations and geopolitical tensions that have not yet subsided, the medium-term trend of gold remains bullish, although the current recovery is more technical than a fundamental breakout.
SELL XAUUSD PRICE 4221 - 4219⚡️
↠↠ Stop Loss 4225
→Take Profit 1 4213
↨
→Take Profit 2 4207
BUY XAUUSD PRICE 4057 - 4059⚡️
↠↠ Stop Loss 4053
→Take Profit 1 4065
↨
→Take Profit 2 4071

XAUUSD Analysis todayHello traders, this is a complete multiple timeframe analysis of this pair. We see could find significant trading opportunities as per analysis upon price action confirmation we may take this trade. Smash the like button if you find value in this analysis and drop a comment if you have any questions or let me know which pair to cover in my next analysis.

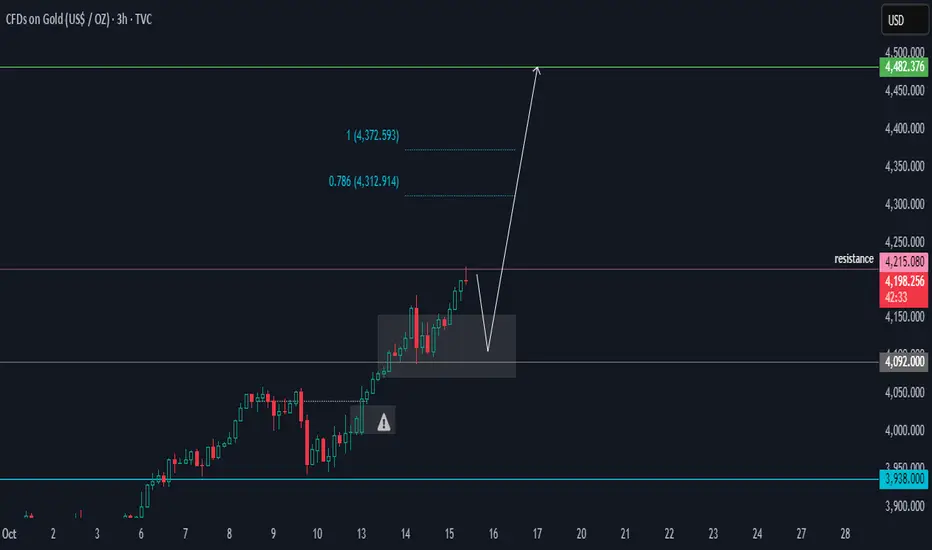
Gold Slowing but Aiming Higher.Hi
The price at 4215.080 is showing hesitation and acting as resistance. Gold may drop before rising again, with a target price of 4482.376. There are two price targets to watch. If the price falls deeper, it could reach 4039.060.
Happy Trading!
K.
_
Not trading advice