XAU/USD Bullish trend analysis Read The captionSMC Trading point update
Technical analysis of XAU/USD – Bullish Continuation Setup (1H Chart)
Technical Overview:
Instrument: Gold Spot (XAU/USD)
Timeframe: 1 Hour
Current Price: $4,114
Next Target: $4,220
---
Chart Breakdown:
1. Demand Zone (Blue Box):
The price has respected a key bullish order block / demand zone between $4,040 – $4,080, showing strong buyer reaction (green arrows).
2. Ascending Trendline Support:
Multiple rejections from the ascending trendline confirm higher lows, signaling ongoing accumulation from buyers.
3. Fibonacci Retracement:
The market retraced around the 0.618 – 0.786 Fibonacci levels — a strong buy zone for continuation setups.
4. Moving Averages (EMA 50 & EMA 200):
EMA 50 (Blue) is trying to cross above the EMA 200 (Black), hinting at a possible bullish crossover.
A successful break above both EMAs would confirm bullish momentum.
5. Bullish Flag / Wedge Pattern:
The structure shows a bullish flag/wedge forming after an impulsive upward move — indicating potential for another breakout rally.
---
Trade Idea:
Buy Zone: $4,070 – $4,100
Target 1: $4,160
Target 2: $4,220 (main target on chart)
Invalidation (Stop Loss): Below $4,030
Mr SMC Trading point
---
Market Bias:
Bullish Bias – As long as the price holds above the highlighted demand zone and the ascending trendline, buyers remain in control. A breakout above recent highs will confirm momentum toward the next target.
---
Pelas support boost 🚀 this analysis
Trade ideas

XAUUSD Analysis todayHello traders, this is a complete multiple timeframe analysis of this pair. We see could find significant trading opportunities as per analysis upon price action confirmation we may take this trade. Smash the like button if you find value in this analysis and drop a comment if you have any questions or let me know which pair to cover in my next analysis.

XAUUSD - Will Gold Continue to Fall?!Gold is trading below the EMA200 and EMA50 on the 30-minute timeframe and is trading in its descending channel. The reduction in its downward momentum in the demand range will provide us with a better risk-reward buying position. A move towards the supply range above the channel will be our next short trade!
Gold prices fell below $4,000 per ounce for the first time since October 10, following a sharp $125 decline.
According to a Reuters survey, the average gold price in 2026 is expected to reach $4,275 per ounce, while silver prices are projected to average $50 per ounce in the same year.
For 2025, the survey anticipates an average gold price of $3,400, up from $3,220 in the previous poll, while the average silver price is forecasted to rise to $38.45 from $34.52 previously.
Analysts at Nomura stated that U.S.–China relations have entered a repetitive cycle of tension, escalation, and temporary détente, likely forming a “new normal” in the long term.
Lu Ting, Nomura’s chief China economist, noted that the world’s two largest economies appear to be settling into a predictable pattern of “strain–escalation–pause”, which may define the framework of their relationship in the foreseeable future.
Recent trade talks in Kuala Lumpur hinted at a temporary easing of friction, with both sides reportedly considering limited concessions, such as extending tariff suspensions and resuming soybean imports from the U.S.
However, deep-seated disputes remain unresolved — including export restrictions on rare earth elements, compliance with trade commitments, and broader geopolitical disagreements — all of which cloud the outlook for bilateral relations.
Lu cautioned that while short-term cooperation may continue due to mutual economic dependence, long-term strategic competition between Washington and Beijing is expected to intensify.
Nomura believes this recurrent cycle of conflict and reconciliation will likely become the enduring pattern of U.S.–China relations.
Such a backdrop implies persistent volatility in global markets, particularly in commodities and technology sectors, which are highly sensitive to trade developments between the two nations.
Investors should prepare for alternating periods of optimism and renewed tension.
Meanwhile, Donald Trump’s proposed tariffs against Canada may turn into a major self-inflicted setback, as the move faces both a legal challenge before the U.S. Supreme Court and bipartisan opposition.
Next week, the Supreme Court is set to hear a case focusing on Trump’s use of the International Emergency Economic Powers Act (IEEPA) to justify these tariffs. Trump initially invoked an emergency declaration related to fentanyl to impose them — despite the fact that such powers are typically reserved for sanctions against U.S. adversaries.
The case represents not only a test of the tariffs’ legality, but also a measure of Trump’s and MAGA’s influence over the Court.
Notably, Senator Lisa Murkowski, a Republican, joined over 200 Democrats in sending a letter to the justices urging them to strike down the tariffs.
The oral arguments are scheduled for November 5, and the final ruling, which could serve as a major market mover, is expected sometime next year.
Currently, prediction markets estimate a 38% probability that the tariffs will be overturned.
At the same time, Morgan Stanley reported that U.S. dollar positioning has turned positive for the first time in several months, reflecting renewed investor confidence in the U.S. economic outlook.
This shift comes amid rising political instability in Japan and France, which has diminished the appeal of non-dollar assets and strengthened capital flows toward the greenback.
Strategists at the bank added that demand for downside protection against the dollar has declined, indicating that investors perceive a low risk of a sharp correction in the near term.
Nevertheless, Morgan Stanley warned that this uptrend might not be sustainable — if U.S. economic data, particularly employment figures, fail to show significant improvement, the dollar could again face renewed downward pressure, and rate-cut expectations from the Federal Reserve could rise.
Finally, Treasury Secretary Scott Bassent confirmed that five candidates have been shortlisted to succeed Jerome Powell as Federal Reserve Chair:
Christopher Waller, Michelle Bowman, Kevin Warsh, Kevin Hassett, and Rick Rieder.
Bassent stated that one more round of interviews will take place, and he plans to submit the final shortlist to President Trump after Thanksgiving, with a final decision expected before year-end.

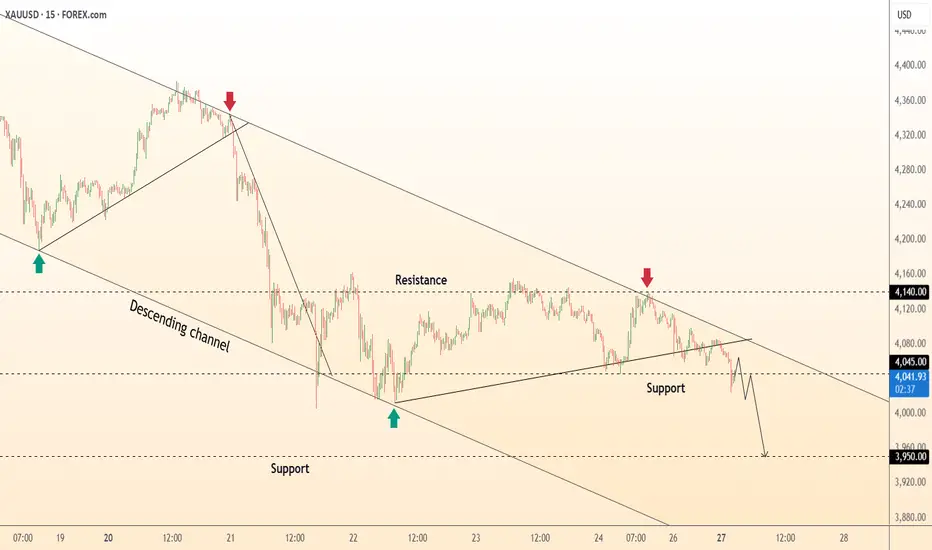
DeGRAM | GOLD is declining in the channel📊 Technical Analysis
● XAU/USD remains confined within a descending channel, forming consistent lower highs and lows, reinforcing bearish control.
● Price recently rejected the 4,140 resistance and is targeting the 3,950 support zone, confirming short-term continuation within the channel structure.
💡 Fundamental Analysis
● Gold faces pressure from a stronger USD and rising Treasury yields, as traders scale back expectations of early Fed rate cuts.
✨ Summary
● Short bias below 4,140; targets 4,000–3,950. Technical rejection and macro strength in USD sustain bearish momentum.
-------------------
Share your opinion in the comments and support the idea with a like. Thanks for your support!
Gold price analysis October 28📉 GOLD UPDATE – Correction Phase Continues
Gold remains under bearish pressure as buyers failed to hold the price above 4057, confirming that sellers are back in control. The market structure now supports a continued corrective move toward the 3955 support zone during the European session. A further breakdown below this level could open the way to 3892, which serves as the next key downside target.
For now, the focus should remain on SELL setups during the London session. Any BUY positions would be considered counter-trend and only valid if price shows strong rejection signals at key supports or reclaims the 4057 zone.
🎯 Trading Plan
SELL trigger: Price rejection at resistance zone 4050
SELL DCA: On break below 3955
Target: 3890

XAUUSD 1H – EW Long SetupHi fellow traders,
On the 1H XAUUSD chart, I am applying Elliott Wave principles to outline a potential long setup. Price seems to have completed wave 4 and is reacting from the golden box area, suggesting that wave 5 may now start unfolding to the upside.
The invalidation level at 4004.72 represents my expected end of the correction, although the setup remains valid even if price moves slightly lower. My Stop Loss is set at 3940.00, which would confirm structural failure if reached. The Take Profit is positioned at 4437.36, targeting the projected completion of wave 5.
Good luck and trade safe!

GOLD outcome.XAUUSD has been falling and now at a SUPPORT zone. Waiting for confirmation if it will rise in the London session or keep falling.

LiamTrading - XAUUSD: SCENARIO BEFORE FOMC LiamTrading - XAUUSD: SCENARIO BEFORE FOMC - $3840 Level Awaits Bottom Fishing Reaction Wave
Hello traders community,
The Gold market is showing a strong and sustainable downtrend. We are witnessing a crash after prices broke through key support zones. With the upcoming FOMC event, our strategy is to seek Buy opportunities at deep liquidity zones and continue Selling when prices recover to retest the broken trend.
📰 MACRO ANALYSIS & CASH FLOW CONTEXT
Gold is currently under dual pressure:
Downward Pressure 🔴: Optimism about the US-China trade progress has significantly weakened the demand for Gold, a safe-haven commodity. Spot Gold prices have fallen below $3950, hitting a three-week low, down about 0.78% on the day (28/10).
Short-term Support 🟢: Bets on the possibility of a Fed rate cut continue to weaken the US Dollar (USD), which is the only factor that could potentially support this precious metal.
Conclusion: This tug-of-war makes it difficult to determine the bottom. The bearish scenario remains the top priority.
📊 TECHNICAL ANALYSIS: THE DOWNWAVE CONTINUES
Based on the H4 chart (image_5fa7fa.png):
Current Trend: The price has successfully broken through the key liquidity support zone near $3950 and is continuing its downtrend.
Current Fibonacci Level: The price is touching and reacting at the 1.618 Fibonacci zone (around $3950).
Next Level: The next level Gold is targeting will be the 2.618 Fibonacci zone (around $3840), which is a large liquidity area expected to see a strong reaction.
Main Strategy: We focus on two scenarios: Bottom fishing reaction at 3840 and continuing to Sell when the price recovers.
🎯 DETAILED TRADING PLAN (ACTION PLAN)
We have two detailed scenarios based on the current price level:
🟢 BUY Reversal Scenario
We wait for the price to hit the deep liquidity bottom zone of 3840 to execute a buy order with the expectation of a technical recovery.
Entry Zone: 3840
Stop Loss (SL): 3832 (tight SL)
Take Profit Targets (TP): TP1: $3872 | TP2: $3898 | TP3: $3925 | TP4: $3950
🔴 SELL Retest Scenario
If Gold recovers without breaking the downtrend structure:
Entry Zone: Watch for a Sell retest at $4091
Stop Loss (SL): $4099
Take Profit Targets (TP): TP1: $4065 | TP2: $4033 | TP3: $4004 | TP4: $3965
SUMMARY & DISCIPLINE (Steven's Note)
Gold is in a strong fall ahead of the FOMC, with significant volatility expected. Capturing deep Fibonacci and Liquidity zones is key.
Note: Always adhere to the set Stop Loss. Capital management is the number one priority, risking only 1-2% of the account per trade.
Wishing traders a successful and disciplined new trading week!

20251028-XAUUSD IdeaThe major timeframe continues to exhibit a decline–consolidation–decline structure, confirming that it has officially entered a corrective phase.
Next, observe where Wave A completes and whether there is any market reaction around the 3791 level.

Gold Price Analysis - Gold Breakout Levels 4200 vs 4040Gold is trading inside a tightening rising channel after forming a strong higher timeframe rejection from the ATH which pushed price into a corrective phase. Buyers have repeatedly defended the strong support zone near 4000-3980 creating a false breakout low followed by a controlled recovery showing that demand remains active.
However, each rally into the weak-high resistance at 4160-4200 has shown fading momentum meaning sellers are still protecting this zone aggressively. Until price breaks out with a clean close and retest above this resistance gold will remain in a neutral to slightly bullish consolidation phase driven by stop hunts and choppy movements inside the channel.
A successful breakout above 4200 can trigger a bullish continuation toward 4240 then 4320-4360 and possibly back to the ATH zone while a breakdown below 4040 rising support would shift the structure bearish again exposing the 3980 demand and potentially a deeper drop to 3900 if buyers fail there.
In simple terms buyers still control support, sellers still control resistance and the next big move will come once one of these critical levels breaks with strength.
✅ Option 1-Strong Bullish Bias
Gold is still respecting the rising channel and defending the strong support zone around 4000-3980. As long as price stays above the rising trendline bullish structure remains valid. A clean breakout above 4160-4200 will confirm continuation toward 4240 → 4320 → ATH retest. Buyers are still in the game, waiting for the breakout.
✅ Option 2-Neutral to Bullish
Gold is consolidating inside a rising channel after rejecting the ATH. Support remains strong around 4000-3980 while sellers continue to defend 4160-4200. A breakout on either side will define the next major move. Above 4200 bullish continuation toward 4240 and 4320+. Below 4040 deeper pullback toward 3980 and possibly 3900.
✅ Option 3-Neutral to Bearish
Gold is struggling to break above 4160-4200 showing seller strength at the top of the range. If price fails again and breaks below the rising channel near 4040 downside can accelerate toward 3980 and 3900 for liquidity. Bulls must hold support to avoid a deeper correction.
Gold remains trapped between 4040 support and 4200 resistance inside a rising wedge. Buyers holding strong at the bottom but sellers still defending the top. Break above 4200 bullish continuation toward 4320. Break below 4040 bearish move to 3980-3900. Still a range waiting for breakout confirmation.
Note
Please risk management in trading is a Key so use your money accordingly. If you like the idea then please like and boost. Thank you and Good Luck!

XAUUSD (Gold) seeking $4,000 region?As my H4 chart shows, gold did make a double top a few days ago and then crashed. You can give credit for this massive 3,800 points move to profit taking or economic uncertainty or any technical reason, maybe a combination but it really does not matter.
What does matter is that we now have a double or triple top indicating that we have more room to the down side. I am seeing a medium term bearish move followed by a consolidation and now it may be that we will get a breakout (to the down side) to give us a bearish continuation.
How far will we go? I have no idea but the round number 4,000 followed by 3,950 do make sense. If all this works out as I anticipate, it may be a good idea to close a partial position, move the stop to a level of small profit and then trail the price action.
This is not a trade recommendation; it’s merely my own analysis. Trading carries a high level of risk so carefully managing your capital and risk is important. If you like my idea, please give a “boost” and follow me to get even more.

XAUUSDDouble Bottom Pattern
Bullish Divergence (RSI)
Wait for price to break above 4024
The setup aims to catch the breakout from a bullish reversal zone confirmed by RSI and structure.

XAUUSDGold is in a correction phase, with prices near the support zone of 3973-3954. If the price fails to break above 3954, a rebound is likely. Consider buying in the red zone.
** Very Risky Trade
🔥Trading futures, forex, CFDs and stocks carries a risk of loss.
Please consider carefully whether such trading is suitable for you.
>>GooD Luck 😊
❤️ Like and subscribe to never miss a new idea!

Gold: So what now?🟡 Before the speech (pre-FOMC)
Context:
The market has already priced in the 25-bp rate cut and is now in “confirmation-waiting” mode.
With limited institutional liquidity due to the ongoing government shutdown and FX option expiries coming up tomorrow, prices tend to move mainly from position adjustments rather than new information.
Expected reaction:
• Mild intraday rebounds toward 4,050–4,100 USD, driven by hedging flows.
• But with low buying conviction — traders will wait for Powell’s words before committing to new positions.
• Contained volatility within the 3,950–4,100 USD range.
📊 Summary: Technical consolidation with wicks in both directions. Likely a small pre-event rally — classic “buy the rumor, sell the fact” setup.
⸻
🟡 2️⃣ During Powell’s speech (FOMC event)
🗣️ If Powell adopts a “moderately dovish but cautious” tone — the most likely scenario
Message characteristics:
• Confirms the 25-bp rate cut.
• Reaffirms that policy remains data-dependent.
• Acknowledges labor-market cooling and downside risks to growth.
• Avoids committing to an automatic rate-cut sequence.
Typical reaction:
🕐 First hour (high-volatility knee-jerk move):
• Gold initially jumps 30–50 USD (immediate reaction to the confirmed cut).
• The dollar temporarily weakens; Treasury yields drop.
• Price tests the 4,080–4,150 USD zone.
🕐 Second hour (institutional reassessment):
• Once markets digest that Powell isn’t promising further cuts, institutional traders interpret:
“This is prudent, not expansionary.”
• Profit-taking emerges in gold, causing a minor pullback (–20/30 USD).
• Price may stabilize again within 4,000–4,050 USD.
Net outcome (next 24 hours):
Moderate technical rebound, no structural bullish breakout.
Wide oscillation between 3,950 and 4,150, likely closing around 4,050.
⸻
🟡 3️⃣ Following days (Thursday–Friday)
If the government shutdown continues and no labor data are released:
• Lack of data = no brake for hedging adjustments.
• Traders will seek relative safety in gold as long as the dollar lacks catalysts.
• That could keep gold supported above 3,950–4,000 USD, with a short-term bullish bias toward 4,150–4,200 USD.
If the Fed signals further vigilance (without ruling out more cuts):
• Gold could build a stronger base and project a second leg higher toward 4,220–4,250 USD.
Hit the like button if you like these type of technical and fundamental analysis!

GOLD recovers ahead of US CPI data, key data dayArticle summary:
“Gold rebounded in the Asian session on October 24, trading around $4,139/ounce, as safe-haven flows surged amid renewed geopolitical tensions and investors awaited September US CPI data, which could determine the Federal Reserve’s monetary policy moves in the short term.
The recovery momentum was reinforced by expectations of an early Fed rate cut, along with the impact of Washington’s new oil sanctions on Russia and escalating US-China trade tensions. Meanwhile, technically, gold held support around $4,100, suggesting the medium-term uptrend remains intact.”
OANDA:XAUUSD maintained its recovery momentum in the Asian session on October 24, trading around $4,139/ounce, after rising sharply in the Thursday session thanks to the return of safe-haven flows amid fresh geopolitical developments. The move came as global markets await key US inflation data (September CPI), which is seen as key to shaping the direction of the Federal Reserve's monetary policy in the short term.
Economic data
The US Bureau of Labor Statistics (BLS) will release its September Consumer Price Index (CPI) tonight.
Forecasts show the US core CPI rising 0.3% month-on-month and remaining at 3.1% year-on-year, suggesting persistent inflationary pressures despite signs of cooling energy prices.
The market has all but priced in a 25 basis point rate cut by the Fed at its policy meeting next week. In a low-interest-rate environment, gold, a non-yielding asset, tends to benefit from lower opportunity costs.
“Gold’s goal is to continue its rally ahead of the CPI data,” says Valeria Bednarik of FXStreet.
Political and Geopolitical Events
Gold prices rebounded after the US imposed new sanctions on two major Russian energy companies, Lukoil and Rosneft. This is the first sanctions of President Donald Trump's second term and is seen as a significant escalation in the pressure campaign against Moscow.
According to Jorge Leon, Director of Geopolitical Analysis at Rystad Energy, "This move marks a major and unprecedented escalation in Washington's campaign against Russia."
The sanctions could impact global oil supplies, indirectly increasing the appeal of gold as a hedge against risks in an uncertain environment.
In addition, US-China tensions have also resurfaced as the White House considers restricting China’s use of US software, retaliating against Beijing’s rare earth export controls and raising port fees for US-flagged ships. These signals reinforce the “selective risk-off” sentiment in global markets.
In short, the current developments suggest that gold is repositioning itself in a medium-term bull cycle, as the market simultaneously assesses geopolitical risks and the prospect of Fed easing.
If CPI data reinforces the case for a Fed rate cut at the upcoming meeting, gold could retain its appeal as a key safe-haven asset in the fourth quarter.
Technical Outlook Analysis OANDA:XAUUSD
Technical analysis:
Gold prices are maintaining a technical recovery after a strong correction from the peak of 4,379 USD/ounce. Currently, the price is trading around 4,118 USD, approaching the Fibonacci support zone of 0.618 (4,110 USD), an important milestone to determine the short-term supply-demand balance.
On the daily chart, gold is still in the medium-term uptrend channel formed since mid-August, with the MA21 average line (4,000 USD area) continuing to act as a dynamic support base. RSI has reached the 50 area and is showing signs of forming a slight bottom, reflecting the weakening selling momentum.
In terms of patterns, the candlestick cluster of the last 2 days shows a "hammer - recovery confirmation" pattern, suggesting that demand is reappearing at the technical bottom.
Trend Assessment:
If the $4,100 zone holds, there is a high probability that gold will enter a bullish consolidation phase towards the $4,200 mark. However, a break of the $4,000 zone would open up a deeper correction towards the $3,950 area.
In the context of lower interest rate expectations and geopolitical tensions that have not yet subsided, the medium-term trend of gold remains bullish, although the current recovery is more technical than a fundamental breakout.
SELL XAUUSD PRICE 4221 - 4219⚡️
↠↠ Stop Loss 4225
→Take Profit 1 4213
↨
→Take Profit 2 4207
BUY XAUUSD PRICE 4057 - 4059⚡️
↠↠ Stop Loss 4053
→Take Profit 1 4065
↨
→Take Profit 2 4071

Potential Gameplan Scalp/Swing for Tues 27 OctPotential move and execution area for scalping or swing trading.
Let's see how it plays out and when it will play out.
Reminder: For educational purposes only.
@TeamWePrint
