Fading Rate-Cut Hopes Fuel Bearish Rally Toward Discounted zoneGold (XAU/USD) is currently trading around the $4,077 region, where the market has shown hesitation after multiple attempts to sustain bullish momentum. Price action remains capped below major resistance levels, and the broader structure suggests a potential bearish reversal toward deeper discounted zones.
🔐 Key Resistance Levels
R1: $4,106 – First barrier to the upside; failure to clear this level keeps sellers in control.
R2: $4,160 – Secondary resistance aligned with prior structural highs.
Short-term hurdles:
$4,100 (immediate),
$4,110–$4,120 (consolidation zone),
$4,185 (major short-term challenge),
$4,215 (structural resistance and bullish invalidation point).
A sustained break and daily close above $4,120 would be the first sign of recovery, while a clean break above $4,185–$4,215 is required to shift momentum back toward a bullish continuation.
Bearish Outlook Supported by Macro Drivers
Fading expectations of aggressive Federal Reserve rate cuts
A strengthening U.S. dollar
Market uncertainty as the government shutdown situation unfolds
These fundamentals continue to limit upside extension in gold and support a deeper corrective leg.
🛡️ Key Support Zone – Strategic Level at $4,023
The next critical support sits at the 61.8% Fibonacci retracement, aligning perfectly with $4,023.
This level has acted as a strategic reaction zone, and a retest here demands close monitoring:
Hold above $4,023: Expect a possible bullish reaction or short-term rebound.
Break below $4,023: Opens the door for a sharper decline into deeper discounted pricing.
🎯 Bearish Target – Discounted Zone at $3,963
Should price break beneath the strategic support at $4,023, the next major drawdown target sits at the 78.6% Fibonacci retracement near $3,963.
This area is:
A high-probability reversal zone,
A discounted price region,
A preferred level for value buyers seeking strong risk-to-reward opportunities.
A bearish continuation into $3,960–$3,965 aligns with the current technical bias and macro backdrop.
Trade ideas

Gold Surges, Resuming Bull Market!The bull market is back, and gold prices have risen as expected to above 4100. The opportunity has arrived, and it must be seized. Those who have been following the trend know that after the previous drop to 3888, we advised against excessive bearishness, suggesting a rebound from the lows, targeting 4050. A break above 4050 would trigger a one-sided trend. Although it consolidated for two weeks, Monday's opening saw a direct break above 4050, and the price has now surged to around 4140, a single-day gain of over $100 – this demonstrates the strength of the bulls' counterattack. Undoubtedly, gold is now in a bullish trend, forming a strong one-sided move. Therefore, the next targets for gold are 4186-4250, and a high of 4300.
This week is packed with positive news. The US government resumed its meetings on Monday, potentially ending the shutdown. CPI data will be released on Thursday, and PPI data on Friday. If the US government continues operating normally, the data released on Thursday and Friday will have a significant impact. The current market situation has both a solid foundation and strong intraday performance; it's just missing a data release to influence the market, otherwise the bulls would be even more aggressive. As analyzed on Monday, after gold broke through 4050 this week, we were expecting a one-sided trend, with targets at 4200 and 4300. The trend is now clear; Monday saw a direct break of 4050, a single-day increase of over $100. Having confirmed the one-sided trend, we expect it to continue today. Technically, after the daily chart's bottoming consolidation, the upward movement has broken through the Bollinger Band's middle band resistance. The next target is the upper Bollinger Band at 4300. Whether it breaks through the upper Bollinger Band will depend on the strength of the bulls. Until then, we must maintain our bullish outlook. The 4-hour Bollinger Bands have already widened, indicating the bullish momentum is just beginning. Therefore, there's not much to say; we must maintain a bullish stance and adhere to two principles: go long with the trend, don't try to predict highs, and absolutely avoid shorting. Therefore, the entry point for long positions today is around 4110, which is the support level on the short-term chart. The overall strategy is to buy on dips, targeting 4186, and potentially 4250 with a strong upward move. In summary, Jin Shengfu suggests a short-term trading strategy of buying on dips and selling on rallies. Key resistance levels to watch are 4186-4250, and key support levels are 4110-4115. Please follow the trend closely.
Selling Strategy: Sell gold in batches around 4186-4190, targeting 4160-4150, with a further target of 4130 if it breaks through.
Buying Strategy: Buy gold in batches around 4110-4115, targeting 4150-4190, with a further target of 4250 if it breaks through.

Gold Eyes 4,000 — Key Buy Zone Ahead!!Hey Traders,
Today we’re keeping a close watch on XAUUSD, which continues to trade firmly within its medium-term uptrend. Price is currently pulling back in a healthy correction, and the 4,000 zone stands out as a major confluence level — a structural support, previous reaction area, and dynamic trend touchpoint.
A controlled dip into this zone could attract fresh buyers, especially with markets still leaning toward risk caution and demand for safe-haven flows remaining elevated. As long as the broader trend structure holds, Gold may attempt another leg higher from this area.
Trade safe,
Joe.

MACD+RSI confirmation strategy- MACD (12, 26, 9) — default settings
- RSI (14) — Relative Strength Index
🟢 Buy Setup:
- MACD Line crosses above the Signal Line — bullish momentum building.
- RSI crosses above 50 — confirms strength behind the move.
- Optional filter: Price above 50-day moving average for trend confirmation.
📈 Entry: On candle close after both conditions are met
🎯 Exit: When MACD crosses back below signal line or RSI drops below 50
🛑 Stop-loss: Below recent swing low
🔴 Sell Setup:
- MACD Line crosses below the Signal Line — bearish momentum building.
- RSI crosses below 50 — confirms weakness.
- Optional filter: Price below 50-day moving average.
📉 Entry: On candle close after both conditions are met
🎯 Exit: When MACD crosses back above signal line or RSI rises above 50
🛑 Stop-loss: Above recent swing high
Disclaimer:
The information posted on Trading View is for informative purposes and is not intended to constitute advice in any form, including but not limited to investment, accounting, tax, legal or regulatory advice. The information therefore has no regard to the specific investment objectives, financial situation or particular needs of any specific recipient. Opinions expressed are our current opinions as of the date appearing on Trading View only. All illustrations, forecasts or hypothetical data are for illustrative purposes only. The Society of Technical Analysts Ltd does not make representation that the information provided is appropriate for use in all jurisdictions or by all Investors or other potential Investors. Parties are therefore responsible for compliance with applicable local laws and regulations. The Society of Technical Analysts will not be held liable for any loss or damage resulting directly or indirectly from the use of any information on this site.

gold market maintains its correctional stance around the 4100’sThe drop was swift on gold market right from 4140’s as the gold market maintains its correctional stance around the 4100’s, stabilizing momentum before the next directional move. follow for more insights , comment and boost idea

Gold’s Next Explosive Move: The Chart No One Is Talking About...Important assumption (stated clearly): I do not have the image of your exact chart or the numeric value of the blue-line target, so this analysis assumes the blue-line target is above today’s spot level and represents a meaningful resistance/target on the weekly/monthly timeframe. If your target is below current price the technical story flips — tell me the exact value or upload the chart and I’ll adapt.
---
Executive summary — the short thesis
Gold’s move toward the blue-line target is plausible because three mutually reinforcing themes are in play:
1. Macro tailwinds (inflation persistence + lower real rates expectation → higher gold demand),
2. Structural demand (central bank buying + ETF/institutional accumulation), and
3. Technical breakout dynamics (momentum, volume confirmation, and common extension targets).
Each theme alone can push price higher; together they create a high-probability path to the blue line — but risks (real yield rebounds, USD strength, rapid risk-on reversals) can abort or delay the move.
---
1) Macro and policy drivers (why gold wants to be higher)
Real interest rates are the single most important macro control on gold. Lower or falling real yields reduce the opportunity cost of holding non-yielding gold, improving gold’s appeal as an inflation hedge. Markets are pricing a path toward easier policy (or lower terminal rates) and that compresses real yields — a pro-gold environment.
Inflation expectations and uncertainty remain elevated. Where inflation expectations stay sticky, investors and treasuries use gold as insurance. If headline or core inflation surprises on the upside, that directly supports continued buying.
Geopolitical & risk-off shocks amplify the move. Any escalation in geopolitical risk (trade tensions, regional conflicts) increases safe-haven demand and often triggers large, fast price jumps.
(Load-bearing facts for this section: central bank buying, inflation drivers, Fed expectations — see cited institutional and market commentary.)
---
2) Structural demand and flows (why the rally can be sustained)
Central banks continue to add to reserves. Persistent, sizeable purchases by official buyers create a structural bid that is different from short-term spec flows — it’s long-dated accumulation. That reduces available supply for investors and supports higher levels over months/years.
ETF and institutional flows are material. Record or heavy inflows into gold ETFs and funds add persistent buying pressure; large inflows can sustain rallies beyond purely technical breakouts.
Retail and seasonal physical demand can reinforce rallies. Jewelry seasons and retail demand (Asia, Middle East) often coincide with price momentum, adding a final push toward technical targets.
---
3) Technical structure — how price actually gets to the blue line
(I’m speaking generically because I don’t have the exact chart; apply these to your time frame — weekly or daily — whichever your blue line sits on.)
Breakout + retest dynamic: If price has broken a multi-week/month resistance (or important swing high) and then retested it successfully with rising volume, the path to the next measured target (often a measured move or Fibonacci extension) becomes much more likely. Traders and algos use these confirmations to add size.
Momentum and moving-average alignment: A stack of moving averages (e.g., 50 crossing above 200 — a "golden cross" on longer timeframes) plus rising RSI and MACD momentum supports an extended impulse leg toward the blue-line.
Volume & open interest: Increasing cash/spot volume and rising futures open interest on advances indicates real participation (not just short covering). That structural participation reduces the chance of a quick reversal and helps sustain a push toward obvious targets like your blue line.
Common extension targets: Traders commonly use Fibonacci extensions (127–161.8%), prior range height projections, or measured moves from consolidation to set the “blue line” style targets. If the blue line aligns with one of these projections, it gains legitimacy as a target because many actors place orders there.
---
4) Market structure and supply-side constraints
Physical mine supply is relatively inelastic short term. Mines can’t quickly add meaningful tonnage, so when demand surges, price adjusts more than quantity. Capital spending and long lead times for new production create upward pressure if demand remains strong.
Scrap supply is cyclical and price-sensitive. As prices rise, scrap supply can increase, capping upside — but that often lags price moves, letting gold run first then supply grow later.
---
5) Alternative scenarios — what would stop it
Real yields rebound fast: A surprise hawkish central bank reaction or unexpectedly strong employment/inflation data could push real yields higher and crush the rally.
US dollar strength returns: A sharp USD rally would subtract from USD-priced gold and can stop a run toward the blue line.
Flow exhaustion / profit taking: If ETF flows stall and positioning becomes one-sided, a volatility spike could trigger a fast unwind.
---
6) Probability framing & tactical checklist (how I’d watch it as an analyst)
High-probability signals that validate the path to the blue line:
Spot > key resistance with a clean retest and higher-than-average volume.
Open interest in futures rising alongside price (not diverging).
Continued central bank purchases / ETF inflows reported weekly.
Macro path: market pricing of Fed easing or lower terminal rates, or at least declining real yields.
Warning flags: real yields spike > 50–75 bps, USD index sharply higher, or a sudden halt/ reversal in ETF flows.
---
Concrete near-term scenarios (example probability splits, adapt to your time frame)
Base case (45–55%): Macros stay supportive, technical breakout consolidates — price reaches the blue line over several weeks. (Most likely if volume and flows continue.)
Bull case (20–25%): Macro shock (big geopolitical event or accelerating inflation surprise) causes an overshoot beyond the blue line — fast, big move.
Bear / failed breakout (25–35%): Real yields rebound or flows reverse; price fails to sustain above resistance and falls back to prior support.
---
Practical phrasing you can post under the chart (English, professional + share CTA)
> Market-leading analysis (professional):
The blue-line target is a natural extension of the current multi-month breakout. Macro conditions — persistent inflation expectations, lower real yields priced by markets, and ongoing central-bank accumulation — create a structural bid. Technically, a confirmed breakout with rising volume and expanding open interest will propel price toward the blue line; Fibonacci and measured-move projections align with this target, increasing its credibility. Counter-risks are a rapid rebound in real yields or a stronger USD, which would likely stop or reverse the move. This is an analysis, not investment advice — monitor real yields, ETF flows and the breakout retest for live confirmation.
Like and comment — tell me your view and what time-frame you want me to focus on.
Gold Technical Analysis: High-Level Resistance Emerges, Focus onGold Technical Analysis: High-Level Resistance Emerges, Focus on Continued Pullback at the Start of the Week
Market Review: Gold suddenly turned downwards at the end of last week, and the key resistance level of 4210 we previously identified proved accurate. On Friday, gold prices reached a high of 4211 before retreating, breaking through the important 4100 level and ultimately falling to around 4032, resulting in a large bearish candlestick on the daily chart. This significant decline has raised market concerns about whether a continuous downtrend will form on the daily chart.
Technical Analysis: Daily Chart Analysis: Observing the daily chart, it is clear that the price highs have been gradually shifting downwards. This means that after encountering resistance at the three-point line (referring to the three key support levels), a second downward reversal is likely to occur. Currently, the fast and slow lines are still above the zero line, indicating that even if there is a decline, it is temporarily characterized as a pullback rather than a trend reversal.
Combined with candlestick analysis, the important support of the trendline is located near the $4000 psychological level. This is both our main target for short positions this week and a key position for attempting to establish long positions. If this support level is breached, gold prices could further decline to around $3890, near the lower Bollinger Band.
Key Resistance Level Analysis
It's worth noting that the halfway point resistance level of Friday's large bearish candle is precisely at $4130, which also coincides with the highest point of the rebound after the sharp drop on October 21st. If gold prices can regain and hold above this level, it would signify the end of this round of correction.
Short-Term Trading Structure
After a slight rebound at the open this morning, gold prices continued to fall under pressure, with the $4110 level forming effective resistance. Observing the 1-hour chart, gold is forming a head and shoulders pattern. As long as the price remains below $4150, this bearish structure remains intact. Even if a strong rebound occurs, as long as it doesn't break through the $4150 resistance, it should be considered a shorting opportunity.
Trading Strategy
Overall Approach
Today's core strategy is to sell on rallies. Although there is a technical rebound demand after Friday's sharp drop, the rebound strength is expected to be limited. As long as the key resistance of $4111 cannot be effectively broken, any rallies should be opportunities to short. Specific Trading Suggestions
Short Position Strategy:
Sell gold in batches around 4110-4120, with a position size of 20% of your capital.
Set a stop-loss of 8 points.
Target price: 4080-4060, with a further target of 4030 if the price breaks through.
Long Position Strategy:
Buy gold in batches around 4035-4040, with a position size of 20% of your capital.
Set a stop-loss of 8 points.
Target price: 4060-4080, with a further target of 4090 if the price breaks through.
Risk Warning: Investors must strictly control their position size and adhere to stop-loss discipline. Avoid holding losing positions. Specific entry points need to be adjusted based on real-time market movements. This analysis is for reference only.
Key Resistance Level: 4110-4150
Key Support Level: 4030-4000

THE KOG REPORT THE KOG REPORT:
In last week’s KOG Report we wanted to stick to a similar plan from the week prior, looking for price to attempt either the high to short it again, or, for price to attempt to break the lower box and then give us the opportunity to long again. We had to switch to intra-day trading during the week due to the ranging and as usual, the indicators worked well giving us some good trades and we near enough got what we wanted from the KOG report analysis and the red box targets published.
So, what can we expect in the week ahead?
Potential for this range to continue during the first half of the week with the immediate resistance above at 4006-10 which will need to break in order to target the 4030 level which is what we’re looking for. For this to happen, support 3990 needs to hold us up and if we can push upside it’s that 4030 level we want to keep an eye on. Rejection there can again lead to another swoop of the lower regions but, we need to keep in mind that red box below. That is the key level of defence for the early part of the week and will need to break!
The indicators are suggesting lower at the moment but we need more confirmation and we also need to see if they fill the void left over above from Friday.
In our opinion, another choppy week ahead, more ranging and whipsawing while we accumulate and await that clear confirmation of direction. Until then, it’s level to level and intra-day Red box trading for us.
RED BOXES:
BREAK above 4004 for 4010, 4014 and 4030 in extension of the move
BREAK below 3990 for 3985, 3979, 3970 and 3965 in extension of the move
Many of you have asked what the “Bubbles/circles” are on the chart! These are the hot spots we have been sharing with you that work well as RIPs! We share the monthly results and daily hot spots and I’m sure our traders will agree, they are powerful!
Please do support us by hitting the like button, leaving a comment, and giving us a follow. We’ve been doing this for a long time now providing traders with in-depth free analysis on Gold, so your likes and comments are very much appreciated.
As always, trade safe.
KOG

DeGRAM | GOLD will reach the $4380 level📊 Technical Analysis
● Gold remains within a rising channel, pulling back toward the mid-range support near 4145–4130, where price previously rebounded and maintained bullish structure.
● A continuation pattern is forming above the trendline, and holding this support zone should trigger a move toward 4211 and the upper channel boundary near 4380.
💡 Fundamental Analysis
● According to FXStreet, softer US yields and dovish Fed expectations continue to support demand for safe-haven metals in the short term.
✨ Summary
Support: 4145–4130. Targets: 4211 → 4380. Bullish scenario remains valid while price stays above trendline support.
-------------------
Share your opinion in the comments and support the idea with a like. Thanks for your support!

Gold Price Consolidation – Bullish Bias Facing Strong ResistanceGold prices extended their gains on Monday, reaching their highest level in recent sessions, as weak U.S. economic data bolstered expectations for a potential Federal Reserve rate cut. Meanwhile, a softer U.S. dollar provided additional support for the precious metal.
The ongoing progress toward ending the U.S. government shutdown has added some optimism to broader markets; however, gold remains in a consolidation phase, showing signs of bullish momentum while facing strong resistance levels.
From a technical perspective, if bulls manage to break above the key level of 4089, which has served as a significant rejection zone multiple times in recent sessions, prices could see a strong upside move toward the next resistance levels at 4115 and 4140.
You may find more details in the chart,
Trade wisely best of Luck Buddies.
Ps; Support with like and comments for better analysis Thanks for Supporting.

GOLD soon below 3700$Gold has experienced a decisive breakdown below its key trendline support, followed by a technical retest of the same level—now acting as resistance—in a classic role-reversal pattern. The subsequent rejection from this level suggests the bearish momentum is likely to extend further. The current correction appears to be gathering pace, with a breakdown below $4,000 now looking increasingly probable. Should this occur, the next primary technical target would be the $3,700 support zone.
DISCLAIMER: ((trade based on your own decision))
<<press like👍 if you enjoy💚

GOLD WEEKLY CHART MID/LONG TERM ROUTE MAPHey everyone,
Please check out our updated Weekly Chart Route Map, featuring updated revised key levels after completion of our last long term weekly chart idea for precise level-to-level tracking.
Price action has successfully filled EMA5 detachment (highlighted with a circle) and we are now seeing price play between 4059 (resistance) and 3821(support).
To determine the next directional move, we’ll need a decisive test and break of either boundary level. On the broader horizon, 3006 stands as the long-range pivotal swing zone, which may come into play if a major correction unfolds.
🔹 Note: The key distinction between a retracement range and a swing range is that swing ranges typically produce larger bounces and wider price reactions compared to standard retracement ranges.
We’ll continue to update this outlook throughout the week as the structure develops. Thank you all for your likes, comments and follows, we really appreciate it!
Mr Gold
GoldViewFX

GOLD XAUUSDnewyork session rejected the 4243-4244 zone ,the technical analysis hinges on daily double top structure break of neckline and buyers return to retest a broken neckline at 4243 and dropped to 4146-4150 zone during the newyork session ,on 4hrs using the line chart we have a strong psychological horizontal structure and another break and retest to close newyork session on another 200pips buy trigger.
break and close 4146-4150 will be another bearish correction .

Gold: Consolidation Is Not Over YetGold turned sharply lower in October, pulling back around 10%, which is quite normal after such a strong and aggressive recovery this year. The key question now is whether this is now wave four of an ongoing extended black wave five cycle, or if wave five already completed leg out of triangle, at the 4380 area !?
Well, notice that Gold turned lower at the end of last week from the trendline resistance after only an ABC rise into the 61.8–78.6% Fibonacci zon e, and the market then dropped enough to overlap the 4042 level . This makes me think we are in the middle of a complex correction.
It can be a triangle, it can be a flat, it can even be a WXY formation, so overall it looks like metals will stay inside this correction for a bit longer.
There is also a risk that lower supports will be retested first. The first important support is around 3940, but if that one gives way then the next bigger zone is down at 3700–3800. So, ff we are correct, metals will still resume higher later on, but right now we are still stuck inside this corrective phase, so it’s better to stay patient.
GH

DeGRAM | GOLD is attempting to consolidate above resistance📊 Technical Analysis
● XAU/USD confirmed a breakout above the descending resistance channel and is now consolidating above the $4,100 support level, signaling a continuation of the bullish structure.
● Price action shows higher lows and consistent buying momentum, projecting a potential rise toward the next resistance zone at $4,380 after minor pullbacks near $4,130.
💡 Fundamental Analysis
● Gold remains supported by declining U.S. Treasury yields and increased geopolitical risk appetite for safe-haven assets amid softening dollar sentiment.
✨ Summary
● Support: $4,100. Resistance: $4,380. Momentum favors continued upside toward $4,380 following a short-term correction phase.
-------------------
Share your opinion in the comments and support the idea with a like. Thanks for your support!

XAUUSD AB=CDHello traders, hope you’re doing well this trading week and that you’re all catching some nice pips from the markets. Today I’m looking at Gold (XAUUSD, 1H) and we’ve got a clean bearish AB=CD symmetry setup on the chart, offering a potential short opportunity.
Price has completed the AB=CD leg into the PCZ, with point D landing right around the 0.786–1.000 AB zone (≈ 4,241–4,280). This is my Potential Completion Zone (PCZ) where I’m watching for signs of exhaustion and rejection.
Key Levels
PCZ (short idea zone): 4,241 – 4,280
TP1: 4,199 – 4,188 (first reaction target)
TP2: 4,174 – 4,156 (127–161.8% extension zone)
Invalidation: Clean break and hold above 4,280
Trading Plan
If I get bearish confirmation (wick rejections, bearish candle close, or breakdown from local structure), I’ll look for shorts from the PCZ, targeting TP1 first and then TP2 if momentum continues. A sustained move above 4,280 cancels the bearish idea and suggests standing aside or reassessing for a bullish continuation.
Manage risk carefully, keep size controlled, and let the AB=CD symmetry do the heavy lifting.

Gold Pullback Expected After Hitting Trend Line ResistanceGold price is testing the upper trend line resistance after a strong bullish rally. A potential pullback toward the 4157 target zone is expected before the next move. Key support levels remain below 4100.

Continued bullish run but be careful of the US shutdown endWith enough volume, if Gold goes pass the 4.146 mark, and retest
we may have a bullish run adding on to the 3 week. But be weary of the
US shutdown which may boost the $ weakening the bullish run.

Gold market targets 4190 Gold market continues its bullish trajectory, rallying through 4130’s – 4146, which triggered an imbalance sweep down to 4113. This correctional move sets the pace for a potential extension toward the 4190 zone. follow for more insights , comment and boost idea

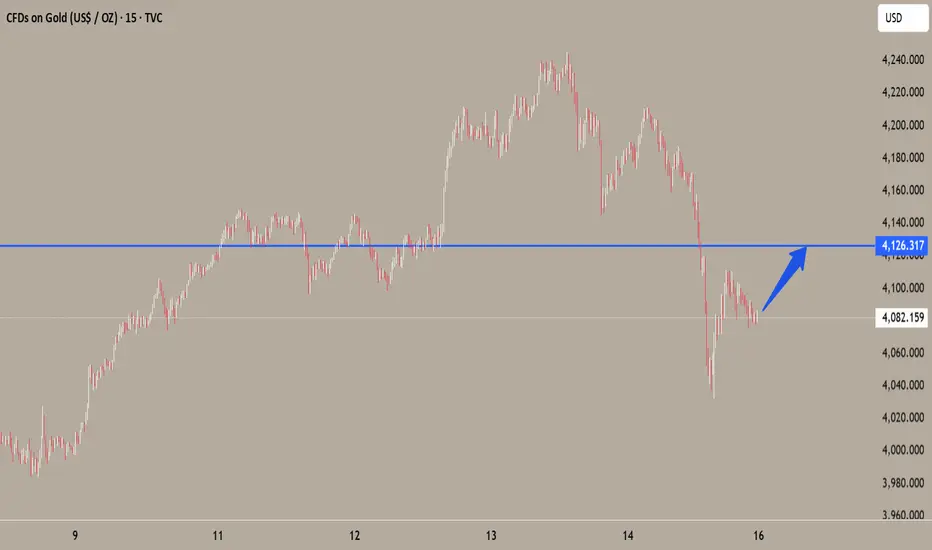
XAU/USD: Retest of 4,150 Holds as Bulls Eye Channel ExtensionXAU/USD is reclaiming ground above the broken range, retesting the 4,150 zone while maintaining bullish momentum from the recent breakout. Price is forming higher lows along the upward trendline, beneath the descending resistance line.
A sustained move above 4,150 keeps the path open toward 4,285, as long as buyers defend the retest. Momentum remains bullish, with potential for further extension into the upper resistance zone.
❗️ Risks:
– H4 close below 4,150 weakens the setup.
– Strong USD data may trigger a pullback.
– Rejection from the descending trendline could stall momentum.

XAU/USD Gold looking strong breakout buying move📈XAUUSD (Gold) Analysis – Strong Bullish Momentum 🚀
Gold is showing a powerful bullish trend with a confirmed resistance breakout around the 4065 level. Buyers are holding strong from the breakout zone, indicating continued upside potential.
🎯 Technical Targets:
4132
4170
4205
🕓 Timeframe: 4H Chart
The momentum remains bullish as long as price sustains above the breakout zone. Watch for pullbacks toward support areas for potential buying opportunities.
⚠️ Risk Management:
Always apply proper risk management — never overleverage and use stop-loss protection.
💬 Like | 🔁 Share | 💭 Comment | 📲 Follow for more professional insights

Trade Idea: Bearish Reversal in GoldPrice is currently within an ascending channel (blue) but has shown signs of weakening near the upper trendline. Expecting a pullback towards the purple support zones around 4,120 and 4,103. Consider shorting at resistance levels with a target at these support zones. Keep an eye on market conditions for confirmation of the reversal.
Entry : Around current price near resistance
Target : 4,120 - 4,103
Stop Loss : Above recent highs

Another Golden Opportunity!Gold's corrective move the past few weeks has now led to a bounce, expect some more gains in a likely ABC bounce to be followed by further correction towards $3800ish.
This wave 5 might only be wave 1 finished at $4380, a wave 2 corrective decline to be followed by a stronger wave 3...of course anything can happen, new highs in the next week or so will be very welcome.
Let's see the pattern play out before we are clearer on the outcome, expect this bounce to peter out towards $4190ish, if a resumption of the correction develops, another golden opportunity presents itself around $3800.
Whatever happens, this wave 5 will see $5000 plus and possibly $6000...remember $3000?
Appreciate a thumbs up, good trading and God Bless you all!
