Trade ideas

XAUUSD ANALYSIS🪙 XAU/USD – Market Insight (Breakout Confirmation)
Structure Update
Price has broken above the descending trendline, marking the first valid breakout after multiple lower-high rejections.
The breakout candle closed above the diagonal, aligning with the Breaker Block + FVG (3,955–3,968) zone.
This area now transitions from resistance into a potential support-retest zone.
Current Context
The broader trend remains bearish, but the breakout suggests a possible short-term retracement phase before trend continuation.
The structure between 3,955–3,968 will decide whether price sustains momentum upward toward 3,985–3,994 (OB/Golden Reaction Zone) or rejects back to the 3,905 liquidity pocket.
Scenarios to Monitor
1️⃣ Bullish Case (Continuation)
Price holds above 3,955 and shows bullish confirmation at the retest zone.
Next potential upside area: 3,985–3,994, where OB and equilibrium converge.
Above 3,994, the next liquidity target lies around 4,010–4,020 (premium zone).
2️⃣ Bearish Case (Fake-out)
If the candle closes below 3,955 after retest, the breakout invalidates.
This would signal a liquidity sweep, opening room for a move back toward 3,905 and possibly the weak low near 3,880–3,890.
Trader Lenses
Scalper: Watch M1–M5 reactions within 3,955–3,968. A small rejection-retest can offer short-term confirmation bias.
Intraday: Focus on M15–H1 structure holding above 3,955 before anticipating upside toward OB zone.
Swing: Wait for H4 confirmation. The trendline break alone isn’t enough—need BOS above 3,994 to shift higher-timeframe bias.
Market Sentiment Factors
Gold remains sensitive to USD index moves and bond yields.
Any hawkish Fed comment or strong US data may limit upside; weaker USD can support retracement strength.
⚠️ Disclaimer
All analysis provided is for educational and informational purposes only.
This does not constitute investment advice or a buy/sell signal.
Always manage your risk and confirm entries with your own strategy.

The gold price is still in the process of correcting Wave 4The gold price is still in the process of correcting Wave 4, and nothing has changed structurally.
Currently, the price continues to respect the corrective zone we have been monitoring, and the internal waves still support the complex WXY pattern. This tells us one thing:
⏳ The correction is not over.
Once Wave 4 is complete, the real opportunity will begin:
✅ First impulse up → confirms trend resumption
✅ Pullback (Wave 2) → optimal entry point
✅ Wave 3 → highest potential reward 🚀
If the price breaks above the current resistance zone from here, we will monitor the alternative count. However, as long as the structure hasn't confirmed it, we remain patient.
Remember:
Corrections are designed to test patience.
Wave 4 is historically the most complex wave; triangles, flats, and complex structures are common.
Remain disciplined. Let the structure settle. The next leg up will be worth the wait.
Based on my experience and my IDA, the market should sell. My taBased on my experience and my IDA, the market should sell. My target is you can trade according to your own calculations.

Gold /XAUUSD long🎯 Idea Summary:
· Direction: Long
· Instrument: XAUUSD (Spot Gold)
· Primary Timeframe: 4H
· Bias: Bullish (Counter-trend bounce)
📊 Technical Rationale:
· Market Structure: The longer-term trend is still bullish, but price has corrected into a major support zone. Looking for a bounce.
· Key Levels:
· Support: $2315** (Previous Resistance), **$2300 (Major Psychological & Swing Low)
· Resistance: $2340** (Recent Swing High), **$2355 (21 EMA)
· Price Action / Pattern: Price is approaching the $2315 support. Watching for a bullish reversal candle (like a hammer or bullish engulfing) for a confirmation signal.
· Confluence:
· The $2315 level coincides with the 61.8% Fibonacci retracement of the last major up-move.
· RSI is entering oversold territory (<30), suggesting selling pressure may be exhausting.
⚙️ Trade Setup:
· Entry Zone: $2315 - $2320 (On a bullish confirmation candle)
· Stop Loss: $2305 (Just below the key $2300 psychological level and the Fib level)
· Take Profit Targets:
· TP1: $2340 (First resistance, take 50% off)
· TP2: $2350 (21 EMA & next resistance)
· Risk-Reward Ratio: ~1:2.5
💡 Narrative / Fundamental Context:
This is a mean-reversion play within a bull market.The confluence of a major Fibonacci level, prior support, and oversold RSI creates a high-probability zone for a technical bounce. A break below $2300 would signal a much deeper correction is likely.
Disclaimer: This is my personal analysis and not financial advice. Trading commodities like gold carries a high level of risk. Always do your own research (DYOR) and manage your risk appropriately.

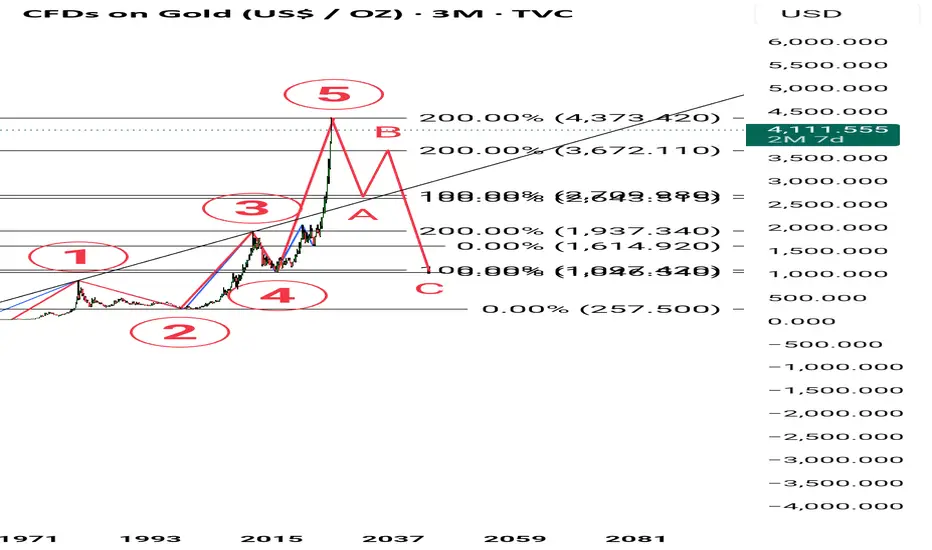
$GOLD topped until 2026?TVC:GOLD seems topped, by 105 days cycle 15(weeks) we can await a pullback after left ranslation by gold

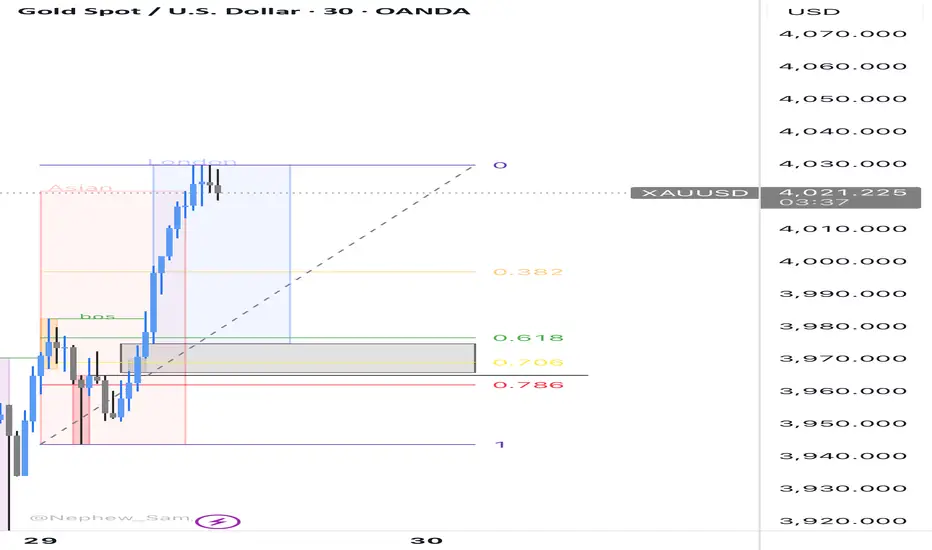
Sell XAUUSDFrom this 1H chat, I have 3 narratives that could play out
- London session didn’t sweep Asian’s liquidity with means US session would sweep London liquidity
- using Fibonacci tool, I see that golden zone 0.618 … there’s also an Imbalance in that area
- the last bearish candle before an impulse move is an order and it’s around that area
There’s a current resistance now
You know what to do with this information
Gold Breakdown Alert! Bears Aiming $3980 NextGold is currently showing a descending triangle / bearish channel pattern on the 15-minute chart. After testing the upper trendline resistance around 4113–4115, price has started to reject, indicating potential downward pressure.
The trendlines show clear lower highs and lower lows, confirming a short-term bearish structure. Volume is also decreasing on upward moves, suggesting weakening buying momentum.
📉 Trade Setup (Scalping / Intraday)
Signal: 🔻 SELL XAU/USD below 4105
Entry Zone: 4105 – 4110
Target 1: 4050
Target 2: 3980
Stop Loss: 4135
Risk/Reward Ratio: ~1:2
⚙️ Technical Indicators
Trendline Resistance: 4115
Support Zone: 4050 / 3980
Momentum: Bearish bias
Structure: Lower highs forming under descending resistance
💬 Analyst View
Gold may continue its short-term correction phase if it fails to hold above the 4110 resistance zone. A breakout below 4100 could trigger a fresh wave of selling pressure targeting the 4050 area initially.
If bulls reclaim 4135, this analysis becomes invalid and could shift bias to neutral.

Weekly Gold Analysis As you can see I expect the 2 Fair value gaps to be tested before the market makes another move towards the downside

GOLD Still Very Bearish , 2 Short Setups Valid To Get 500 Pips !Here is My 30 Mins Gold Chart , and here is my opinion , we are Below 3972.00 With 4H Candle And this never happened for a long time ! and we have a 4H Candle closure below it And Perfect Breakout and this give us a very good confirmation , so we have a good confirmation now to can sell after the price go back to retest the broken area 3972.00 and this will be my best place to sell to can use small stop loss , and i have another place if he price will not go up more to retest 3972.00 m we have a very good res level 3940.00 , if we have a good bearish price action when the price touch it we can sell from it and targeting 100 to 200 pips , and if the price didn`t give us a good bearish price action from it i will wait the price at 3972.00 to can sell and targeting 200 to 500 pips , if we have a daily closure above this area this mean this idea will not be valid anymore .
Reasons To Enter :
1- Perfect Breakout .
2- Clear Bearish Price Action .
3- Bigger T.F Giving Good Bearish P.A .
4- Bearish Control .
5- Perfect 4H Mins Closure .

#XAUUSD: Two Entries, Three Targets, Swing Sell! Gold dropped to 3883 region, the lowest point in the last two months. Since then, it has started rebounding. Currently, the price is approaching a very important key level, which could lead to a smooth reversal. However, market conditions will be extremely volatile, making it difficult to predict any move. This is because we have the NFP coming up. Due to this volatility, both of these entry points are equally possible.
Once either entry is confirmed, you should place a target based on your risk management and trade planning. Remember, this is not a confirmation, and the price could go in the opposite direction. Please do your own analysis before making any financial decisions.
We are here to help. If you have any questions related to this analysis or any trading matter, please drop a comment. We will do our best to help you out. If you want to support us, please like and comment on the idea.
Team Setupsfx_

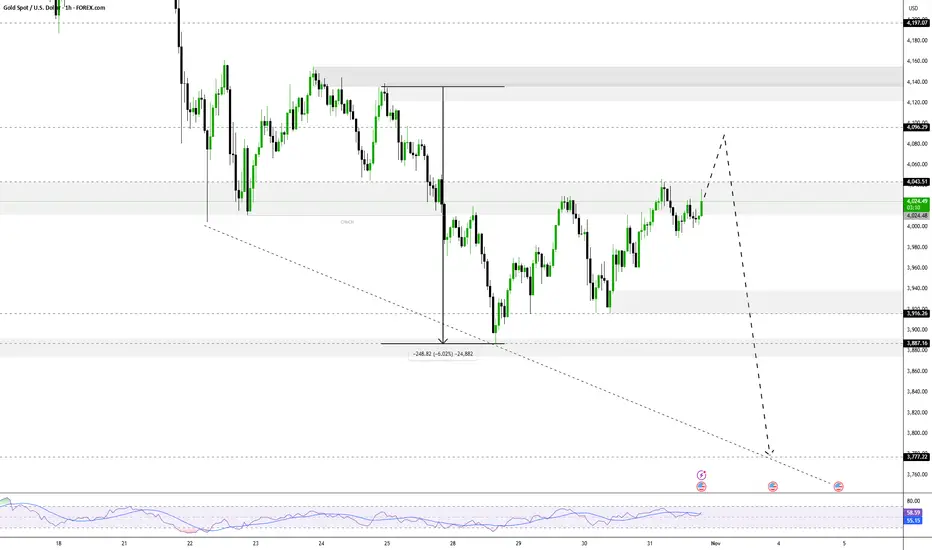
Lingrid | GOLD Weekly Market Outlook. Rally’s End or Reset?OANDA:XAUUSD explosive October rally — crowned by a historic monthly candle that shattered resistance and ignited euphoria — has now entered its reckoning phase. What looked like unstoppable momentum is now revealing signs of exhaustion. The sharp, volume-fueled drop toward $4,000 isn’t just a “healthy correction” — it’s the first real test of whether this bull can withstand gravity. And right now, the charts are whispering: "it may go down south".
The 4H chart reveals a classic “impulse leg” followed by an aggressive A-B-C correction — and we’re still in the “C” leg. But here’s the twist: if price breaks below $3,850 with conviction, the entire bullish structure collapses. That would open the door to a much deeper pullback — potentially down to $3,700 or even $3,600, targeting prior support zones and retesting the long-term upward channel’s lower boundary.
The monthly chart confirms the big picture: gold is in a powerful uptrend, but also in overbought territory after a vertical spike. The October candle closed above its open — a sign of strength, yes — but also a potential exhaustion signal since it formed a pinbar pattern. When markets rise too fast, they often fall harder.
In essence, gold is no longer climbing — it’s consolidating under pressure. The bull hasn’t died, but it’s breathing heavily. For us, this means one thing: sell the rips, buy the dips only if structure holds. The path of least resistance may now be downward. We should wait for confirmations.
If this idea resonates with you or you have your own opinion, traders, hit the comments. I’m excited to read your thoughts!

Gold Outlook after the Dip. What to expect NOW?The price correction has ended, and the price is now in a strong support zone according to Fibonacci levels. From this point onward, the price is expected to rise and retest its previous high.

How to Identify Higher Highs and Lower Lows AccuratelyIn price action trading, identifying Higher Highs (HH) and Lower Lows (LL) may seem simple, but it’s actually one of the most essential foundations for reading market structure.
If you get it wrong, you’ll often end up trading against the trend without realizing it.
1. Understanding Higher Highs & Lower Lows
Higher High (HH): a new peak that’s higher than the previous one → indicates the uptrend is still intact.
Lower Low (LL): a new trough lower than the previous one → confirms the downtrend continues.
It sounds simple, but the tricky part lies in choosing the correct main swing to read from.
2. Common Mistakes That Mislead Traders
Many traders identify HH–LL patterns on very small timeframes, which causes confusion because of minor pullback waves inside the bigger trend.
Example:
The M5 chart might show HH–HL (uptrend), while the H1 chart is clearly forming LL–LH (downtrend).
If you buy based on the small timeframe, you’re essentially buying into a pullback.
💡 Pro tip: Always identify the main market structure on higher timeframes (H1–H4) before looking for entries on smaller ones.
3. How to Identify Them Accurately
Find the main swing:
Look for the points where price truly reverses with strong candles or noticeable volume.
Mark clear highs and lows using the swing high/swing low tool.
Check structural continuity:
If HH and HL remain intact → the trend is bullish.
If LL and LH keep forming → the trend is bearish.
If the structure breaks (for example, a HH forms in a downtrend) → the market may be shifting direction.
4. Practical Tips
Use the H4 timeframe to determine the overall trend.
Then, drop to M15 or M30 to locate precise HH/LL points for entry.
Avoid identifying HH/LL inside sideways (ranging) markets — it’ll only confuse your analysis.
I think cycle the end This is only idea history base idea i dont know this is correct or not but this is very high rate poor person how to buy yellow metal uff heavy rate in markets this is danger for human life gold is not safe for womans snatching problums in humans life sorry for my poor language
( Gold Protocol ) Bullish & Bearish Reversal Detected➕ Bearish Reversal " 4115 Zone
➕ Bullish Reversal : 3990
🩸 Volume Surge Confirmed — Institutional buyers active
🩸 Session Aligned — Timing matches liquidity expansion window
🩸 Cluster Shield Formed — Demand imbalance verified
🩸 Delta Shift Positive — Accumulation phase confirmed
🩸 POC Retest Completed — Weak shorts absorbed
🩸 Structure Break Pending — Bullish intention verified
Logic: This is engineered reversal, not prediction.
💯 Objective: Controlled execution with minimal drawdown.

XAUUSD remains stable at high levels, focus on what comes nextHey everyone, Erik here.
XAUUSD has been showing strong momentum lately. After a sharp decline, the market quickly recovered, rebounding powerfully from the lower boundary of the newly projected channel. What initially appeared as weakness was actually a calculated shakeout, trapping sellers before reversing upward with confidence.
This behavior is typical of strong bullish trends. It clears out weak positions, triggers stop losses, and restores balance before the next upward movement. At this stage, the market appears to be entering the early phase of a new bullish impulse.
There might be a short consolidation or a slight correction, but the momentum is clearly pointing toward the upper boundary of the channel. For XAUUSD, the bullish continuation scenario seems far more convincing.
My target is around 4,585, near the upper resistance zone of the projected channel. The overall market structure remains decisively bullish, and the emotional surge during the last drop may become the fuel that powers the next strong rally.

The Ultimate GOLD & SILVER Outlook || 5 Trade Setups + FOMC UpdaWelcome to Trade with Decrypters!
📊 DETAILED & COMPLETE ANALYSIS (5 TRADE SETUPS) — Gold & Silver Outlook
1️⃣ Central Bank Buying
* Q1–Q2 2025 net: 410t (+15% YoY)
* August: +19t
* BRICS hold 6,000t (21% of global reserves)
* Top buyers: 🇵🇱 Poland +90t | 🇨🇳 China +35t
* Motive: USD hedge + BRICS 2026 currency prep
📈 Outlook: Sustained demand supports 10–15% long-term gold upside
2️⃣ ETF Inflows & Sentiment
* Q3 inflows: $26B | AUM $445B (+25% YoY)
* Holdings: 3,200t
* Asia: +37t | US: Neutral
* Gold RSI: 68 (Support: $3,800 | Resistance: $4,000)
* Silver RSI: 72 (Support: $32)
🎯 Projection: Gold → $4,000/oz (Q4, +1%) | Silver → $35/oz (+9%)
3️⃣ Macro & Geopolitical Events
* Fed cuts: 75bps → 3.75%
* USD: -8% | CPI: +3.2%
* Tariffs add +0.5% global inflation (→ 4.2%)
* BRICS trade pacts counterbalance USD weakness
* Gold already +57% YTD on 20% risk premium
📊 Outlook: Trade wars + Fed easing = 5–7% metals gain H1 2026
4️⃣ Silver Deficit
* 2025 deficit: 118M oz
* Supply: 1.02 Boz | Demand: 1.20 Boz
* Industrial share: 59% (EVs China +25%, Solar +30%)
* Recycling: 20%
📈 Projection: 150M oz deficit (2026) → Silver +15%
5️⃣ Futures & Options Flow
* CME Gold OI: 550k (+10% MoM)
* Silver OI: 180k (+8%)
* GVZ: 18%
* Call/Put ratio: 2:1 | Net long: 65k gold calls
📊 Outlook: OI rise + call bias = 20–25% vol breakout Q1 2026
🔮 Fundamentals & Forecast
* Gold: 450t CB buying + de-dollarization →
🎯 $4,200/oz (end-2025, +12%) | 🎯 $5,000 (2026)
* Silver: 118M oz deficit + 59% industrial →
🎯 $38/oz (end-2025, +18%) | 🎯 $60 (2026)
⚡ Drivers: Fed easing, 4.2% inflation, US deficit, BRICS shift → strategic metals outperformance
🏦 FOMC Update (Oct 29, 2025)
* Decision: 2:00 PM ET
* 98%+ chance of 25bps cut → 3.75–4.00%
* Powell press conference: 2:30 PM ET
* Dot plot & QT update expected
* Markets volatile → cut likely supportive for Gold, Silver, Stocks & Crypto
Disclaimer: This analysis is for educational purposes only. Not financial advice.

XAUUSD: Will Gold Continue to Rise or Fall?👋Hello everyone, what do you think about OANDA:XAUUSD ?
As of writing, gold is trading around $4115, partially recovering from the sharp decline of the past few days. To explain the steep drop in gold prices on Tuesday, there’s no need for any conspiracy theories — the previous meteoric rise was already a big enough reason.
Earlier, gold reached extremely high levels, and the rally had matured; any irrational market could fall without a clear reason.
Despite this, while gold remains under technical selling pressure after the shock, the market is holding the initial support level above $4,000. After this volatility, it may take longer than expected for precious metals to regain stability. However, it’s still too early to conclude whether this is a "market crash" or just a short-term correction.
From a technical perspective, gold is reacting well to the $4000 support I had previously anticipated . If it can hold, the next challenge to watch will be the first resistance zone around $4200 - $4230. As long as the support holds, I’m still betting on an upward trend.
What about you? What do you think about gold prices? Will it continue to rise or fall? 💬Leave your thoughts in the comments below!

Gold is entering a correction phase!Gold is currently moving within a corrective phase, which appears to be developing as a WXY structure.
Price is now completing wave X, with one final minor wave C to the upside likely remaining.
The more probable scenario suggests a limited bullish move toward the 4140–4180 zone before continuing lower as part of wave Y.
Bullish trigger: 4046 (for the final leg of wave C)
Bearish alternative: A confirmed breakdown and consolidation below 3960 would invalidate the current count and shift focus to a continuation of the broader bearish move — in that case, the wave structure will be updated accordingly.

gold usdHI GUYS,
GOLD usd is on the right shoulder , expect buys in london session to Take profit GRAND FINAL H4 HS

Gold Pullback Could Be the Next Buying OpportunityHello, traders, I want share with you my opinion about Gold. The market for Gold has been trading within a clear bullish structure, forming an ascending channel since breaking out from the earlier range near the 4,050–4,100 zone. The breakout from that consolidation led to strong upward momentum, with price making consistent higher highs and higher lows. Recently, the market faced strong selling pressure from the Seller Zone near 4,366, which aligns with the Resistance Level. After a retest of this supply area, price rejected and started a correction within the channel. The price is approaching the Buyer Zone around 4,205, which also coincides with the lower boundary of the ascending channel and the previous support level. This confluence makes the area significant for potential bullish reactions. I expect Gold to retest the Buyer Zone (4,205) and, if buyers show strength, a bounce toward 4,320–4,366 could follow. This would represent the continuation of the uptrend within the ascending channel. However, if price breaks below 4,205, it would signal a possible shift in structure and open the door for a deeper correction toward the 4,100 area. Please share this idea with your friends and click Boost 🚀
