GOLD 1H CHART ROUTE MAP UPDATE & TRADING PLAN FOR THE WEEKHey Everyone,
Please see our 1h chart levels and targets for the coming week, which is still active and in play.
We are seeing price play between two weighted levels with a gap above at 4221 and a gap below at 4169, as support. We will need to see ema5 cross and lock on either weighted level to de

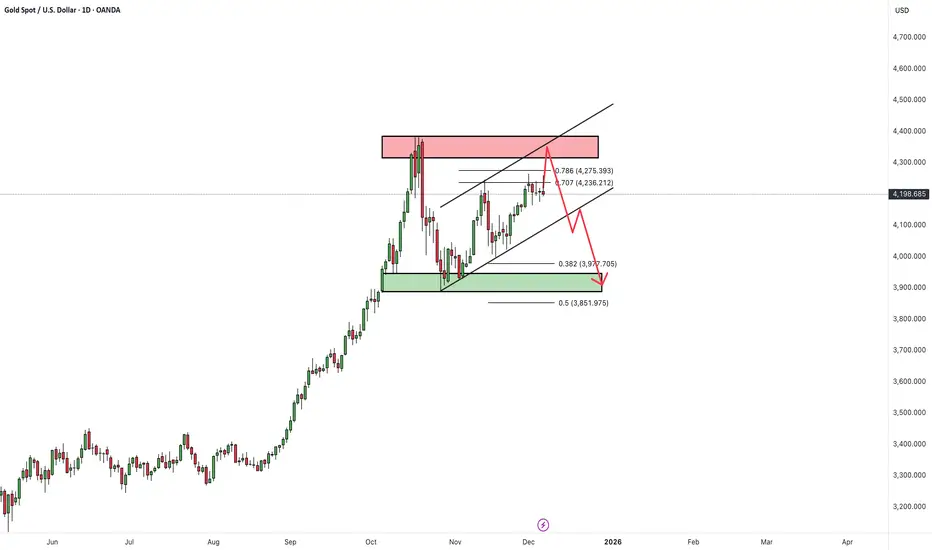
Lingrid | GOLD Contraction Phase Before Trend ContinuationOANDA:XAUUSD is sliding back into the mid-range support after printing a new higher high, where price briefly tapped the upper resistance band. The current decline resembles a multi-leg corrective pullback rather than trend exhaustion, especially with the structure still respecting the rising trend

XAUUSDHello Traders! 👋
What are your thoughts on GOLD?
Gold continues to trade within a short-term ascending channel and is now approaching the upper boundary, which aligns with a major resistance zone formed by the previous swing high. This creates a strong confluence area where sellers may become acti
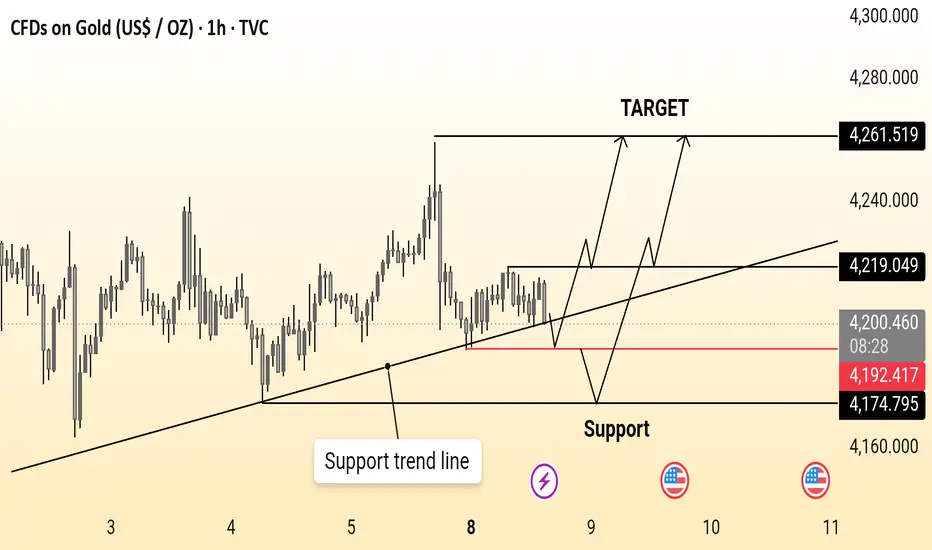
Gold ideaGold (1H) is holding above a rising support trend line, maintaining a bullish structure. As long as price stays above the 4,174–4,192 support zone, a move toward 4,261 remains likely.
GOLD → Retest of consolidation support on uptrend FX:XAUUSD is trading in a sideways range around $4,200, awaiting new labor market data to determine the Fed's policy trajectory after December's rate cut.
Weak US data (a 32K decline in ADP employment and a slight increase in ISM services to 52.6) did not change market expectations. The proba

GOLD → The battle for zone 4200. Bullish trend FX:XAUUSD is forming a local trading range of 4180-4230, trying to stay above 4200 after yesterday's correction ahead of important US employment and services data.
The dollar is weakening amid expectations of a Fed rate cut on December 11. News concerning Powell, namely Fed chair candidate Kev

XAU/USD | Gold Update : Watching 4192 and 4240 Closely!By analyzing the #Gold chart on the 4 hour timeframe, we can see that price followed the previous analysis perfectly and hit the first target at $4240, even pushing slightly higher to $4242. After that move, gold pulled back and corrected all the way down to $4175. Right now gold is trading around $

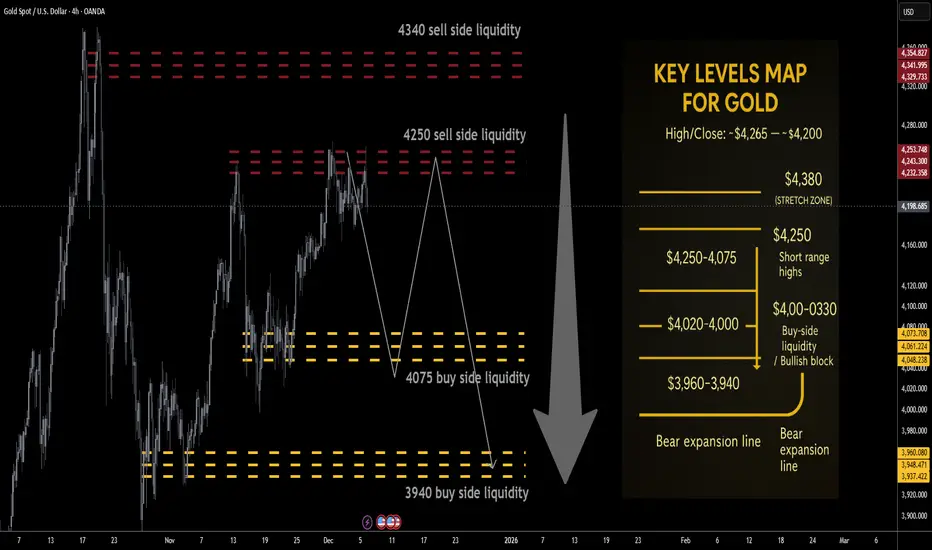
Gold next week Key S/R Levels and Outlook for Traders🔥 GOLD WEEKLY SNAPSHOT — BY PROJECTSYNDICATE
🏆 Swing High / Swing Low
$4,265 → ~$4,164 — clean rejection from the 4,26x breakout zone with a long upper wick, but weekly close still near $4,200, keeping price pinned in the upper part of the broader $4k range.
📈 Trend
Higher-timeframe: Structur
XAUUSD Bullish Trend in Play — Path Open Toward 4,300 TargetHello traders! Here’s my technical outlook on XAU/USD (Gold) based on the current market structure. Gold remains in a broader bullish trend, supported by a clearly defined rising Trend Line that has guided price action since the beginning of the impulsive move. After the initial breakout from the Su

Gold Trade ideaGold (XAUUSD) is holding above the rising trendline support. A pullback toward the support zone is expected before a bullish continuation. A breakout above 4245 resistance could open the way toward the 4275–4299 levels.

See all ideas
Displays a symbol's price movements over previous years to identify recurring trends.