XAUUSDHello Traders! 👋
What are your thoughts on Gold?
Gold experienced a sharp decline last week, but found support around the $4,000 zone, leading to a modest rebound.
Since then, the price has entered a range-bound phase, oscillating between key support and resistance levels.
Current Outlook:
The next directional move depends on a breakout from this consolidation range:
A break above the resistance zone could trigger a move toward the previous high.
Conversely, a break below the support zone would likely signal a deeper bearish continuation and formation of new lows.
For now, gold remains in a neutral range, and it’s best to wait for a confirmed breakout before taking new positions.
Don’t forget to like and share your thoughts in the comments! ❤️
Trade ideas

Gold Drops Sharply – Losing Over 1000 Pips👋Hello everyone , what do you think about OANDA:XAUUSD ?
Gold continues to lose value for the third consecutive session on Tuesday, dropping to its lowest level in three weeks. Currently, the price is hovering around 3,930 USD, down more than 50 USD from the start of the session and losing more than 140 USD compared to the same time yesterday. This downtrend is expected to continue.
Gold experienced a sharp decline during early trading on Monday in the U.S. after news that the U.S. and China are close to reaching a major trade deal. This could ease economic risks and geopolitical tensions, factors that previously drove gold to a record high of 4,380 USD/ounce last week. Additionally, the drop is also due to technical selling below the psychological 4,000 USD level.
As mentioned in previous analyses, once the 4,000 USD psychological level was broken, the buy strategy was no longer preferred. From a short-term technical standpoint, there are no signs of a bottom forming yet. If the selling continues, the next target will be the 3,850 - 3,835 USD range. However, for a safer approach, it’s better to wait for confirmation of a retracement before making further decisions.
What do you think about the XAUUSD trend? 💬Feel free to share your thoughts!

XAU/USD : Gold Breaks $4,000 Support – Can Bulls Hold the Line?By analyzing the Gold (XAUUSD) chart on the 2-hour timeframe, we can see that after rising to $4,138 and entering the marked supply zone, gold faced strong selling pressure and continued to drop, finally breaking below the $4,000 support and reaching $3,971.
As shown on the chart, this area is a key demand zone, and we expected a reaction here.
If gold manages to hold above the current level, we could see a short-term bounce toward $4,015. This analysis will be updated soon!
Please support me with your likes and comments to motivate me to share more analysis with you and share your opinion about the possible trend of this chart with me !
Best Regards , Arman Shaban

GOLD 1H CHART ROUTE MAP UPDATE & TRADING PLAN FOR THE WEEKHey Everyone,
Please see our updated 1h chart levels and targets for the coming week.
We are seeing price play between two weighted levels with a gap above at 4134 and a gap below at 4090. We will need to see ema5 cross and lock on either weighted level to determine the next range.
We will see levels tested side by side until one of the weighted levels break and lock to confirm direction for the next range.
We will keep the above in mind when taking buys from dips. Our updated levels and weighted levels will allow us to track the movement down and then catch bounces up.
We will continue to buy dips using our support levels taking 20 to 40 pips. As stated before each of our level structures give 20 to 40 pip bounces, which is enough for a nice entry and exit. If you back test the levels we shared every week for the past 24 months, you can see how effectively they were used to trade with or against short/mid term swings and trends.
The swing range give bigger bounces then our weighted levels that's the difference between weighted levels and swing ranges.
BULLISH TARGET
4134
EMA5 CROSS AND LOCK ABOVE 4134 WILL OPEN THE FOLLOWING BULLISH TARGETS
4174
EMA5 CROSS AND LOCK ABOVE 4174 WILL OPEN THE FOLLOWING BULLISH TARGET
4236
EMA5 CROSS AND LOCK ABOVE 4236 WILL OPEN THE FOLLOWING BULLISH TARGET
4288
EMA5 CROSS AND LOCK ABOVE 4288 WILL OPEN THE FOLLOWING BULLISH TARGET
4331
EMA5 CROSS AND LOCK ABOVE 4331 WILL OPEN THE FOLLOWING BULLISH TARGET
4360
BEARISH TARGETS
4090
EMA5 CROSS AND LOCK BELOW 4090 WILL OPEN THE FOLLOWING BEARISH TARGET
4042
EMA5 CROSS AND LOCK BELOW 4042 WILL OPEN THE SWING RANGE
4122
4075
EMA5 CROSS AND LOCK BELOW 4075 WILL OPEN THE SECONDAARY SWING RANGE
3987
3939
As always, we will keep you all updated with regular updates throughout the week and how we manage the active ideas and setups. Thank you all for your likes, comments and follows, we really appreciate it!
Mr Gold
GoldViewFX

Fomc Xauuusd quick buy Gold (XAU/USD) is showing bullish momentum after FOMC news, bouncing from support around 3951. Price targets are set near 4153 and the long-term target at 4376. A breakout above resistance could trigger a strong upward move.

Gold Rebound SetupGold (XAU/USD) is testing the support trend line around 4030. If it holds, price may rebound toward resistance levels at 4160 and 4236, with a potential target near 4370. A break below the trend line could indicate further downside pressure.

Latest Gold Price Update Today – The Downtrend Isn’t Over Yet👋Hello everyone , great to see you again — let’s take a look at OANDA:XAUUSD !
From a fundamental perspective, gold remains range-bound as the US dollar (USD) shows a strong recovery following remarks from Fed Chair Jerome Powell during Wednesday’s press conference.
On the technical chart, gold has formed a clear Double Top pattern on the 4H timeframe, breaking its previous bullish structure and confirming a Change of Character (CHOCH) from an uptrend to a downtrend. Additionally, the EMA 34 and EMA 89 have crossed downward, reinforcing the short-term bearish signal.
For now, the immediate support zone sits around the psychological level of $3,900. If this level is broken, I expect another Break of Structure (BOS) to follow.
What about you — do you think gold will rebound from this support zone or continue falling in the coming sessions? 💬 I’d love to hear your thoughts in the comments!

Gold Preparing to Continue Its Bullish Move After ConsolidationHello traders, I want share with you my opinion about Gold. Gold has maintained a strong bullish structure over the recent period, forming a clear ascending channel that has been respected multiple times. Each correction has been followed by strong bullish impulses, confirming that buyers remain in control of the long-term direction. After reaching the 4,368 Resistance Level — which coincides with the upper boundary of the channel — the market entered a range phase, signaling consolidation after an extended rally. The current price action has formed a secondary support zone near 4,050 – 4,080, also aligned with the ascending support line of the broader channel. Currently, the price is moving inside a range structure (Buyer Zone to Seller Zone), consolidating just above the main ascending support line. In my opinion, this area represents a critical accumulation zone, where buyers are likely preparing for another upward push. I expect that after testing the Buyer Zone, the price will find strong support and initiate a new bullish wave toward the Seller Zone and the Resistance Level at 4,368. A confirmed breakout above the resistance line of the local descending structure would validate this bullish continuation scenario. Please share this idea with your friends and click Boost 🚀

What Do Global Experts Say About the XAUUSD Trend?👋Hello everyone , great to see you again! Let’s take a closer look at OANDA:XAUUSD today.
At the start of this new trading week, gold is showing a mild pullback, trading around $4,070 — down more than $44 at the time of writing.
In the short term, many Wall Street analysts are leaning toward a sideways or bearish outlook for gold. Among them, Jim Wyckoff, a veteran analyst at Kitco, predicts that gold will remain volatile with a downside bias this week:
“Large swings are pushing both buyers and sellers out of the market in the same session. When speculators retreat due to risk aversion, the trend often tilts lower.”
However, he also emphasizes that medium- to long-term support for gold remains intact. The U.S. government shutdown has now extended into its fourth week, and the lack of key economic data is adding to uncertainty — a backdrop where gold continues to serve as a safe-haven asset.
From my personal perspective, gold currently appears to be moving sideways and entering a phase of accumulation. The metal market looks somewhat exhausted after multiple strong rallies, and many traders seem to be waiting for a deeper correction before re-entering. The key support zone to watch lies around $4,030–$4,000 . If this level breaks, I would avoid buying immediately and wait for a more stable setup to emerge.
What about you — how do you see the gold trend unfolding next?
💬Share your thoughts in the comments below, and good luck with your trades!

GOLD (XAU/USD): Supply Zone Detected - Selling Now is HIGH RISKGold is retesting a key supply zone, which aligns with a recently violated horizontal support cluster and a rising trend line.
⚠️ HOWEVER —there’s a strong possibility that traders may aggressively sell, expecting a deeper bearish move.
For now, the price nicely respected the 3900 psychological support
that previously was a resistance.
Given the current setup, it’s best to avoid initiating short positions today.
Let’s hold off until the Fed Rate Decision announcement and observe how the market responds.

Lingrid | GOLD Weekly Support Zone: Short Term Upside MoveOANDA:XAUUSD is approaching the weekly support area near 3,880, suggesting a short-term bullish impulse might be formed within the downward channel. Price action now moved below the 4,050, which aligns with prior breakdown structure and acts as a potential resistance level. As long as price sustains above 3,880, buyers may push toward 4,050 before meeting stronger resistance. Potential rejection near the lower channel boundary may hint at a corrective recovery phase gaining traction.
⚠️ Risks:
Federal Funds Rate decision on could reignite bearish momentum.
Rising Treasury yields may suppress gold’s short-term recovery potential.
Failure to hold above 3,880 would invalidate the short-term bullish scenario.
If this idea resonates with you or you have your own opinion, traders, hit the comments. I’m excited to read your thoughts!

XAU/USD | Gold Fills Liquidity Gap – Another Drop Below $3,900?By analyzing the #Gold chart on the 2-hour timeframe, we can see that after reaching the $3,915 demand zone, price reacted strongly and began to rise, filling the liquidity gap created by last night’s drop. Gold is currently trading around $3,973, and if it fails to hold above $4,015, we could see another strong bearish move toward lower levels below $3,900. The next short-term bearish targets are $3,955, $3,947, $3,915, and $3,899.
Please support me with your likes and comments to motivate me to share more analysis with you and share your opinion about the possible trend of this chart with me !
Best Regards , Arman Shaban

Lingrid | GOLD Weekly Price Analysis: Parabolic Pause or Peak?OANDA:XAUUSD experienced significant turbulence this week, initially pushing higher before encountering firm resistance and subsequently breaking down sharply toward the critical $4,000 psychological support level. This aggressive pullback, fueled by rising volume, signals a potential exhaustion of the parabolic rally seen in recent weeks. A move toward $3,900 is not a collapse, but a necessary, healthy correction — allowing momentum to reset and positioning the market for a sustainable next leg higher.
The 4H chart shows that after an explosive run into the all-time high zone near $4,380, price met fierce resistance. The subsequent drop formed a textbook corrective channel, confirming the market’s need to digest gains. What we should watch most closely? The upward trendline remains intact, acting as a dynamic support level. As long as price holds above this upward trendline and the broader upward channel, the primary uptrend remains alive. A break below $3,900 would be a red flag; a bounce from there could ignite a powerful retest of the ATH zone.
Zooming into the 1H chart, we see the formation of a classic double top pattern at the resistance area, followed by a decisive breakdown. This bearish signal was quickly countered by a strong rebound, now forming an ascending triangle. This pattern is inherently bullish — it represents consolidation before a breakout. The key trigger? A decisive close above the triangle’s upper resistance line would confirm the continuation of the bullish trend and likely propel gold toward new highs, targeting the $4,400 level.
In essence, gold is not broken — it’s breathing. The market is resetting its momentum, and the technical structure still favors the bulls. We should watch the $3,900 - $4,000 support and the ascending triangle breakout like a hawk. The next move could be explosive.
If this idea resonates with you or you have your own opinion, traders, hit the comments. I’m excited to read your thoughts!

GOLD - Stop Trading Gold For NowGOLD - Stop Trading Gold For Now
For now, stay away from gold. I just see that something strange is happening and the reason is just some manipulation and nothing more.
Below is what I am reading, but it doesn't make sense:
💬A thaw in US-China trade relations has kind of pulled the rug out from under the gold price due to a drop in safe-haven buying flows,"
I would suggest to stay away from gold for a while and see what happens first.
⚠️It could be a bull trap and it could fall lower or it could be a bear trap and it could rise aggressively again. It's all happening for no apparent reason.
For the time being gold is positioned like it can drop more but I don't believe it too much
At the moment we have no confirmation on how it could take shape but it is back around a strong area and the psychological price is 3900 - 4000.
You may find more details in the chart!
Thank you and Good Luck!
❤️PS: Please support with a like or comment if you find this analysis useful for your trading day❤️

XAUUSD: Healthy Pullback or the Start of a Downtrend?👋Hello everyone! What do you think about the current trend of OANDA:XAUUSD ?
Looking at last week’s movement, gold experienced a pullback after nine consecutive weeks of gains. By the end of Friday’s session, price action remained relatively calm, consolidating around the $4115 area while maintaining the psychological support near $4000.
From a technical perspective, it’s still too early to conclude whether this marks the beginning of a bearish trend or just a temporary correction. However, in the short term, from my view — and that of many others — this looks more like a healthy correction than a full trend reversal.
The fundamental reasons supporting gold’s strength haven’t disappeared. The U.S. government shutdown continues, meaning we’re not receiving key economic data — increasing overall uncertainty. Meanwhile, central banks like Russia and China keep accumulating gold aggressively, and ongoing geopolitical tensions surrounding the war in Ukraine continue to support gold as a safe-haven asset.
Technically, after forming a double top, gold has entered an accumulation phase, potentially setting up for a new bullish structure. If price can break above the current resistance zone, it could open the door for a strong upward continuation.
And you — what’s your view on the future of this precious metal? 💬 Share your thoughts in the comments below!

Lingrid | GOLD Post Rate Decision Market ResponseOANDA:XAUUSD has rebounded from the lower boundary of the upward channel, maintaining structure support above $3,900. Price action shows a higher low forming after a wedge correction, hinting at renewed bullish pressure. A sustained hold above the $3,905–$3,950 zone could pave the way for a move toward $4,135. Momentum remains positive as buyers defend key support within the broader ascending structure.
⚠️ Risks:
Stronger U.S. dollar amid higher Treasury yields.
Unexpected hawkish tone from Federal Reserve policymakers.
Break below $3,900 invalidating short-term bullish outlook.
If this idea resonates with you or you have your own opinion, traders, hit the comments. I’m excited to read your thoughts!

GOLD → Consolidation. The fundamental backdrop is changing...FX:XAUUSD stabilizes after a week-long decline, failing to consolidate above $4050. The market is taking a pause before new impulses. Focus on 4030 and 3980...
Investors are closing positions before the end of the week and month, the reason being the uncertainty surrounding the deal with China and Powell's less dovish stance on policy: a 25 bp rate cut is already priced in. The probability of a December cut has fallen to 72.8% (from 91.1% a week ago). Powell emphasized that decisions depend on data, which is not available due to the shutdown.
The strong dollar (2-month highs) is putting pressure on gold. Weak data from China (PMI fell to 49.0) is reducing demand from the largest consumer.
The balance is tipping towards weak fundamentals...
Resistance levels: 4030, 4085
Support levels: 3982, 3955, 3915
Technically, bears are keeping the market below 4030 - strong resistance. If buyers enter the market (there are currently no fundamental reasons for this) and the bulls are able to break through 4030 and keep the price above this level, we will have a chance for growth. But under the current circumstances, I expect a correction to support before a possible rise.
Best regards, R. Linda!

Gold Tests Critical Support as Sellers DominateHello everyone, after the sharp decline late last week, gold (XAU/USD) continues to face selling pressure and is currently trading around $3,977, down more than 3% in just two sessions. This is the strongest correction in the past three weeks and has put the market into a defensive phase as price approaches the key psychological support zone at $4,000.
Observing the chart, we can see selling momentum is slowing as price nears the lower Fair Value Gap (FVG) at $3,950 – $3,970. This is an unfinished liquidity zone as well as an important technical support area where buyers may attempt a short-term reaction.
The scenario I favour at the moment is a liquidity sweep toward the $3,950 – $3,970 area before a technical rebound takes place. The nearest resistance to watch lies at $4,100 – $4,200, where multiple FVG clusters and potential selling pressure exist.

XAUUSD-seeking $4,000 region?As my H4 chart shows, gold did make a double top a few days ago and then crashed. You can give credit for this massive 3,800 points move to profit taking or economic uncertainty or any technical reason, maybe a combination but it really does not matter.
What does matter is that we now have a double or triple top indicating that we have more room to the down side. I am seeing a medium term bearish move followed by a consolidation and now it may be that we will get a breakout (to the down side) to give us a bearish continuation.
How far will we go? I have no idea but the round number 4,000 followed by 3,950 do make sense. If all this works out as I anticipate, it may be a good idea to close a partial position, move the stop to a level of small profit and then trail the price action.

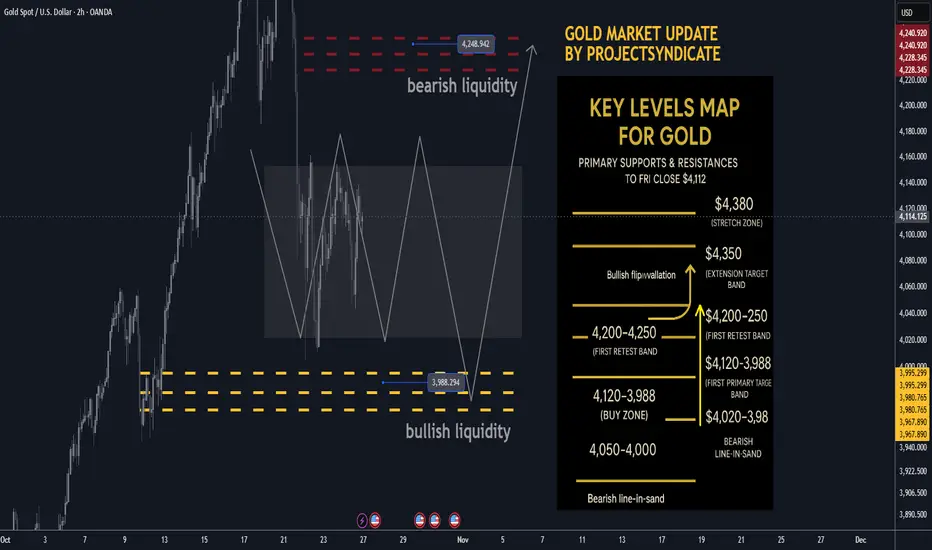
Gold next week Key S/R Levels and Outlook for Traders🔥 GOLD WEEKLY SNAPSHOT — BY PROJECTSYNDICATE
🏆 High/Close: $4,380 → ~$4,112 — lower close within range; momentum cooled but holding the $4,000 handle.
📈 Trend: Uptrend intact > $4,000; oversold into $4.1k—setup favors reflex bounce.
🛡 Supports: $4,120–$4,080 → $4,020–$3,988 (bullish liquidity) → $4,000/3,980 must hold.
🚧 Resistances: $4,200 / $4,250 (bearish liquidity) / $4,300 → stretch $4,350–$4,380.
🧭 Bias next week: Buy-the-dip $4,020–$3,988; momentum regain above $4,200 targets $4,250 → $4,300–$4,350. Invalidation < $3,980 risks a deeper flush to $3,950.
🌍 Macro tailwinds:
• Policy: Easing real yields supportive on dips.
• FX: Softer USD tone = constructive backdrop.
• Flows: Central-bank buying + tactical ETF interest underpin $4k.
• Geopolitics: Trade/tariff & regional tensions keep safety bids alive.
🎯 Street view: Select houses still float $5,000/oz by 2026 on policy easing & reserve-diversification narratives.
________________________________________
🔝 Key Resistance Zones
• $4,200–$4,230 immediate supply from the weekly close
• $4,250 bearish liquidity / primary target
• $4,300–$4,350 extension band
• $4,380 prior spike high / stretch
🛡 Support Zones
• $4,120–$4,080 first retest band below close
• $4,020–$3,988 buy zone (bullish liquidity)
• $4,000 / $3,980 must-hold shelf
________________________________________
⚖️ Base Case Scenario
Expect pullbacks into $4,120–$4,080 and $4,020–$3,988 to attract buyers, rotating price back toward $4,200 then $4,250. Acceptance above $4,250 invites a drive into $4,300–$4,350.
🚀 Breakout Trigger
A sustained push/acceptance > ~$4,250 unlocks $4,300 → $4,350, with room toward $4,380 if momentum persists.
💡 Market Drivers
• Real-yield drift lower (supportive carry backdrop)
• USD softness aiding metals
• Ongoing CB accumulation; ETF flows stabilizing on dips
• Headline risk (trade/geopolitics) sustaining safe-haven demand
🔓 Bull / Bear Trigger Lines
• Bullish above: $4,020–$4,100 (buyers defend pullbacks)
• Bearish below: $3,980 (risk expands; threatens $3,950)
🧭 Strategy
Buy low from bullish liquidity (~$3,988) with a target at $4,250; oversold conditions favor a strong bounce. Add on strength above $4,200 toward $4,300–$4,350. Keep risk tight below $3,980–$4,000 to invalidate.
Gold Market Update: Correction Mode 3750/3500 USD possible🟡 Where We Are Right now
After ripping to fresh records, gold snapped hard — WSJ logged the steepest one-day loss in years last week and a follow-through weekly drop as longs unwound.
Analysts across Kitco and others frame this as a technical/positioning correction after a parabolic run, with a fight around the $4k handle and scope to probe $3,750 → $3,500 if selling persists.
Sentiment/flows flipped: GLD and other gold ETFs saw notable outflows into the selloff after heavy YTD inflows. That flow reversal is consistent with a near-term correction phase.
🔻 Why the Market Is Correcting Now
1️⃣ Positioning & Froth Unwinds
The rally attracted outsized speculative length; once momentum cracked, forced de-risking kicked in. WSJ called out “long unwind” dynamics; Kitco says the correction could persist for months as near-term drivers fade.
2️⃣ $4k Failed on First Retest; Technical Break Triggered Stops
Kitco flagged a “fight for $4k” with downside risk if that shelf gives. Once sub-4k prints hit, systematic sellers likely accelerated.
3️⃣ Flow Flip in ETFs
After massive 2025 inflows, GLD posted a sharp daily outflow during the drop — classic late-cycle reversal behavior for a momentum move.
4️⃣ Macro Balance Less Supportive at the Margin
Even with long-term tailwinds (deficits/geopolitics), the recent leg higher ran ahead of fundamentals. Kitco and others note easing physical tightness and cooling central-bank buying pace compared with earlier in the year, removing a key prop for spot.
⚙️ Near-Term Levels That Matter (Tactical)
$4,000 → Battle zone. Regaining and holding above turns near-term tone neutral.
$3,750 → First meaningful downside target; aligns with multiple analysts’ “healthy pullback” zone.
$3,500 → Deeper correction magnet if flows/positioning continue to bleed; widely discussed as a plausible washout level.
🔮 4–8 Week Catalyst Map (What Can Push Price)
🏛️ Macro / Policy
Treasury Quarterly Refunding (Nov 5): Mix/size guidance can sway the long-end, USD, and real yields — key for gold. A heavier bill tilt (and steady coupons) is less threatening than a surprise coupon ramp.
Fed Communication Cadence: With the Oct 28–29 FOMC just occurred, watch minutes (Nov 19) + any guidance shifts. A less-dovish tone or firmer real yields = near-term headwind; growth scares or easing bias = support.
US Data Prints: CPI/PCE, NFP, ISM — anything that re-prices the path of real rates. (Direction of real yields remains the single most important macro input.)
💰 Flows & Positioning
ETF Flows (GLD/IAU): Continued outflows would confirm distribution; a turn back to net inflows often leads price inflections.
COT Positioning: If spec length compresses materially, downside fuel diminishes — setting up a cleaner base. (Track weekly CFTC updates.)
🪙 Physical / Seasonal
India Demand (festive/wedding season) and China retail demand can stabilize spot if discounts narrow and premiums re-emerge, but Kitco notes near-term tightness has eased versus the squeeze earlier in the rally.
📈 Base Case Outlook (Next 4–8 Weeks)
Trend: We’re in a bull-market correction — momentum currently with sellers — inside a bigger, intact secular uptrend. WSJ + Kitco both frame it as a technical consolidation after a near-vertical ascent.
Range Expectation: $3,500–$4,100 with whipsaws around $4k. The market likely tests $3,750 and could overshoot to $3,500 on negative macro surprises or persistent outflows before attempting a higher-low base.
Bull Re-acceleration Triggers:
(a) USD/real-yield rollover post-Refunding/Fed minutes
(b) A visible reversal in ETF flows
(c) Stabilization in Asia physical premiums
(d) Fresh geopolitical shocks
Bear Extension Risks:
(a) Firmer real yields / stronger USD
(b) Deeper ETF outflows and CTA/systematic supply
(c) Evidence of slower central-bank demand than H1
(d) Soft physical uptake into dips
⚔️ Trade / Hedge Tactics
If Underweight/Flat:
Stagger bids $3,760 → $3,520, scale size smaller into weakness; insist on confirmation (stops above prior day’s high) before adding.
If Long From Higher:
Respect $3,750 — below it, tighten or partially hedge (short miners, long USD vs. FX beta, or buy short-dated puts) targeting $3,500 as a potential flush.
If Momentum Trader:
Let $4,000 decide regime. Sustained reclaims with rising on-balance volume/ETF creations = green light for a bounce to $4,080–$4,150; failure = fade rallies into $3,950–$3,980.
🧭 What I’m Watching Day-to-Day
1️⃣ Treasury refunding headlines (Nov 5) and term-premium reaction.
2️⃣ Fed minutes (Nov 19) and any shift in balance-of-risks language.
3️⃣ GLD/IAU flow tape (creations/redemptions).
4️⃣ Kitco/WSJ desk color on physical tightness and dealer inventories.

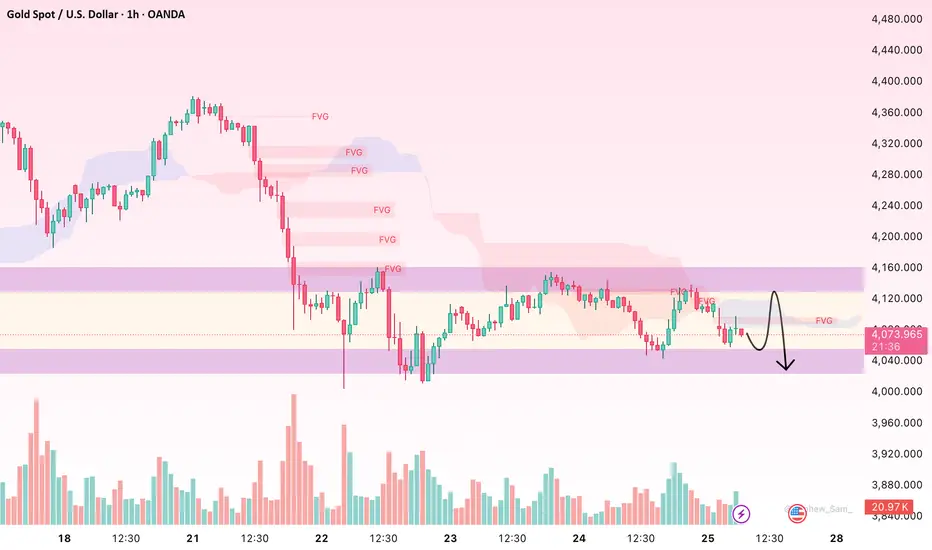
Gold consolidates after sharp decline – key levels aheadHello everyone, gold (XAU/USD) is trading around $4,080 after a drop of nearly 7.6% from the $4,380 peak. The decline has paused and the market has moved into a narrow consolidation zone between $4,050 – $4,120, reflecting cautious sentiment before choosing the next direction.
On the 1H chart, we can clearly see a series of Fair Value Gaps (FVG) still lying above price, especially around $4,110 – $4,160 and $4,240 – $4,280 – areas of liquidity that have not yet been reclaimed. However, price remains below the Ichimoku cloud, which means the dominant trend is still bearish. Selling pressure has cooled down, but buyers are not strong enough yet to trigger a confirmed reversal. Trading volume is gradually decreasing, showing that the market is waiting for a catalyst from macro news – consistent with the current environment as investors monitor US–China trade developments and upcoming US economic data.
Structurally, the current bounce appears more like a technical correction rather than a meaningful trend reversal. Gold could continue to recover toward $4,120 – $4,140 to fill nearby FVGs, but this is also a close resistance area where sellers are likely to reappear. If price gets rejected here, $4,040 – $4,000 becomes the next liquidity sweep target. And if $4,000 breaks, the bearish extension could reach $3,960 – $3,920 – a key H4 equilibrium zone where strong demand previously stepped in.
In the short term, I don’t see a sustainable bullish trend unless the Fed signals earlier-than-expected rate cuts or a major geopolitical shock re-ignites safe-haven demand. Without a strong catalyst, the most reasonable scenario is continued consolidation within the $4,000 – $4,200 range before the next major move develops.
What do you see here – technical recovery or a bull trap before the next leg down?
Why Is Gold Called the King of Assets?👋Hello everyone!
If you are an investor, you have probably heard the saying: “Gold is the king of assets.” But why gold? Why does gold always hold a special place in the financial markets and is considered a safe haven in all circumstances? Let’s explore why gold deserves this title and why it remains a favorite choice among millions of people around the world!
1.Gold Is the Guarantee of Safety
When the stock market plunges, when economies face crises, or when inflation erodes the value of currencies, gold is always the first choice of smart investors. While other assets can lose value quickly, gold tends to hold its worth — and can even rise. This is why gold is regarded as a “safe haven” in times of uncertainty.
Gold is not only favored by individual investors but also by governments and central banks around the world. They accumulate gold as a way to protect their nations’ economies from global financial shocks.
2.Gold: An Asset That Cannot Be Printed Like Money
There’s one thing we must understand clearly: gold has a limited supply. Unlike money, which can be printed at the discretion of central banks, the supply of gold is fixed and can only increase through mining — a costly and time-consuming process. This natural scarcity makes gold a sustainably valuable asset.
3.Gold Is a Symbol of History
Gold is not a new type of asset. It has been intertwined with human history for thousands of years. Since the dawn of civilization, gold has been used as a medium of exchange, a precious possession, and even as the foundation of global monetary systems. From ancient Egypt to the modern day, gold has always held a special place in society.
This gives gold a level of longevity that few other assets can match. When you own gold, you don’t just own a valuable physical item — you own a piece of history.
4.Gold Is Easily Convertible and Highly Liquid
Wherever you are in the world, gold can easily be converted into cash. Unlike most other assets, you can sell gold in almost any country and in nearly any circumstance without major restrictions. Therefore, gold is not only valuable but also highly liquid, allowing you to turn it into cash whenever you need it.
5.Gold Is a Tool to Diversify Risk
While stocks or bonds can fluctuate wildly and cause anxiety, gold can serve as a perfect diversification tool. Suppose you have investments in stocks or real estate — allocating a small portion of your portfolio to gold can help reduce risk during times of market turbulence. Gold helps you protect your wealth and maintain stability in an unpredictable world.
6.Gold: An Asset Anyone Can Own
Gold isn’t just for billionaires or big institutions. You don’t need a million-dollar account to own gold. With the rise of online gold trading and products such as small gold bars, jewelry, and even digital gold, anyone can own it conveniently and affordably.
7.Gold Never Goes Out of Style
One unique thing about gold is that its appeal never fades. Every time the price rises, more people rush to buy it. Gold isn’t just valued for its stability and ability to preserve wealth — it’s also a symbol of prosperity and success. A gold ring or a small bar of gold always carries a sense of pride for its owner.
With all these reasons, it’s no surprise that gold is called the “King of Assets.” It can protect you during tough times, provide opportunities for profit in uncertain markets, and remain timeless through generations. Whether you’re a seasoned investor or a beginner, gold will always be a valuable and worthy investment choice.
Would you like to become a billionaire — a true gold trading expert?
💬Share your thoughts about gold below, and don’t forget to hit that like button — it means a lot to me!
