XAUUSD (Bullish setup) 1 Hour time frame
Price is currently consolidating near support after a strong pullback. The chart suggests a potential bullish reversal setup — price may retest the lower zone around 4,205–4,170 before continuing upward toward the 4,360–4,400 resistance area.
Volume is decreasing, indicating seller exhaustion and possible buyer entry soon.
📈 Trade Idea: Wait for bullish confirmation near support for a potential long move toward the upper resistance zone.
🟢 Bias: Bullish reversal setup
⚠️ Invalidation: A clear break below 4,165 may shift structure bearish.
Trade ideas

Double Fakeout on GoldHi traders and investors!
This analysis is based on the Initiative Analysis (IA) concept.
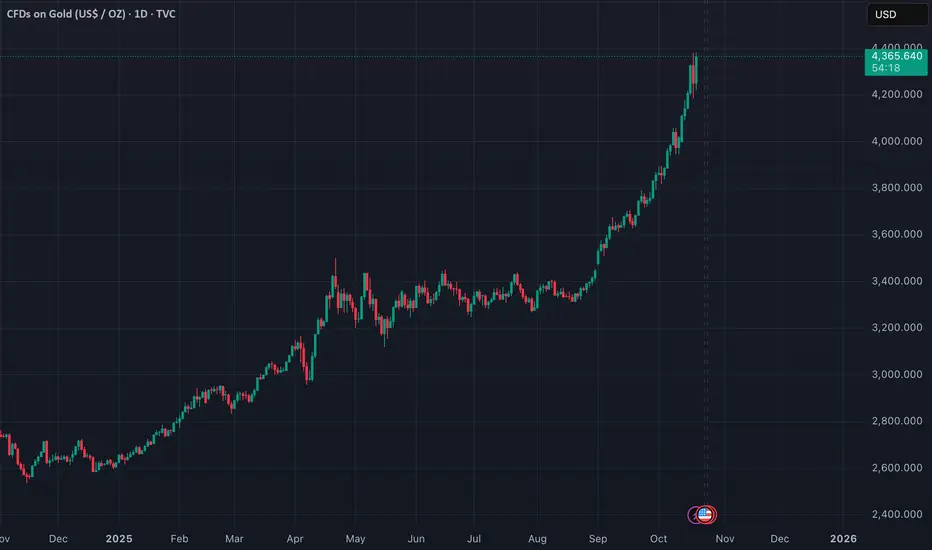
Gold has corrected by 6.5% from its peak and so far shows no signs of recovery.
On the 1-hour timeframe, the market is in a sideways range.
First, there was a false breakout below the lower boundary, and then a false breakout above the upper boundary of the range.
Now the seller has broken through the lower boundary of the sideways range, and the price has dropped below the 50% level of the daily buyer initiative.
At the base of the last buyer initiative on the daily timeframe, there is a buyer zone between 4058 and 3944 — a good area to look for potential trade setups.
Wishing you profitable trades!

gold view Gold is showing strong bullish momentum after completing a turtle soup reversal pattern. The breakout structure and rising volume confirm buyers are in control. I expect a continuation move targeting around 5000 pips in the coming week as the uptrend builds strength.

GOLD (XAU/USD) – FINAL GRAND CYCLE ANALYSIS🟡 GOLD (XAU/USD) – FINAL GRAND CYCLE ANALYSIS
"The Rise of Real Money in a Failing Fiat World"
Elliott Waves | Fibonacci | Smart Money | Macro Fundamentals | Market Structure
📆 Date: October 12, 2025
📈 Current Price: ~$4,017/oz
🕰️ Timeframe: 1950s – 2060+
🔍 Focus: Multi-decade forecast grounded in wave theory and fundamental macro shifts
🌐 SUPER CYCLE STRUCTURE – GOLD'S MONETARY EVOLUTION
🔵 Wave I (1971–1980): The Rebirth of Gold
Gold surged from ~$35 to ~$850 after the collapse of the Bretton Woods system.
Nixon ended USD-to-gold convertibility, exposing the world to pure fiat for the first time.
Geopolitical shocks like the OPEC oil embargo and soaring inflation shattered trust in paper money.
Gold reasserted itself as a monetary anchor , not just a commodity.
🔴 Wave II (1980–1999): The Great Rejection
A 19-year bear market saw gold bleed down to ~$250.
Volcker’s rate hikes tamed inflation; fiat regained trust temporarily.
The dollar surged, stocks soared, and central banks sold gold reserves.
This corrective wave reflected confidence in debt-based growth and fiat stability — a long, deceptive calm.
🟢 Wave III (1999–~2045?): The Real Money Renaissance
This is the main secular bull market wave , subdivided into five impulsive macro waves.
Gold is now in Wave iii of III — the most explosive, powerful phase — and will likely reprice in a way that reflects systemic risk, not just inflation.
📈 MACRO & MICRO STRUCTURE – CURRENT WAVE BREAKDOWN
🟢 Macro Wave I (1999–2011): The First Awakening
Gold rose from $250 to ~$1,920.
Triggered by the dot-com crash, 9/11, 2008 crisis, and early QE programs.
This was the smart money accumulation phase , when institutions quietly began hedging systemic risk.
🔴 Macro Wave II (2011–2015): The Disbelief Phase
Gold corrected 45% to ~$1,050.
Fed tapering, rising dollar, and low CPI caused a temporary return to confidence in fiat.
This reset investor sentiment and created institutional demand zones.
🟢 Macro Wave III (2015–~2026): The Fiat Reckoning (Now Unfolding)
Subdivided into five micro-waves:
Wave i (2015–2020): Broke out of 4-year base; fueled by Brexit, rate cuts, and China accumulation.
Wave ii (2020–2022): ABC pullback post-COVID; reloaded from key SMC demand zones.
Wave iii (2022–Now): We're here. Most vertical and extended move yet. Price currently at ~$4,000; next targets are $6,552, $22,744, and $78,940 , all aligning with Fibonacci extensions (2.618, 3.618, 4.618).
Wave iv (projected 2026–2031): Likely major correction after parabolic move.
Wave v (projected 2031–2045): Final blow-off top in Supercycle III.
🧠 FUNDAMENTAL DRIVERS – BY WAVE
🔹 Wave I Fundamentals (1999–2011):
Post-dot-com capital rotation.
9/11 and geopolitical tension.
2008 GFC and collapse of banking trust.
Introduction of QE and zero interest rates.
Gold ETFs (like GLD) launched, enabling broader exposure.
🔸 Wave II Fundamentals (2011–2015):
QE fatigue: “It didn’t cause inflation.”
USD strength.
Confidence returned to stocks.
Retail dumped gold — but central banks quietly accumulated .
🔹 Wave III Fundamentals (2015–2026):
$30+ trillion in global QE during COVID.
Global real rates deeply negative.
Energy crisis and supply chain fragility.
War-driven risk premiums (Russia-Ukraine, Middle East, China-Taiwan).
De-dollarization: BRICS accumulation, gold in cross-border settlements.
Institutional shift toward real assets as fiat credibility wanes.
🔸 Wave IV (Projected 2026–2031):
A likely correction tied to:
CBDC adoption and capital controls.
Temporary resurgence in tech or USD-based confidence.
Reforms that appear to restore fiscal sanity.
But this will be the last opportunity to enter before the endgame move.
🔹 Wave V (2031–2045+):
Fiat collapse becomes mainstream.
USD potentially dethroned.
Gold-backed CBDCs or DeFi hybrids launched.
Mass exodus from fiat into real money.
Final revaluation of gold to reflect not inflation, but lost confidence in the entire financial system.
📐 FIBONACCI EXTENSIONS – PRICE TARGETS WITH WAVE ALIGNMENT
🟢 Wave I topped at 1.618 Fib ($1,887) — aligned with 2011 ATH.
🟢 Wave III (in progress):
2.618 Fib: $6,552 (expected peak of wave iii).
3.618 Fib: $22,744 (potential macro Wave III top).
4.618 Fib: $78,940 (if confidence fully collapses).
🟢 Wave V (projected): May extend toward $100,000–$250,000+ under systemic collapse or gold-backed reset conditions.
All targets line up perfectly with logarithmic channel projections , Elliott wave extensions , and long-term order flow structure .
🧠 SMART MONEY CONCEPTS & PRICE ACTION CONFIRMATION
✅ BoS (Breaks of Structure) at each wave change validated bullish continuation (2016, 2020, 2023).
✅ Order Blocks and liquidity grabs created institutional entry zones — especially at 2018–2019 lows and 2022 dips.
✅ Demand zones respected across key Fibonacci retracements (0.382 and 0.618).
✅ Current wave iii is a textbook price discovery phase with minimal resistance.
This entire market structure is institutionally driven , not retail fueled — a true stealth bull.
📊 MARKET CYCLE PSYCHOLOGY OVERLAY
1999–2004: Disbelief – “Gold is dead.”
2005–2011: Awareness – “Gold might work.”
2011–2015: Denial – “It’s just a bubble.”
2016–2020: Hope – “Maybe gold’s not done.”
2022–2026: Euphoria – “Gold will never go down.”
2026–2033: Fear → Capitulation – Wave IV
2033–2045: Mania – “Gold to the moon!” — Wave V blow-off.
🚨 FINAL SYNTHESIS
We are witnessing the greatest revaluation of monetary value in modern history . Gold is transitioning from:
A hedge against inflation → to
A hedge against central banks → to
A hedge against the entire fiat system.
📌 Final Position Summary:
🔄 Current Location: Wave iii of III of Supercycle III
🎯 Immediate Target: $6,552 (2.618 Fib)
💡 Medium-Term: $22,744 (3.618 Fib)
🔥 Parabolic Scenario: $78,940 (4.618 Fib)
💀 Systemic Reset Target: $100,000–$250,000+
🧠 Conclusion:
This is not just a chart. This is a map of the collapse of fiat trust and the ascendance of sound money . Gold is no longer just an asset — it’s insurance on the system.
🌊 "Those who understand the waves will ride them. Those who don’t will be swallowed by the tide." - FIBCOS
📘 Disclaimer: This is a structural, educational market outlook. Not financial advice. Please do your own due diligence and risk management.
#XAUUSD #Gold #GoldAnalysis #ElliottWave #Fibonacci #SmartMoneyConcepts #PriceAction #TechnicalAnalysis #MarketStructure #Commodities #InflationHedge #MacroEconomics #CentralBanks #BRICS #MonetaryReset

GOLD Daily Plan (Oct 20, 2025) | Buy Setup from 4235–4225 Target🧭 DAILY TRADING PLAN – GOLD (XAU/USD)
Date: Oct 20, 2025
Main timeframe: M30 – H1
Strategy: SMC + Volume Profile + Fibo retracement
1. MARKET CONTEXT
After a sharp drop from 4370 → 4200, price formed a temporary bottom around 4179 and started building a corrective structure.
Currently, price is consolidating between 4240–4260, located near the Value Area Low of the previous session.
On the Volume Profile, the POC (Point of Control) from the prior session is around 4296, aligning with the Fibonacci 0.618 level — this is a major resistance zone and a good target area or reversal point.
2. MAIN SCENARIO (BUY SETUP)
Reason for entry:
Price is reacting from a small demand zone (4235–4225) with increasing volume, showing signs of absorption from buyers.
Trade plan:
Entry: 4235 – 4225
Stop Loss: 4218 (≈6–7 points)
Take Profit 1: 4288
Take Profit 2: 4296 (POC + Fibo 0.618 confluence)
Take Profit 3: 4316 (first supply zone on Chart 1)
Risk-to-Reward Ratio: around 1:2.5 to 1:3
3. ALTERNATIVE SCENARIO (SELL SETUP)
If price fails to hold above 4220 and breaks structure to the downside:
Entry: below 4215 after confirmation (CHoCH / BOS on M15)
Stop Loss: 4222
Take Profit: 4199 → 4179 (previous low & liquidity pool)
4. SUMMARY
→ Focus on the buy setup from 4235–4225 as long as price holds above 4218.
→ Be cautious taking longs near 4296–4316 (supply zone).
→ If bearish momentum returns, switch to the short scenario targeting 4199.

XAUUSD: Bearish Setup After Double Top & Neckline BreakI am now anticipating a pullback (retracement) back up to this broken neckline.
Potential Entry Zone (New Resistance): The former support level is expected to act as new resistance. This is a classic "Support Becomes Resistance" (S/R Flip) setup.
Target: If the price rejects this new resistance zone, I will be looking for a continuation of the bearish move. The next logical target would be the subsequent support level, which I have marked on the chart (around the $4,100 - $4,110 area).
Invalidation: This bearish idea would be invalidated if the price manages to reclaim the former neckline and close decisively above it.
As always, this is my personal analysis and not financial advice. Please conduct your own due diligence.
Good luck!

Regarding "catching the top" at all time highsWhen market conditions are as they are right now it is really tempting to try and predict the top. But please don't and here is why.
If you'd look at the gold chart right now you'd see that it has been running up all year long with a slight consolidation in the summer. At any moment this year it could have been "the top", but it wasn't. What I am pointing at is that the R:R of predicting the top when you are at the all time highs is unfavourable to say the least. Even if you would've been able to predict a throwback it would've been minor when comparing with the whole of the swing.
Now technical analysis is great and all but at all times in history there were some assets that were absolutely sentiment driven and you can squiggle what ever lines you want on that pretty colourful chart. It will not help you but give you false expectations of cracking the matrix. Market sentiment is like rabies - nobody knows whats going on and then sudden death. Now we have precious metals booming, it was A.I. before that, and EV's before that, and tech before that and so on and on and on. So when you're doing TA on a sentiment driven asset that is currently at all time highs it is only natural that the only thing you will look for is the top and in such matter you will become liquidity.
When what ever you are looking at is in price discovery mode you literally have no price history to look at. So tell me? What is you point of reference? People who work with fundamentals here have a greater edge because they don't even need to look at the chart to understand that we are in a territory that is volatile and pricing in a premium, but when you don't see the sticks forming you don't think about tops, you play the waiting game. Of course at some point in time the price will drop, but it will not be because of a fibonacci projection or a double top, or any other kind of TA pattern, at least not in this sentiment driven asset like gold. It will be because of two things - smart money exiting their positions and a change in sentiment. And for both of these to happen you need news and macro events to stir up the pot and to have someone or something to blame for the dips that are yet to come.
All in all, regarding "catching the top" - don't. It is gambling unless you have many and many years of experience trading in the markets at all time highs and probably the people that do have the so much needed experience will agree with me.
Trade smart, don't be liquidity.
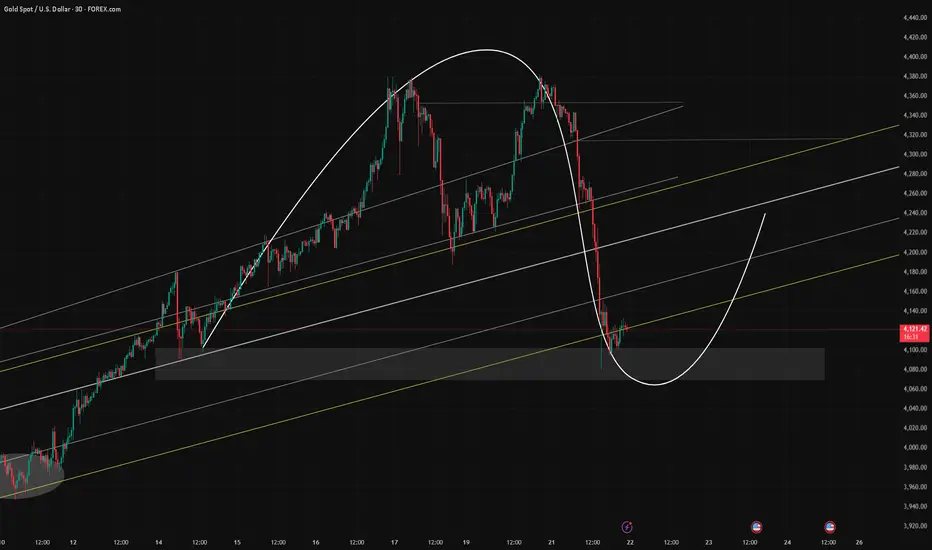
Gold Price Analysis – October 21, 2025Gold Price Analysis – October 21, 2025 | Key Zones & Potential Reversal Setup
Gold (XAU/USD) remains in a dominant bullish trend but is currently undergoing a corrective phase within its uptrend channel. On the H1 timeframe, the market has recently formed a double-bottom pattern, signaling potential exhaustion from sellers and a possible short-term reversal.
Technical Overview
Trend Direction: Bullish (still above the long-term ascending trendline)
Immediate Support Zone: 4,260 – 4,270
Demand Zone: 4,185 – 4,200 (confluence with previous base structure)
Resistance Levels: 4,300 – 4,320 and 4,340 – 4,360
Market Context: After a sharp correction from the recent high, gold is now retesting a key support area where a bounce could trigger a new bullish leg.
Pattern Insight
The “W” reversal structure (double bottom) on the chart suggests that buying pressure may be returning. A confirmed breakout above 4,304 could validate a bullish continuation, targeting the 4,340 – 4,360 region.
Trading Plan
Primary Scenario – Buy on Confirmation:
Wait for price to reclaim 4,300–4,304 with bullish candle confirmation.
Entry: 4,304
Target: 4,340 → 4,360
Stop Loss: Below 4,185
Alternative Scenario – Deeper Pullback:
If price fails to hold 4,260, a deeper retracement toward 4,185 could occur before the next impulse wave resumes.
Outlook
Overall momentum remains bullish as long as gold stays above the long-term trendline. The correction phase could soon give way to another upward expansion, provided the market maintains structure above 4,185.
Stay alert for confirmation signals before entering new long positions.
Follow for more daily gold insights and high-probability setups.


G0LD BREAKS HIGHER BULLISH MOMENTUM TARGERT $4200Gold (XAU/USD) is currently trading around $4,146, continuing its bullish trajectory within a well-defined ascending channel on the 45-minute chart. The price action shows consistent higher highs and higher lows, confirming a strong uptrend.
🔍 Key Observations:
Trend: Clear bullish trend as price respects the channel boundaries, with momentum increasing after each pullback.
Support Zone: Around $4,000 – $4,050, aligning with the lower boundary of the channel — a key area to watch for potential buying interest.
Resistance Zone: Near $4,180 – $4,200, where the price may face short-term selling pressure or consolidation.
Momentum: Price is riding the upper half of the channel, indicating strong bullish sentiment and potential for continuation toward new highs.
Volume/Momentum Indicator (implied): The consistent upward slope suggests sustained buyer strength with limited correction depth.
📈 Outlook:
If gold sustains above $4,100, bulls could target $4,200 – $4,250 next.
A break below $4,080 (channel support) might signal a short-term correction toward $4,000, but the overall bias remains bullish unless the lower trendline is decisively broken.
🧭 Summary:
Bias: Bullish
Immediate Target: $4,200
Support: $4,000 – $4,050
Resistance: $4,180 – $4,250

Gold Fundamentals | Smart Money Buy Zones (10/21/2025)BELOW IS DETAILED ANALYSIS ON GOLD (10/21/2025)
Central Bank Buying Surge 🏦
Central banks, especially from BRICS nations, added 77% more gold reserves in 2025, hitting record highs and pushing prices up amid de-dollarization fears.
🥇 Silver benefits indirectly as industrial demand grows 17% YoY from solar and EVs.
This trend could add $200-300/oz to gold by year-end.
ETF Inflows Hit $41B 📈💸
Gold ETFs saw $38B inflows in H1 2025, strongest since 2020, while silver ETFs added $3.6B (95M oz).
This reflects retail and institutional flight to safety, but overbought RSI warns of 5-10% pullback risk soon ⚠️.
Silver Deficit Deepens ⚙️🥈
Cumulative silver deficit reached 750M oz over 4 years (75% of annual supply), driven by booming industrial use in renewables.
Expect prices to test $55+ if deficits persist into 2026 💥.
Latest Tweets from Key Figures Impacting Gold/Silver 🐦
Influencers warn Trump’s tariffs could spike silver to $60 on supply chain chaos.
highlights Fed dovishness fueling $4,300 gold breakouts amid trade war fears.
Option Inflows💬📊
SLV open interest peaks at Oct 17/Nov 21 expiries, with put IV at 62.9% vs call 53.8% at $46 strike showing downside hedge bets amid tariff buzz.
Net bullish $36M call premium at $49-50 strikes signals $55 targets if squeeze hits 🚀.
Latest Geopolitical Events 🌎🔥
US-China tensions escalate with new export controls on rare earths and batteries, driving safe-haven buys
gold tops $4,300, silver $54.
Russia-Ukraine stalemate and Middle East flares add volatility,
but BRICS de-dollarization supports long-term uptrend 🏦.
Latest Fundamentals 📊💵
Gold up 58% YTD on inflation hedges and $38B ETF inflows;
silver surges 79% from 1B oz supply deficit and 17% industrial demand growth.
Fed rate cuts lower holding costs, targeting gold $4,400 and silver $57 by mid-2026 🎯.
Current Prices (as of Oct 21, 2025) ⏰💰
Gold spot: $4,362 USD/oz, up 0.10% today and 16.41% monthly.
Silver spot: $51.20 USD/oz, down 5.6% from $54.47 record but up 74% YTD.
Conclusion 💎
Gold and silver are in a strong bull run, fueled by trade wars, Fed easing, and supply shortages ideal for safe-haven plays.

Gold Ready for continue growth Target 4152 / 4180Gold prices remain elevated, with a key resistance area forming near 4,190. From this zone, a potential short-term correction could occur, possibly pushing prices toward 4,090, forming an intermediate bottom.
Expectations of two U.S. Federal Reserve rate cuts before year-end continue to support gold prices. Meanwhile, the ongoing U.S. government shutdown has increased demand for safe-haven assets, further underpinning gold’s strength.
Technical Outlook:
The bullish pattern in gold remains intact despite recent price declines. After the pullback, prices are showing signs of recovery, suggesting a possible continuation of the uptrend.
If the price breaks above 4,142, we could see further bullish momentum toward the 4,152–4,180 zone. However, if it fails to hold above 4115 / 4,100, the price may retest lower supports before resuming the upward trend.
You may Find more details in the chart.
Trade wisely best of Luck Buddies.
Ps; Support with like and comments for better analysis Thanks for Supporting.

Gold Outlook: Analysts Eye $5,000 as Tensions RiseHello everyone,
Gold continues to capture market attention as a new wave of geopolitical and trade tensions fuels safe-haven demand. The US–China dispute reignited after President Donald Trump announced a 100% tariff on Chinese imports and imposed export restrictions on key software technologies. Beijing responded by tightening rare earth exports, raising fears of a supply shock for the tech industry. This chain of events pushed investors back toward gold, seeking shelter from global uncertainty.
On the macro front, Bank of America has revised its 2026 gold forecast upward to $5,000 per ounce, citing sustained central bank purchases and the likelihood of renewed ETF inflows once the Fed begins rate cuts. These expectations underline gold’s enduring role as the ultimate safe-haven asset.
Technically, gold has broken above the 4,100 USD resistance zone, currently trading near 4,130 USD, signalling that buyers remain in firm control. The 4,100–4,120 USD Fair Value Gap now acts as short-term support, while Ichimoku dynamics reinforce the bullish bias. Should this momentum persist, a move toward 4,200 USD seems plausible in the near term.
Still, some profit-taking could emerge around that level, possibly triggering a pullback toward 4,100 USD before the next leg higher. For patient traders, such retracements might offer ideal “buy-the-dip” opportunities.
What about you — do you see gold pushing through 4,200 soon, or taking a breather first?

XAUUSD NEW OUTLOOK According to H1 analysis gold market continuously running in fly pressure from last couple of hours now market will be go more buy and touch the RESISTANCE LEVEL and it will falling and so if you are interested then go short from here is best of you
dont be greedy use money management
TRADE AT YOUR OWN RISK
REGARD ALBERT

Gold key Levels (4200$ - 4500$)All previous upside levels up to $4300 have been successfully reached (100% Winrate). Below are the next target levels up to $4500.
Trading Strategy:
- If a candle closes above any of these levels, enter a buy position.
- If a candle closes below any level, enter a sell position.
- In case of a rejection at any level, wait for the next candle to close above or below the rejection candle before taking a position.

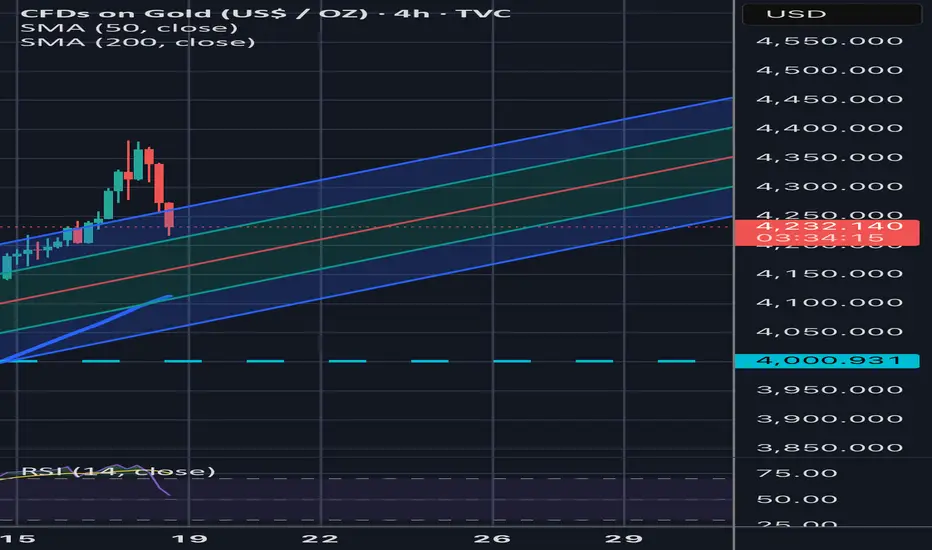
Gold (XAU/USD), 4H timeframe..Gold (XAU/USD), 4H timeframe — here’s what the technical setup indicates:
Current price: around $4,107
Structure: Rising channel (uptrend), but price recently rejected the upper boundary.
Indicators: There’s a clear blue arrow pointing downward, suggesting a short-term correction.
Support zones:
First near $4,050 – $4,030 (mid-channel support)
Second near $4,000 – $3,995 (cloud & lower trendline support — also marked “Target Point” on my chart)
✅ Short-term Target: $4,000 – $3,995
If the bearish momentum continues, it might test the lower edge of the Ichimoku cloud near $3,975.
⚠ Invalidation:
If price closes above $4,145, the bearish correction setup fails and the bullish channel continues.
So, my target zone = $4,000 ±10.

Markets Brace for U.S. Retail Sales & Fed VolatilityXAUUSD – Intraday Trading Plan | by Ryan_TitanTrader
📈 Market Context
Gold prices hover near $4,190 after an early-week rally as traders brace for U.S. Retail Sales data and a new round of Federal Reserve speeches later today.
Recent gains were fueled by softer inflation readings, yet the dollar remains resilient amid hawkish undertones from Fed officials. Markets are now balancing between expectations of slower growth and persistent rate-cut caution.
A stronger-than-expected Retail Sales print could pressure gold temporarily, but any dovish signal from Fed speakers may quickly restore bullish momentum. Expect liquidity hunts on both sides before a confirmed direction forms.
🔎 Technical Analysis (1H / SMC Style)
• Structure remains bullish after multiple Breaks of Structure (BOS) and a recent Change of Character (ChoCH) confirmation.
• Price is approaching the Premium Zone (4211–4209) — a potential liquidity sweep area where short-term sellers may react.
• Below, the H1 FVG Buy Zone (4145–4149) offers a discount entry aligned with recent BOS support and previous mitigation points.
• Maintaining a bullish bias while awaiting clean reaction within the FVG zone is key for continuation toward new highs.
🔴 Sell Setup: 4211 – 4209
SL: 4218
TP targets: 4190 → 4175 → 4155
🟢 Buy Setup: 4145 – 4147
SL: 4138
TP targets: 4170 → 4190 → 4220+
⚠️ Risk Management Tips
• Wait for M15 ChoCH/BOS confirmation before entry to avoid false breaks.
• Expect high volatility around Retail Sales and Fed remarks — spread widening is likely.
• Partial take-profits near intra-day liquidity points are recommended.
✅ Summary
XAUUSD remains bullish on structure but faces a potential liquidity grab around 4211–4209 before retracing into the H1 FVG buy zone (4145–4149).
Smart money may seek to accumulate long positions after a controlled pullback, especially if Fed commentary echoes a slower policy tightening path.
Intraday bias leans Buy the Dip, with caution around macro-driven volatility spikes.

One Step Ahead of the MarketHey guys and girls,
Look at this chart, Do you see what I see? (we are heading into a bear market).
(RSI= 86, kiss of Death) a chart is worth a thousand words!
Technical Section (a top is in place- ABC bear market):
Wave 1 = $ 850
Wave 3 = $ 1650
Wave 3 > 1.618 x length of Wave 1----> Wave 5 (Max) = 2.618 x length of Wave 1 (Target = $ 3300)
Fundamental (Bearish):
Let's look at the reasons:
a- Trump's trade war is over; as a result, there is no strong overriding trend.
b- Federal Reserve holds interest rates steady
Conclusion:
The trend is losing momentum and a top is in place.
Target = $ 2700
Invalidation level = $ 4170

XAUUSD NEW OUTLOOK Axxording to H1 analysis Gold market continuously in flyiing pressure
market break the RESISTANCE ZONE and make RBS (RESISTANCE BECOME SUPPORT )
now market will be falling and touch the SUPPORT ZONE and it will flying high so be careful use money management
TRADE AT YOUR OWN RISK
REGARD ALBERT

GOLD pull back soonFolks...we are at a major convergence level on gold...I see a decent pull back to around the 3500 level over the next few weeks before we again resume the up trend...as always this is not investment advice.

GOLD Local Short!
HI,Traders !
#GOLD keeps growing but
will soon hit a
Horizontal resistance
Of 4371.16 so after the
Retest we will be expecting
A local pullback and a
Local move down!
Comment and subscribe to help us grow !

Gold ready for #6,100.80 mark extensionAfter excellent Profits realized on current Bull run, Gold (due Friday’s Profit taking from Short and Medium-term Investors) Gold delivered (# -2.00%) decline to cool down critically Overbought levels. Personally I haven’t Traded yesterday as I was Highly satisfied with my already made Profits (just few #10.00 Aggressive Scalps (Buy orders) cca #30.000€ Profits, not more). I expect Gold to find Bottom now, direct Support zone which will engage Long-term Buying extension towards #6,100.80 psychological benchmark extension. Enjoy the Profits and have a great weekend!
Gold Market Nearing a Bottom — Trade with CautionAfter yesterday’s sharp decline, the market is likely entering a gradual bottoming phase. As I mentioned on Saturday, there are still unfilled gaps at 4019–4024 and 3887–3898. If the bears remain dominant, the 4019 gap could be filled, though a move toward 3887 seems less likely unless major negative news triggers it.
During any rebound, pay close attention to the 4200–4250 resistance area. If prices fail to stabilize there, the weekly chart pattern will weaken, increasing the risk of a drop toward the 3887 gap. Overall, trade with caution in the near term — the market is being influenced by multiple factors, leading to heightened volatility and risk. Being cautious never hurts.
While making profits is important, protecting your account comes first — otherwise, gains mean little. If you prefer fewer, safer trades, focus on the key price zones mentioned above and observe the market more than you act. For those continuing with short-term or scalping strategies, be sure to control your target prices strictly, especially now as the broader trend direction is still being established.
Of course, everyone has his or her own trading methods and theories. I will not comment too much here, but just share my own views. If you think it is useful, use it. If it is not useful, just watch the fun.