Gold mania ends in a $4000 reality check? Thousands queuing for hours in central Sydney to buy gold last week was a potential warning sign that gold was vulnerable to correction.
Today, gold prices saw their largest one-day fall in over ten years. After several failed attempts to break above 4,400, resistance held and momentum reversed sharply.
The first key support now potentially sits near 4,000 (200% retracement).
Despite the correction, long-term outlooks might remain positive. Ongoing inflation risk, lower interest rates, geopolitical tensions, and U.S. government dysfunction are still ever present. This might be why Goldman Sachs raised its December 2026 price target to 4,900 per ounce, up from 4,300, citing
Silver also slumped more than 7%, marking their biggest daily loss since 2021, as overbought signals flashed extremes.
Trade ideas

XAUUSD - Signal#XAUUSD - Signal
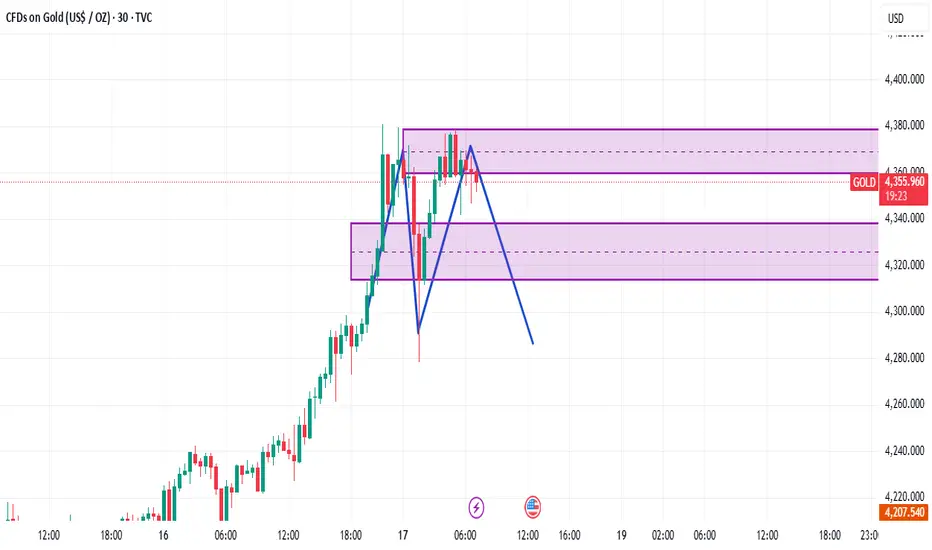
H4 - Double top formation + potential rebound from the level. Stop loss beyond the local maximum. Reduce risks.
Entry: 4345.714
TP: 4283.916 - 4186.789 - 4066.133 - 3991.360
Stop: 4386.930

Xauusd LTF bearish harmonic bat pattern.
Confluence with pivot resistance.
Gold has to go over $4500 at some point, guessing liquidity sweep lower to pick up some juice.

Oct 20, 2025 - XAUUSD GOLD Analysis and Potential Opportunity📊 Analysis:
After hitting a new high last Friday, gold quickly pulled back, with nearly a $200 range between the day’s high and low.
In my view, there are still no clear reversal signals yet — for now, I consider this a sign of bullish momentum weakening rather than a full trend change.
During the Asian session, my plan is to buy pullbacks into support as long as support holds.
However, if price breaks below 4219, I will shift my strategy to selling rallies into resistance.
Watch the 4200 support closely — a break below it would give the advantage to the bears.
🔍 Key Levels to Watch:
• 4320 – Resistance
• 4300 – Psychological level
• 4287 – Resistance
• 4265 – Resistance
• 4245 – Resistance
• 4219 – Key support
• 4200 – Psychological level
• 4186 – Support
• 4164 – Support
• 4153 – Support
📈 Intraday Strategy:
SELL: If price breaks below 4219 → target 4213, with further downside toward 4204, 4200, 4196
BUY: If price holds above 4250 → target 4258, with further upside toward 4263, 4268, 4274

GOLD 1H CHART ROUTE MAP UPDATE & TRADING PLAN FOR THE WEEKHey Everyone,
Please see our updated 1h chart levels and targets for the coming week.
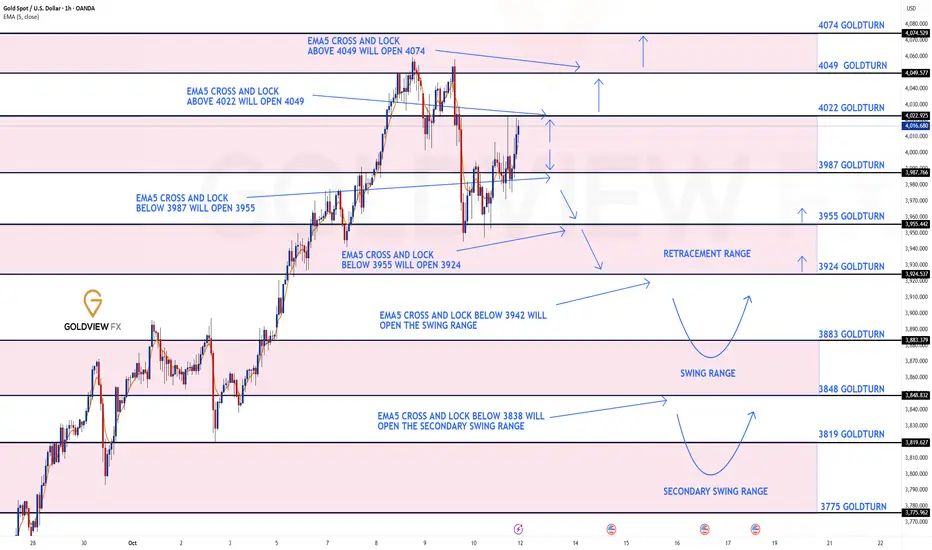
We are seeing price play between two weighted levels with a gap above at 4022 and a gap below at 3987. We will need to see ema5 cross and lock on either weighted level to determine the next range.
We will see levels tested side by side until one of the weighted levels break and lock to confirm direction for the next range.
We will keep the above in mind when taking buys from dips. Our updated levels and weighted levels will allow us to track the movement down and then catch bounces up.
We will continue to buy dips using our support levels taking 20 to 40 pips. As stated before each of our level structures give 20 to 40 pip bounces, which is enough for a nice entry and exit. If you back test the levels we shared every week for the past 24 months, you can see how effectively they were used to trade with or against short/mid term swings and trends.
The swing range give bigger bounces then our weighted levels that's the difference between weighted levels and swing ranges.
BULLISH TARGET
4022
EMA5 CROSS AND LOCK ABOVE 4022 WILL OPEN THE FOLLOWING BULLISH TARGETS
4049
EMA5 CROSS AND LOCK ABOVE 4049 WILL OPEN THE FOLLOWING BULLISH TARGET
4074
BEARISH TARGETS
3987
EMA5 CROSS AND LOCK BELOW 3987 WILL OPEN THE FOLLOWING BEARISH TARGET
3955
EMA5 CROSS AND LOCK BELOW 3955 WILL OPEN THE FOLLOWING BEARISH TARGET
3924
EMA5 CROSS AND LOCK BELOW 3924 WILL OPEN THE SWING RANGE
3883
3848
EMA5 CROSS AND LOCK BELOW 3848 WILL OPEN THE SECONDAARY SWING RANGE
3819
3775
As always, we will keep you all updated with regular updates throughout the week and how we manage the active ideas and setups. Thank you all for your likes, comments and follows, we really appreciate it!
Mr Gold
GoldViewFX
GOLD HTF — Is the Buying Climax reach and the BIG short coming??After a +53% yearly gain and a 10% September candle, we might finally be seeing the start of a two-month distribution phase, smart money taking profit before the end of the year and preparing for re-accumulation lower for next year.
Wyckoff View (Daily):
Possible Buying Climax (BC) followed by Automatic Reaction (AR) and Secondary Test (ST).
If confirmed, the markdown could target the $3,440 zone, where major resistance from earlier structure awaits a retest.
Until proven otherwise, the macro trend is still bullish, but momentum exhaustion and vertical price action often precede deeper retracements.
Trading Plan:
Stay small, stay precise. Scalping on M1–M5 to extract 50–100 pips per day is the play while the big money decides the next leg.
We don’t predict, we react.
Trade like the Casino, not the hopeful gambler.
Touch grass, protect peace, stay grateful.
Be safe, and God bless you all.

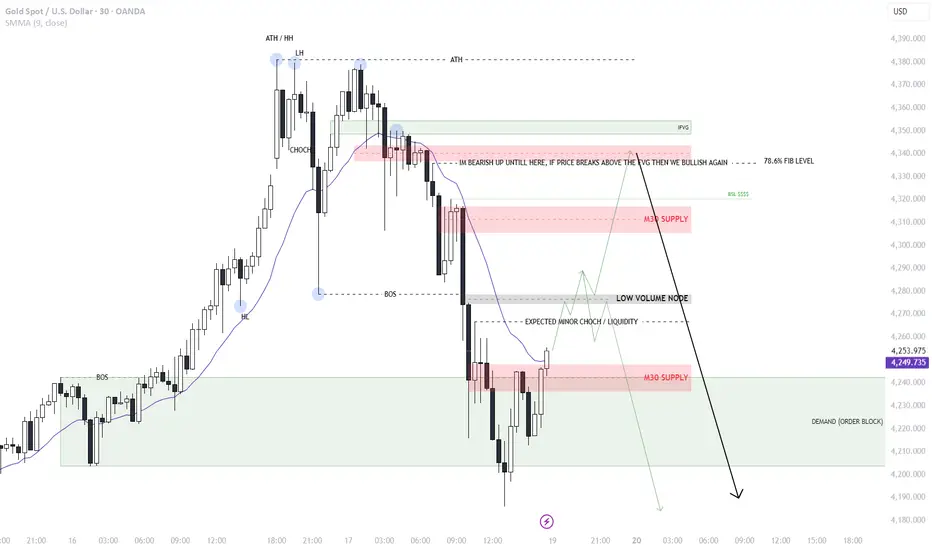
Gold Analysis for Week 20/10/2025Gold Analysis
Supply areas
4336 - 4343
4305 - 4315
4236 - 4247
Demand area
4285 - 4290
4215 - 4230
Low Volume nodes (LVN)
4275 - 4278 Bearish Biased
Scenario 1.
30 min Analysis
We Buy to 4275 sweeping and filling the LVN creating a minor CHOCH at 4266. On the 5 min we wait for a bearish CHOCH to then sell further with targets being 4232 , 4211 and 4187
Scenario 2
30 min Analysis
We Buy to 4275 sweeping and filling the LVN creating a minor CHOCH at 4266. We continue buying to the supply area at 4305. Wait for a 5 min bearish CHOC to sell to targets 4278, 4247 , 4211 and 4187
Scenario 3.
We break through 4355 and retest 4340 to the go bullish again.
I am bearish till price trades above 4336. If price trades above this level. I will look at bullish intent.
BULLISH ON GOLD?-Market has dropped alot; has been very unpredictable.
-As we all know; when the market moves aggressively; it needs to mimic the same move in the opposite direction.
-Hence im expecting a Long with a few TP. Zones.
-Lets see… OANDA:XAUUSD

Gold Insight Today 10/21/2025. Gold is trying to break the ATH!Gold Insight Today 10/21/2025. Gold is trying to break the ATH! Here I explain how I trade using my strategy. Hope this will help you guys.

Gold's Historic Rally: Where We're HeadingGold broke out of a multi-year consolidation (2020–2024) when it cleared the previous all-time high of $2,080. Once that level broke, we entered price discovery mode .
This is important: There's no overhead resistance from traders who bought at higher levels because there are no higher levels. That's bullish. But it also means we're in uncharted territory.
The weekly chart shows a clean uptrend with no signs of reversal yet. But rallies this big and fast typically need consolidation phases.
Here's where it gets specific. Gold showed a classic consolidation pattern:
- Consolidation range: $2,565–$2,750
- Breakout point: Early 2025
- Measured move target: ~$3400
Using the Fibonacci extension, if the uptrend continues, it suggests the next major resistance is around $4,500 and $4,750.
If you plot these on a chart, you see:
- Gold broke out cleanly from consolidation
- Every pullback has been bought
We're in a controlled uptrend, not parabolic. This is the structure of a trend that could continue.
But it's also the structure that could reverse if critical support breaks.


Gold w3 top? Elliott Wave Analysis yearlyThis count is based on my assumptions so anything can happen not a trading or financial advice just for educational purposes only kindly do your own ta thanks trade with care good luck.

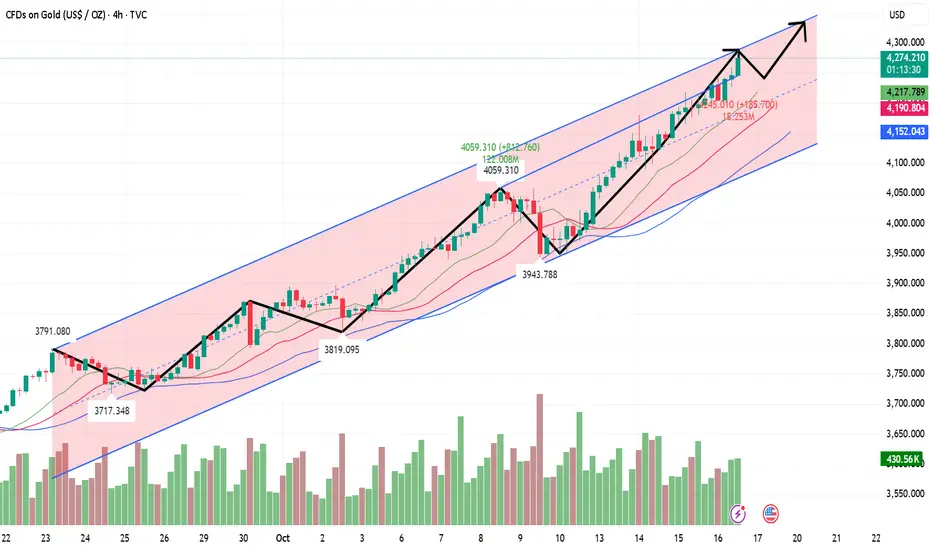
WHAT IS THE EXPECTED RETURN and DURATION of this GOLD Bull Run?Well, when measured against the DXY index, a clear trend becomes apparent.
A Golden Bull typically lasts about 40 quarters, which is essentially 1 decade (give or take a quarter).
Similar to #Bitcoin and its cyclical bull markets within a larger secular bull, the returns tend to decrease over time.
However, it seems that a triple-digit Gold price relative to the DXY is on the horizon at the very least.
What would that look like if the DXY were to hit a new low around 69? This would suggest a Gold price of $6900 at a ratio of 100:1.
A Gold price of $12K with a DXY of 80 only requires a ratio of 150...
Thus, a five-digit Gold price is certainly within the realm of possibility.
I have forecasts that extend as high as $12K.

Gold Extends Rally to New All-Time HighsGold Extends Rally to New All-Time Highs
From our previous outlook, gold has followed the optimistic scenario as expected. It reached the $4,000 and $4,050 targets and is likely to continue rising.
After the market turmoil caused by Trump’s comments on Friday about increasing tariffs on China, gold has strengthened again. Trading volume remains high and positive.
Gold is now hitting new all-time highs. If this uptrend continues and holds above 4060, the next possible targets are $4,100, $4,150, and $4,200.
However, since the U.S. market is closed today for Columbus Day, trading volume might be lower. If momentum slows down and gold drops below 4060 again, then it could briefly pull back to around $4,000 before continuing upward.
You may find more details in the chart!
Thank you and Good Luck!
❤️PS: Please support with a like or comment if you find this analysis useful for your trading day❤️

GoldXAUUSD
- Completed " 1234 " Impulsive Wave
- Break of Structure
- Resistance Level
- RSI - Divergence
- Bullish Channel as an corrective pattern in Short Time Frame

XAUUSD Bearish Structure Breakdown and Retest SetupSimple Analysis & Description:
The chart shows a Change of Character (CHOCH) at the top, signaling a possible end to the bullish trend.
Two major breakdowns occurred after price failed to maintain the ascending trendline, confirming bearish momentum.
A clear Break of Structure (BOS) formed, shifting market direction from bullish to bearish.
Price made a retest of the broken structure (highlighted yellow zone), which often acts as a new supply zone.
The gray zone below marks the next potential demand area or target zone, where price could react or find support.
The Ichimoku Cloud is now above the candles, indicating bearish pressure and potential continuation to the downside.
Summary:
➡️ Trend: Bearish
➡️ Key Zone: 4,297–4,329 (supply / retest zone)
➡️ Target Zone: 4,221 area (potential demand/support)

The Golden Triangle is coming to an end, beware of profit takingGold Hourly Chart: The overnight close was relatively high, and today's Asian session continued its upward trend. The European session saw a sharp drop below the upper channel line at 4242. This trend resistance line is the same one that held pressure at 4218 in yesterday's European session. The market then closed with a large, plump, bearish candlestick pattern at 2:00 PM, reaching the target of 4210. Since it was a large bearish candlestick pattern, not a long lower shadow candlestick pattern, a rebound confirming the 5-day moving average at 4230-34 is sufficient, so a further downward push is warranted.
The European session saw consecutive positive days, testing the bottom and rallying to a new all-time high. However, caution is advised in the US session. On the one hand, the 4250 level is a resistance point in the channel, and on the other hand, it is nearing the end of an ascending converging triangle, leaving little room for further movement and a potential reversal. Therefore, support remains at the middle line at 4230. Only a significant break below this level would trigger a potential for a significant short-term correction. Resistance is at 4265. Be cautious about blindly chasing rallies below this level. Consider the gains and losses at both levels and wait for signals.
XAUUSD NEXT POSSIBLE MOVE Gold is currently holding near a strong support zone, where buyers have consistently stepped in to push prices higher. After a brief correction, the market is showing early signs of bullish strength and accumulation.
If the price continues to respect this area and forms a bullish candle pattern (such as a rejection wick or bullish engulfing), it could signal the start of a reversal to the upside.
Momentum indicators are turning positive, suggesting that buying pressure is increasing while sellers are losing control.
As long as price remains above this key support, the bias stays bullish, and potential upside continuation can be expected in the next sessions.

GOLD – History Never Lies! Are We Close to Major Correction ?Hello Traders 🐺
As I expected, gold is now creating new all-time highs — but the real question is: how far can this rally actually go? Let’s take a closer look, because this chart might reveal a lot more than you think!
Let’s go back in time — all the way to when gold was still in the early stages of its first major rally and reached the top around $890 in 1980.
If you zoom in a little bit, you can clearly see that once the RSI reached around 90 (showing an extreme overbought condition), gold entered a massive bear market, dropping nearly 60% — something almost nobody expected back then.
Now, of course, we can’t rely only on the RSI overbought signal to predict the current situation, but when we use the Fibonacci Trend-Based Tool and measure the rally from its beginning to the bottom of its correction — that’s when things get really interesting!
Look closely: the 0.618 Fibonacci level — also known as the golden ratio — actually predicted the next major top years before it even happened.
When price reached $1880 in 2011, the RSI again entered the overbought zone, and we saw another strong 45% correction right after that!
But what about now?
The RSI is again approaching the same zone, and price is very close to the 0.88 Fibonacci level.
So, what do you think?
Is this the end of the bull run and the right time to start taking profits?
Let’s talk about it in the comments — because in my opinion, we might be about to see another correction, at least down to the 0.618 level, which perfectly aligns with the previous all-time high for gold!

GOLD: Will Go Down! Short!
My dear friends,
Today we will analyse GOLD together☺️
The in-trend continuation seems likely as the current long-term trend appears to be strong, and price is holding below a key level of 4,197.43 So a bearish continuation seems plausible, targeting the next low. We should enter on confirmation, and place a stop-loss beyond the recent swing level.
❤️Sending you lots of Love and Hugs❤️

A POSSIBLE RETRACEMENT It looks like gold is likely to sell a bit further but lower rectangular block could cause price to resume the bullish trend so it's a tricky area to trade but it's favorable to buy at lower block than selling but if it's able to move below the lower block then you can confidently sell.
October 17 Gold AnalysisOctober 17 Gold Analysis
Viewpoint: Spot gold has surged strongly, hitting new all-time highs on the back of multiple positive factors, fueling an extremely bullish market sentiment. Technical indicators suggest the market has entered a severely overbought zone, sharply increasing the risk of a short-term correction. This has resulted in significant fluctuations in the current market's upward and downward trajectory. Strategically, we should adhere to the principle of buying on dips and avoid blindly chasing highs. We must set stop-loss orders, manage our positions, and protect our principal.
Gold's strength is primarily driven by the following core factors:
1. Rising expectations of a Fed rate cut: The market currently anticipates a 25 basis point rate cut in October and hopes for another 50 basis point cut in December. These early and aggressive rate cut expectations are putting pressure on the US dollar and reducing the opportunity cost of holding non-interest-bearing gold, becoming the primary driver of gold's price increases.
2. Continued safe-haven demand: The ongoing US government shutdown and international trade tensions continue to attract global safe-haven funds into the gold market, seeking safe haven assets. 3. Structural Buying Support: Continued gold purchases by major global central banks and the long-term trend of de-dollarization provide a solid underlying demand for gold. Furthermore, a significant increase in holdings by the world's largest gold-holding ETF (ETF) further boosted market confidence.
Technical Analysis: Overbought Warning Amidst Extreme Strength
From a technical perspective, the gold market is in a peak bullish phase, but this also sows the seeds for a correction.
Long-Term and Daily Charts:
Unbeatable Trend: The daily chart has closed positive for five consecutive trading days, the TRIX indicator has formed a golden cross, and the MACD indicator's red bullish momentum bar continues to increase, clearly demonstrating that bulls remain firmly in control of the long-term and medium-term trends.
Significant Gains: Since this bullish rally began at $3,311, the price has risen by over $1,000, a significant increase.
Severely Overbought: The daily KDJ indicator is trading in the severely overbought zone, a strong technical warning signal. Historical experience shows that under such extreme overbought conditions, the market is highly likely to experience a significant technical correction within the next 1-3 trading days.
Short-Term (Hourly Chart):
High-Level Fluctuation: After reaching $4,379, gold prices quickly retreated to $4,279 before rebounding to around $4,350, demonstrating significant volatility and divergence between bulls and bears at high levels.
Short-Term Weakness Signal: The hourly KDJ indicator has formed a high-level death crossover after reaching overbought levels, and the MACD red momentum bar has shrunk, indicating a weakening of short-term upward momentum. The trend is relatively bearish and requires consolidation or a pullback to absorb profit-taking.
Trading Strategy
1. Main Strategy:
In the current environment, "buying on dips" is the only reasonable core strategy. Going short against the trend and anticipating a top is extremely risky. The key to trading is patience, waiting for the price to pull back to key support levels before intervening, rather than chasing the price at intermediate levels or after reaching new highs.
2. Key Levels:
Important Support Zone: Focus on $4,280-4,300, particularly around the morning low of $4,279. This area represents a crucial defensive line for bulls in the near term and serves as an ideal area for buying on dips.
Upward Resistance: $4,380 is currently the primary psychological and technical resistance level.
3. Major Risk Warning:
Extreme Volatility Risk: The market has entered a period of historically high volatility, with intraday swings exceeding hundreds of dollars becoming the norm. Traders must manage their positions carefully to avoid being wiped out by excessive volatility.
Technical Pullback Risk: Severe overbought conditions on the daily chart are currently the greatest risk. Any disturbance could trigger large-scale profit-taking, leading to a rapid and significant decline in gold prices. Investors must be fully prepared mentally and strategically for this.
Summary: Gold still has medium-term upside potential, but the short-term path is likely to precede a period of significant volatility or technical correction. Traders should maintain confidence in the long-term trend while remaining cautious of potential short-term fluctuations. It is recommended to participate in the market with a small position, enter the market in batches, and at key support levels. Always set a stop-loss to mitigate the risk of a sudden reversal.
Please be cautious when trading and control the risks! I wish you a smooth transaction!

XAU/USD Record Breaking Rally Runs Hot- Exhaustion RiskThis week’s rally marks the largest single-week range on record and the ninth consecutive weekly advance— the first such streak since August 2020, when the yearly high was registered. Weekly momentum has also surged to its highest level since April 2006, which likewise coincided with that year’s peak in gold. These technical observations suggest that while the broader outlook remains constructive, the immediate advance may be vulnerable at these levels.
Initial weekly support rests along the median-line, currently near the 4000 mark and a break / weekly close below this slope would be needed to suggest a more significant high is in place / a larger correction is underway. Monthly-open support rests at 3859 with broader bullish invalidation now raise to the 61.8% extension of the May advance at 3782.
Weekly resistance is eyed with the upper parallel / 2.618% extension of the 2015 advance at 4308- a topside breach / weekly close above this threshold would threaten another bout of accelerated gains with the next major technical considerations eyed at the 3.618% extension of the April decline at 4492 and the 1.618% extension of yearly advance at 4553.
Bottom line: The gold breakout extended into record highs this week with multi-year extremes registered in momentum, range, and duration- the exhaustion risk is mounting. From a trading standpoint, losses would need to be limited to 4000 IF price is heading higher on this stretch with a weekly close above 4308 needed to fuel the next major leg of the advance.
-MB
