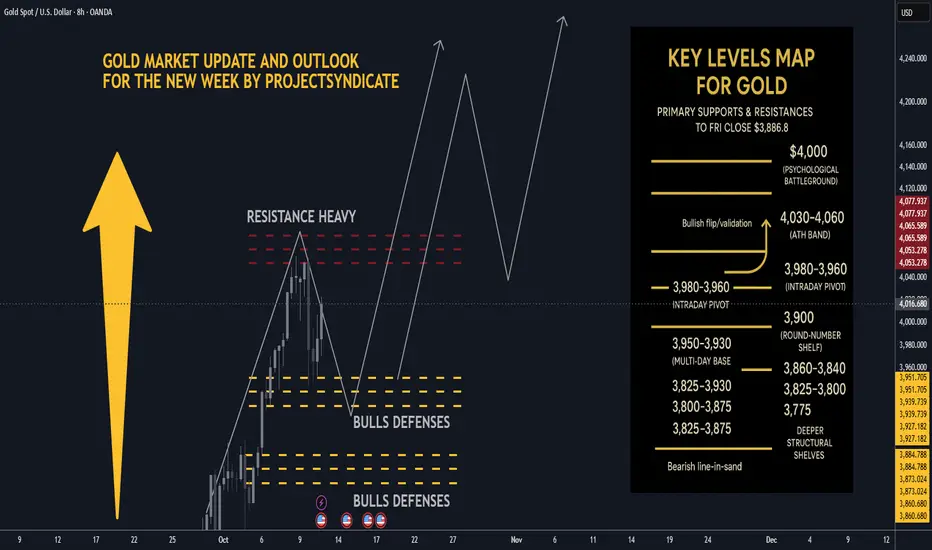
Gold next week: Key S/R Levels and Outlook for Traders🏆 Friday’s Close & Recent ATH:
Gold XAUUSD closed Friday around ~$3,990–$4,020/oz depending on venue most consolidated feeds show prints near $3.99–$4.02k at Friday close. The nearest recent intraday highs printed in the $4,030–$4,060 area across data providers this week, putting $4,000 as the immediate psychological battleground and $4,050–$4,060 as the latest short-term ATH band. YTD performance remains extraordinary 2025 YTD still showing a very large gain.
📈 Trend Structure:
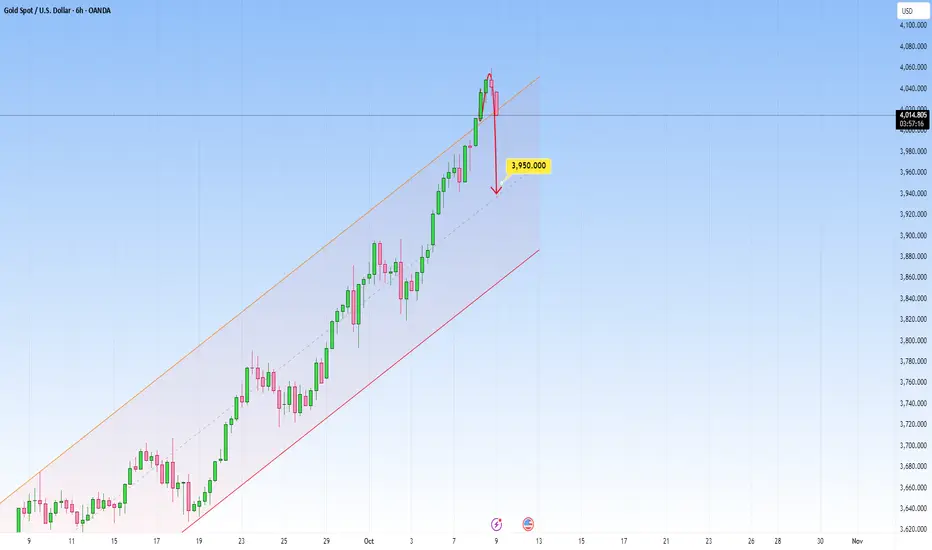
Price continues to track a well-defined ascending channel on 1H/4H with clear impulsive legs out of recent consolidations. Market character = higher highs / higher lows, persistent dip-buying, and strong trend adherence into quarter-turn 25/50 handles near round thousands. Momentum has been resilient into week-end despite tariff headlines, suggesting structural demand and participation from official buyers.
🔑 Key Resistance Levels:
The most critical resistances to watch updated from Friday close ≈ $4,000:
• 4000 — immediate psychological round-number battleground.
• 4,030–4,060 — recent intraday ATH band / short-term supply recent highs printed here across venues.
• 4,075 → 4,100 — measured move / extension band if acceptance above the ATH zone occurs.
• 4,150–4,200 — stretch momentum targets on sustained risk-off and break/acceptance above 4,100 structural extension.
Quick note: different data vendors quote small differences in ticks — I used consolidated high prints to identify the ATH band.
🛡️ Support Zones:
Immediate supports step down as follows
• 3,980–3,960 intraday pivot just under Friday close.
• 3,950–3,930 multi-day base / near-week lows.
• 3,900–3,888 round-number shelf and the prior week’s consolidation band.
• Deeper structural shelves: 3,860–3,840, 3,825, 3,800 → 3,775.
A sustained break below ~3,900–3,888 would signal increasing corrective risk; daily close under ~3,825 would more clearly shift the regime.
⚖️ Likely Scenarios:
• Scenario 1 Base Case – Controlled dip toward 3,950–3,930 or the 3,900 area to reload bids, then rotation higher toward 4,030–4,060 as buyers re-engage.
• Scenario 2 Momentum Break – Quick clearance of the 4,030–4,060 ATH band → sustained acceptance above 4,075–4,100, unleashing momentum into 4,150–4,200. Overbought readings exist intraday, but structural demand has kept pullbacks shallow.
📊 Short-Term Targets:
On continuation: 4,020 → 4,030–4,060 → 4,075 → 4,100, with 4,150–4,200 as higher extensions if acceptance holds.
On retrace: 3,980 → 3,950 → 3,930 → 3,900 as the key retrace ladder.
💡 Market Sentiment Drivers updated:
• Tariff shock / geopolitical risk: President Trump announced proposals for large new tariffs reports of a 100% tariff threat and expanded export controls on Chinese imports this week, escalating trade-war risk and knocking risk sentiment — that increases safe-haven demand for gold. News outlets Reuters, AP, WaPo and market reactions were visible Friday.
• Rate & policy expectations: Markets continue to price material odds of rate easing/softer Fed path relative to earlier in the year; that reduces real yields and supports gold. Feeds and FedWatch implied pricing show elevated cut odds that underpin lower opportunity cost for gold.
• Official demand: Central bank buying has remained constructive — WGC/official stats show continued net purchases in recent months monthly buying rebounded in August. This adds structural support to dips.
• Macro/flow: Risk-off from tariff headlines, rare-earth export controls, and supply-chain concerns are the immediate drivers that could catalyze pushes toward the ATH band.
🔄 Retracement Outlook:
A tag of 3,950–3,930 or a short stop-run into 3,900–3,888 would be a typical healthy pullback inside the trend. Fast reclaim of the first support band after a liquidity flush often precedes fresh ATH tests. Breaks under 3,900 that fail to reclaim quickly increase the probability of a deeper slide into the 3,860–3,825 shelf.
🧭 Risk Levels to Watch:
• Bullish structure intact: holding above ~3,950–3,930 or more conservatively, above 3,900 keeps the bull case intact.
• Bearish line-in-sand: daily close < 3,825 weakens trend; daily close < 3,775–3,750 signals a bigger corrective phase and opens lower targets.
🚀 Overall Weekly Outlook:
Gold remains in a strong uptrend with $4,020–$4,030/ATH band $4,030–$4,060 → $4,000 as the immediate battleground after Friday’s close. Expect buyable dips while supports hold; the topside roadmap favors 4,075–4,100 and 4,150–4,200 as measured extensions if the market digests tariff news into a longer-running risk-off regime.
Trade ideas
GOLD (XAUUSD): Important Supports to Watch
As Gold continues an extended correction,
here are significant supports to watch.
Horizontal Structures
Support 1: 4040 - 4060 area
Support 2: 3942 - 3959 area
Support 3: 3870 - 3897 area
Support 4: 3766 - 3831 area
Support 5: 3691 - 3735 area
Vertical Structures
Vertical Support 1: Rising trend line
A trend line and horizontal Support 1 compose a demand zone.
That will be the first potentially significant zone for a pullback.
In case of its breakout, the price will reach at least Support 2 then.
❤️Please, support my work with like, thank you!❤️
I am part of Trade Nation's Influencer program and receive a monthly fee for using their TradingView charts in my analysis.

GOLD – Overview | Focus on US–China Talks & Fed Cut BetsGold Gains as US–China Talks Take Center Stage
Gold edged higher as markets focused on upcoming talks between U.S. Treasury Secretary Scott Bessent and Chinese Vice Premier He Lifeng.
President Donald Trump expressed optimism that negotiations could yield progress, calling his previously threatened tariffs “unsustainable.”
Meanwhile, the ongoing U.S. government shutdown—now stretching into another week—continues to weigh on sentiment.
Markets are also pricing in a 25bps Fed rate cut in October, with another likely in December, adding support for precious metals.
🕯 Technical Outlook
Gold remains under bearish pressure while trading below 4,266, with potential downside toward 4,245 → 4,233 → 4,211.
A 15M close above 4,273 would signal a bullish reversal, targeting 4,294 → 4,316.
Pivot: 4,266
Support: 4,245 – 4,233 – 4,211
Resistance: 4,273 – 4,294 – 4,316

Gold.Gold.
US stock market has about 2 weeks to rally and undo this possible, very important breakout.
Not to be taken likely, as this would solidify the current upwards trend of outperformance by gold.

Gold Complete Deep Pull back and is likely to retest 4025Gold Complete Deep Pull back and is likely
to retest 4025
After a quick drop to the demand zone 3950
Gole formed a Pin bar and now is forming
an Inside bar
Trading Plan:
Long gold now, Sl below the Pin
Aim 4025
Apply 2% risk rule, and close half position
when Reward Risk Ratio hit 2:!
All the bset!

Gold Lacks a Healthy CorrectionGold has been trending steadily within an ascending channel, with buyers keeping control and driving price higher and higher.
And recently price broke above the channel, but it lacked conviction and price is falling back inside the channel.
This might signal buyer exhaustion and a potential shift in momentum. If sellers take over decisively, price could retrace back toward the middle or lower boundary of the channel for a healthy correction.

10.14Gold bulls continue to exert their strength!!!Gold is currently stabilizing after a broad range-bound consolidation on the 4-hour chart. It experienced an unexpected intraday plunge, but the momentum has been minimal. A rapid intraday rise followed by a sustained decline could present an opportunity for a short position. The price has rebounded after retracing to previous support levels, and the K-line charts are still trading above the short-term moving average, suggesting a relatively strong trend in the short term. There are currently no significant technical patterns on the hourly chart. On the smaller timeframes, pressure is building on the short-term moving average, maintaining a weak trend. There may be some room for correction in the short term. Focus on the support level around 4005 in the short term.
Gold: Market led by fearUncertainty brought the price of gold to new all time highest level at Friday's trading session at the level of $4.380. This was the ninth consecutive week of gold gains and almost daily ATHs. Investors agree that such a behaviour of one asset is highly unusual on financial markets, and that correction eventually has to come. One technical analyst found that the similar movement occurred in 1978 with the price of gold, however, the magnitude of the uptrend is now higher. Movements from US equity markets, crypto market and gold market are just screaming that something is not right. And it is not. Uncertainties coming from switch-on-switch-off tariffs, Government which is not functioning, macro data which are not available are all situations which are highly unusual, so investors are seeking a place where to safeguard their funds. For several hundred years in the past, this safe-haven asset was gold, so it is today.
Under such circumstances technical analysis is not quite useful in order to estimate probabilities of future moves. It comes from the fact that this market is currently led by fear, and the level of fear will determine the next level of the price of gold. This market is currently not led by macro data or other relevant fundamentals, where technical analysis can provide relevant estimates. Still, a stronger pullback on Friday showed that the level of fear is slowly coming down. The price closed the week at $4.250, or 1,75% lower. At the same time we have seen some recovery on US equity markets and the crypto market. Is this the start of a major correction in the price of gold? No one knows. The week ahead will show if the level of fear is indeed coming down or it was just a Friday's short break. What is certain is that the correction will eventually come in the future, at the moment when all current uncertainties are settled.

GOLD Technical & Order Flow AnalysisOur analysis is based on a multi-timeframe top-down approach and fundamental analysis.
Based on our assessment, the price is expected to return to the monthly level.
DISCLAIMER: This analysis may change at any time without notice and is solely intended to assist traders in making independent investment decisions. Please note that this is a prediction, and I have no obligation to act on it, nor should you.
Please support our analysis with a boost or comment!
GOLD (XAUUSD): The Next Resistances
Here are the next potentially significant psychological resistances
too look at on Gold for pullback.
Resistance 1: 2198 - 2203 area
Resistance 2: 2248 - 2253 area
Resistance 3: 2298 - 2303 area
In case of a start of a bearish move,
consider the underlined supports for buying.
❤️Please, support my work with like, thank you!❤️
I am part of Trade Nation's Influencer program and receive a monthly fee for using their TradingView charts in my analysis.

GOLD (XAUUSD): The Next Resistances
Here are the next potentially significant resistances on Gold to focus on.
Resistance 1: 4397 - 4403 area
Resistance 2: 4447 - 4453 area
Resistance 3: 4487 - 4503 area
Consider the underlined horizontal and vertical supports
for potential buying after pullbacks.
❤️Please, support my work with like, thank you!❤️
I am part of Trade Nation's Influencer program and receive a monthly fee for using their TradingView charts in my analysis.

XAUUSD (Gold) 1-Hour Timeframe Swing Trading - Long PositionXAUUSD (Gold) 1-Hour Time frame Swing Trading - Long Position
Wait for a pullback on the smaller time frame to find a long entry opportunity.
- Entry Level: Around 4100 USD.
- Stop-Loss Level: Set at 4047 USD.
- First Target Level: Look for around 4200 USD; reduce position size by half and trail the stop-loss.
- Second Target Level: Look for around 4310 USD; reduce position size by half again and trail the stop-loss.
- Third Target Level: Look for around 4450 USD; reduce position size by half once more and trail the stop-loss.
- Let the remaining position run freely, continuing to reduce position size and trail the stop-loss as the trade progresses.

Stay out. Let others make money if they can.Gold rose this week — so far (and I really want to stress so far) — by around 10%. That’s massive by any standard.
On Monday, I tried to catch a dip and missed it. Since Tuesday, I’ve been on the sell side — completely wrong on direction, yet somehow still managed to finish positive overall.
Yesterday my stop got hit, but after what happened overnight, it turned out to be just a scratch. With this kind of volatility, a recovery of 250pips can happen in ten minutes.
Looking at the chart — it’s bullish, no question. Should it be bought? Hmmmm...
Looking at the volatility… for me, it’s become untradeable.
Can it keep going higher? Of course.
How high? Nobody knows.
At this point, any prediction is just throwing numbers in the air.
Trading corrections, as I’ve tried to do, is a guessing game. I’ve had some luck so far, but after yesterday's stop loss, I’m stepping aside.
My take: stay out. Let others make money if they can.
A 1,000-pip rise and an equal reversal — all while I was asleep (and trust me, I sleep very little) — is too crazy. Stops can be wiped for bulls just as easily as for bears.
At some point, it will settle down and define its levels.
Until then — it’s not for me anymore.

THIS BUY AND HOLDWe are buying and this is one of the best trades you could get, buy and hold till it create a new high or higher high ,

Gold is ready for #6,100.80 psychological mark extensionAfter excellent Profits realized on current Bull run, Gold (due Friday’s Profit taking from Short and Medium-term Investors) Gold delivered (# -2.00%) decline to cool down critically Overbought levels. Personally I haven’t Traded yesterday as I was Highly satisfied with my already made Profits (just few #10.00 Aggressive Scalps (Buy orders) cca #30.000€ Profits, not more). I expect Gold to find Bottom now, direct Support zone which will engage Long-term Buying extension towards #6,100.80 psychological benchmark extension. Enjoy the Profits and have a great weekend!

Gold Consolidates After Biggest One-Day Drop Since 2013GOLD | Price Slips After Tuesday’s Massive Selloff
Gold remains under pressure after recording its largest one-day drop since 2013, falling more than 6% (≈ $250).
Despite the steep decline, long-term fundamentals such as central-bank demand and geopolitical uncertainty continue to provide underlying support.
For now, the metal is consolidating between $4,011 and $4,056, awaiting a decisive breakout.
A 15-minute close below $4,011 would confirm continuation toward $3,979 → $3,945 → $3,894.
A close above $4,057–$4,074 would trigger a bullish reversal, targeting $4,101 → $4,162.
Pivot Line: 4,011
Support: 3,979 · 3,945 · 3,894
Resistance: 4,056 · 4,075 · 4,101
previous idea:

Why is gold rallying despite the Fed's silence?
Gold prices resumed their upward trend on Monday, primarily benefiting from multiple positive factors. The market generally expects the Fed to maintain a wait-and-see stance ahead of its interest rate meeting, with upcoming inflation data providing a key indicator. Meanwhile, the uncertainty surrounding the US government's fiscal impasse has created an additional safe-haven premium for gold. Continued tensions in the Middle East have highlighted gold's hedging potential. Long-term, stable gold purchases by global central banks and ETF holdings provide solid support for gold prices, effectively offsetting short-term volatility. Furthermore, the performance of traditional safe-haven currencies such as the Swiss franc and the Japanese yen, along with the US dollar, is also impacting gold's appeal.
In the 4-hour analysis, gold fluctuated below the key 4380 level, but strongly broke through this resistance level driven by safe-haven buying, indicating a resurgence of bullish momentum. This breakthrough confirms a short-term strong pattern, with the 4300 level being a key support level for the day. Operationally, the approach should shift to a bullish trend, prioritizing opportunities to enter the market on pullbacks to lower levels. This rapid rally and subsequent recovery of lost ground further confirms the strength of the current bullish momentum. Given the volatility, we recommend remaining patient and waiting for a price correction before entering long positions, with a well-placed stop-loss.
Gold Recommendation: Go long on a pullback to the 4318-4313 range, targeting 4380-4400!

The Ultimate GOLD || Intraday Trading Plan (10/23/2025)Welcome to Trade with Decrypters!
DETAILED AND COMPLETE ANALYSIS ( 5 TRADE SETUPS )
Central Bank Buying
Central banks added net 19t in August led by Kazakhstan (14t), Bulgaria and El Salvador, Q3 on pace for 1,000t+ annually up 41% from historical norms. BRICS drivers like China (300t+ YTD) and India's $100B reserves fuel de-dollarization and inflation hedges; Poland reaffirms targets amid risks. Silver links to EV/solar boom (+70% China demand). Outlook: Unfazed 1,000t buys lift prices into 2026.
ETF Inflows & Sentiment
Gold ETFs hit $472B AUM in Q3 (+23% q/q) with $64B YTD inflows, September $17B record led by North America/Europe; Asia minor outflows. Safe-haven rush amid trade wars, minor profit-taking post $4k peak. RSI 75 overbought, $3,900 support holds. Silver +$2B YTD on industry bets. Forecast: Gold $4,200 test, silver $50+.
Macro & Geopolitical Events
Fed Oct cut vs. 2.9% inflation/shutdown-delayed jobs—labor firmer but risks grow.
Trump's China tariffs fuel wars; BRICS stalls de-dollarization but boosts gold; Ukraine/Mideast hikes energy/inflation. Drives 50%+ YTD metals gains; tariffs add 1–2% CPI.
Silver Deficit
Fifth straight deficit at 118M oz in 2025 (down 21% YoY), demand stable 1.20B oz vs supply +3% to 1.05B oz, industrial record 680M+ oz from solar/EVs. Renewables offset jewelry drops
Futures & Options Flow
CME gold OI ~528k contracts, steady amid volumes; CVOL moderate, call/put skew bullish for rate-cut squeezes
Fundamentals & Forecast
Gold +51% to $4,062, silver +43% to $48—via 1,000t+ CB buys, inflation, cuts, 7% GDP deficits. De-dollarization/geo-risks dominate. Projection: Gold $4,400 Q4, silver $57 mid-2026
📞 Contact Us Now: +92 315-5060561
🌐 Website: www.tradewithdecrypter.com
📺 YouTube: www.youtube.com
📘 Facebook: www.facebook.com
🚨 App : chat.whatsapp.com

DeGRAM | GOLD broke an ascending structure📊 Technical Analysis
● XAU/USD is trading within a descending channel but recently bounced off its lower boundary near 4,070, showing early signs of bullish correction.
● A breakout above 4,149 could trigger momentum toward 4,192 and 4,236, supported by a double rejection at the channel’s lower trendline.
💡 Fundamental Analysis
● Gold is gaining mild strength as lower U.S. Treasury yields and geopolitical tensions boost demand for safe-haven assets.
✨ Summary
● Long bias above 4,070; targets 4,149–4,236. Technical recovery and safe-haven demand support short-term bullish momentum.
-------------------
Share your opinion in the comments and support the idea with a like. Thanks for your support!

DeGRAM | GOLD above the support area📊 Technical Analysis
● XAU/USD found strong support in the 4,220 zone, where buyers stepped in after a brief pullback, confirming the area as a key accumulation level.
● Price is now consolidating below 4,260, preparing for a potential bullish breakout toward 4,312–4,357, supported by the fixing pattern near the support zone.
💡 Fundamental Analysis
● Gold demand remains solid as geopolitical uncertainty and lower Treasury yields sustain its safe-haven appeal.
✨ Summary
● Long bias above 4,220; objectives 4,312–4,357. Price stabilization at support suggests renewed upward momentum in the short term.
-------------------
Share your opinion in the comments and support the idea with a like. Thanks for your support!

Gold Trade Plan 15/10/2025Dear Traders,
📊 XAUUSD 4H Analysis
Gold continues to move inside a clean ascending channel, respecting both the midline and the upper boundary perfectly.
Price is now approaching a strong resistance zone, which overlaps with the top of the channel — making it a potential reversal area.
🟣 If we see rejection around this zone, a short-term correction toward the support area (purple zone) or the midline of the channel could follow.
🟢 However, if bulls break above the resistance with strong momentum, we might see a new impulsive leg aiming toward $4,300 – $4,350.
📈 Structure remains bullish as long as price holds above the lower trendline.
✨ #Gold #XAUUSD #TechnicalAnalysis #PriceAction #TradingView #Forex #SmartMoney #ChannelTrading #Bullish #MarketStructure
Regards,
Alireza!

XAUUSD 1H – EW Long SetupHi fellow traders,
On the 1H XAUUSD chart, I am applying Elliott Wave principles to outline a potential long setup. Price seems to have completed wave 4 and is reacting from the golden box area, suggesting that wave 5 may now start unfolding to the upside.
The invalidation level at 4004.72 represents my expected end of the correction, although the setup remains valid even if price moves slightly lower. My Stop Loss is set at 3940.00, which would confirm structural failure if reached. The Take Profit is positioned at 4437.36, targeting the projected completion of wave 5.
Good luck and trade safe!
