Relentless Rally:Gold Won’t Rest Until 4500!?The 4300 series chapter has begun as expected, with gold continuing its strong upward trend, currently reaching a high near 4381. However, it is clear that after encountering resistance in the 4370-4380 area three times, gold has shown clear signs of a pullback. This could lead to the formation of a triple top structure in the short term, suppressing gold prices in the short term.
However, relatively speaking, as gold continues to rise, testing the 4280 area during the pullback before rebounding again, technical support has shifted to the 4320-4310 area. Furthermore, the validation of the pullback and the current strong upward trend will strengthen the support in this area to a certain extent, thus supporting gold's rebound.
Therefore, for the current short-term trade:
1. First, try to continue shorting gold with resistance at 4370-4380, targeting a pullback to the 4350-4340 area.
2. Once gold retraces to the 4320-4310 area, consider going long on gold, targeting the 4340-4350 area.
Trade ideas

Gold Vs MoneySupply: a chart Peter Schiff Doesn't want u to seegold has upside.. expecting it to push toward its real valuation all time high..
over time gold has performed poorly at preserving capital. but academically recognized inflationary environments could be what was missing.

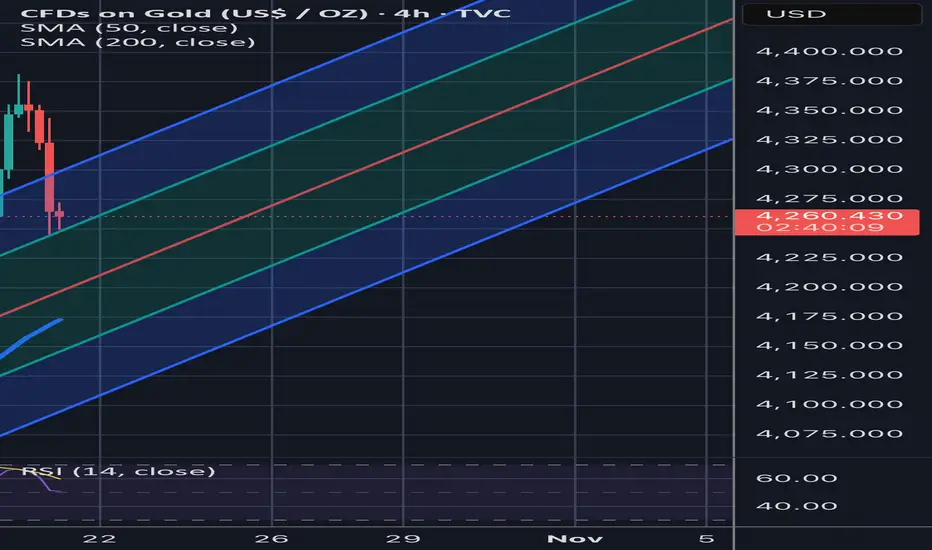
Gold flight to safety tradeThe Gold remains in a bullish trend, with recent price action showing signs of a continuation breakout within the broader uptrend.
Support Zone: 4260 – a key level from previous consolidation. Price is currently testing or approaching this level.
A bullish rebound from 4260 would confirm ongoing upside momentum, with potential targets at:
4400 – initial resistance
4450 – psychological and structural level
4500 – extended resistance on the longer-term chart
Bearish Scenario:
A confirmed break and daily close below 4260 would weaken the bullish outlook and suggest deeper downside risk toward:
4200 – minor support
4160 – stronger support and potential demand zone
Outlook:
A bullish bias remains intact while the Gold holds above 4260. A sustained break below this level could shift momentum to the downside in the short term.
This communication is for informational purposes only and should not be viewed as any form of recommendation as to a particular course of action or as investment advice. It is not intended as an offer or solicitation for the purchase or sale of any financial instrument or as an official confirmation of any transaction. Opinions, estimates and assumptions expressed herein are made as of the date of this communication and are subject to change without notice. This communication has been prepared based upon information, including market prices, data and other information, believed to be reliable; however, Trade Nation does not warrant its completeness or accuracy. All market prices and market data contained in or attached to this communication are indicative and subject to change without notice.

GOLD leveled off after its strongest rally since 1979OANDA:XAUUSD Falls After Trump's 'Softening' Comments on China
Gold Spot gold fell nearly 2% on Friday (October 17), ending a long rally after hitting a new record, as a stronger US dollar and President Donald Trump's soft remarks dampened demand for safe-haven assets.
Spot gold ended the session at $4,250.91 an ounce, down 1.74%, after peaking at $4,379.94 earlier in the session. The US dollar index rose 0.2%, making gold more expensive for foreign investors. Earlier, gold recorded its biggest weekly gain since the Lehman Brothers crisis in 2008.
Trump Calms Trade Tensions, Gold Loses Safe-haven Momentum
Speaking at the White House, Trump admitted that 100% tariffs on Chinese goods were “unsustainable” and confirmed plans to meet President Xi Jinping in the near future. The comments quickly changed market sentiment, easing expectations of an escalation in the trade conflict and pulling safe-haven demand away from gold.
FXStreet commented: “Gold prices fell about 2% from a historic peak as Trump eased his tone with Beijing. The recovery in risk sentiment kept the dollar strong and gold under pressure.”
The yield on the 10-year US Treasury note rose 3 basis points to 4.01%, while real yields rose nearly 2.5 basis points to 1.72%, further pressuring non-yielding assets like gold.
Medium-term outlook remains positive
Despite the short-term correction, gold prices have risen more than 64% year-to-date, boosted by expectations that the Federal Reserve will begin a rate-cutting cycle. The market is now pricing in a 25 basis point cut at its October meeting, and another in December.
HSBC has raised its 2025 average gold price forecast by $100 to $3,455 an ounce, and expects prices to reach $5,000 by 2026.
Some fresh concerns about credit risks emerged after two regional US banks reported $50 million in bad loans, but White House Senior Advisor Kevin Hassett reassured that the banking system remains liquid and “credit conditions are generally stable.”
Goldman Sachs: Gold Price Rally “Real-Based,” Not Speculative Bubble
Gold prices continued to hit records this week, surpassing $4,300 an ounce on October 16, marking a four-session winning streak and a gain of about 65% year-to-date, the strongest since 1979. However, according to Goldman Sachs Group Inc., this is not a speculative frenzy, but reflects real demand from institutions and central banks.
“The current momentum in gold is not driven by euphoria,” Goldman Sachs said in a video conference. “Central banks continue to buy at record levels, while private investors are only gradually rebalancing their portfolios as the Fed accelerates the pace of rate cuts.”
After years of low asset allocations to gold, the market is now returning to a more reasonable balance, not a “gold bubble,” Goldman Sachs said.
Goldman Sachs raised its December 2026 gold price forecast from $4,300 to $4,900 an ounce, highlighting two key drivers: strong inflows into Western gold ETFs and sustained net buying by central banks, particularly in Asia and the Middle East.
Echoes of the 1970s: History Repeats in a New Way
Let’s compare the current cycle to the “gold rush” of the 1970s, when the US ended the Bretton Woods system, inflation soared and the oil crisis pushed the price of gold many times higher.
“Back then, budget deficits and policy uncertainty led investors to seek refuge outside the official monetary system. And now, similar factors are emerging, from US fiscal risks to geopolitical divergence, making gold continue to be a popular hedge.”
According to Goldman Sachs, the gold market is still relatively small compared to the scale of global capital flows, so each shift in capital flows greatly amplifies price fluctuations.
Technical outlook analysis of OANDA:XAUUSD
The daily chart of gold is still in a medium-long term uptrend, as shown by the price remaining above the MA21 and still in the uptrend channel despite the correction. After reaching a historical peak of 4,379, the price has dropped to around 4,250 USD/ounce, corresponding to the Fibonacci retracement level of 0.382.
• Current candlestick structure: a strong correction candle appears but has not broken the bullish structure.
• Important technical support zones:
o 4.216 – 4.160 (Fibo 0.382 – 0.5): potential short-term support zone.
o 4.110 (Fibo 0.618): stronger support, if this zone is broken, it can move into a deep correction phase.
• RSI: still above 70, showing that the market is still in the overbought zone, prone to strong short-term fluctuations but has not confirmed a reversal.
=> Conclusion of the main trend: Gold is still in the main uptrend, currently only in a technical correction phase after reaching the peak, there is no signal of a medium-term reversal.
SELL XAUUSD PRICE 4309 - 4307⚡️
↠↠ Stop Loss 4313
→Take Profit 1 4301
↨
→Take Profit 2 4295
BUY XAUUSD PRICE 4160 - 4162⚡️
↠↠ Stop Loss 4156
→Take Profit 1 4168
↨
→Take Profit 2 4174

GOLDGOLD next reaction is 4300 and if consolidates then further upside to take 4400 otherwise a break down from 4300 to 4200 and below.
Disclosure: We are part of Trade Nation's Influencer program and receive a monthly fee for using their TradingView charts in our analysis.

GOLD at current support? holds or not??#GOLD.. market have current supporting area is 4024-25
holdings means again bounce expected..
good luck
trade wisely

GOLD BUY OPPORTUNITY; TARGET - 4380 - 4566Gold Buy Opportunity
Setup: Rebound from Key Support Zone ("Golden Zone")
Current Price Level: ~ 4,381.48
Entry Zone: 4,380 – 4,390 (on confirmation of bounce)
Stop-Loss: 4,340 (below recent swing low)
Take-Profit Targets:
Target 1: 4,450
Target 2: 4,500 (major resistance)
Target 3: 4,550 - 4566 (extension level)
Risk Management
Risk per Trade: Do not risk more than 1-2% of your trading capital.
Reward-to-Risk Ratio: ~ 2:1 or better
Position Size: Adjust based on stop-loss distance and account size.
Trading gold and other financial instruments involves significant risk, including the potential loss of all invested capital. The analysis provided is based on technical indicators and market conditions at the time of writing and is subject to change without notice. This is not financial advice. Always conduct your own research and consider consulting a licensed financial advisor before making any trading decisions. Past performance is not indicative of future results.

GOLD In A New Upward Move Targeting $4000 - $4100GOLD In A New Upward Move Targeting $4000 - $4100
From our previous analysis, GOLD respected the bullish scenario. This came with a confirmation during the night trading session as I explained in the previous post.
With this move above 3895, the price confirmed a bullish triangle pattern that shows signs of a strong bullish momentum.
From our chart we can observe that it is the same similar move as it was before. The bullish flags show a healthy uptrend and we all know that gold is in a crazy bullish move supported by the geopolitical situation or other factors. Everyone talks about its strength, but I am not sure if we know the Truth.
Truth is not a Luxury for ordinary people 😂
The price has broken above the $3,895 - $3,900 resistance area as I explained for the bullish scenario in the previous analysis and may retest it before continuing higher.
Targets:
$3,950
$4,000
$4,050
$4,100
You may find more details in the chart!
Thank you and Good Luck!
❤️PS: Please support with a like or comment if you find this analysis useful for your trading day❤️

Gold is about to enter the 4400 era
News:
On Friday (October 17), during the Asian and European sessions, spot gold bottomed out and rebounded in a V-shaped reversal trend. It fell 2% during the session, about $100, and then quickly recovered the lost ground. It is currently trading around 4330.
Recently, with the expectation of the Federal Reserve cutting interest rates becoming more and more intense, and there is an expectation of further interest rate cuts, the loose atmosphere, coupled with the expectation of inflation and the impact of the economic and trade turmoil, gold has once again become the darling of the market. Every day, it witnesses new highs in history, and the trend is becoming more and more crazy. There is no top in sight, and it is also unpredictable when a wave of diving will come.
Specifically:
Judging from the 1-hour market trend, we are currently paying attention to the short-term support at 4320, with a focus on the 4215 support. The bulls are rising strongly and there is no top. In terms of operation, we will mainly go long on pullbacks. For the middle position, we will watch more and do less, be cautious in chasing orders, and wait patiently for key points to enter the market. I will provide detailed trading strategies in the channel, so please pay attention.
Trading strategy:
Buy: 4320-4315, SL: 4300, TP: 4360-4380

XAUUSD: Intraday trading plan and key levelsOANDA:XAUUSD continues to recover strongly after a 50+ point pullback from 4218 → 4165, bullish momentum remains sustained. However, for today’s session we should be cautious, as a sharp correction may occur now that price has achieved the 4250 target on Futures, which corresponds to 4240 on CFDs.
On the Options market, long put contracts are being executed in notable size—something that was rare in prior sessions.
⇒ Therefore, I assess that we should be cautious today because prices may be preparing for a sharp decline either today or in the coming sessions.
That said, we must also account for the possibility of one final push higher before the downside begins.
Key levels to monitor for price action and potential scalp trade setups:
Resistance:
Resistance:
Margin zone resistance:
Strong resistance:
Support:
Support: ,
Margin zone support:
Strong support:
Always be patient and wait for the price to reach the support and resistance zones above and get confirmation. Do not place limit orders or enter orders when the price is increasing or decreasing sharply.
Take advantage of the above support and resistance zones and trade short-term when the price reacts at these support and resistance zones.
Wait for reactions such as Engulfing candles, Doji,... at the support and resistance zones.
Always set stop losses when trading and manage risks closely.
Victor Dan @ ZuperView

THE KOG REPORTTHE KOG REPORT:
In last week’s KOG Report we had a bias level and bullish above 3740 and a red box break we wanted to see above the 3765 level. We managed to swoop the low, not into 3740 but not far off, then break above and managed to complete all of the red box targets on that day.
During the week, we then released our updates confirming the move and managed to track it all the way, near enough to the top, where we suggested caution on longs and expected the move down, which worked very well.
All in all, another successful week in Camelot, not only on Gold but across the other pairs we trade and analyse as well.
So, what can we expect in the week ahead?
We had a 60% recovery on Friday which Is a good sign for bulls, however, there is a bias level here and that’s the 4003-6 region. We’ll use that as the guide for a break above or below for the opening, and say that if it holds, we should be looking for a completion of the move into the 4030-3 levels and above that 4060. If we do reach 4050, we will have flipped and any RIPs will be temporary from what we can see with potential for price to attempt the 4100 level and potentially a little above, which is where we feel there may be an opportunity to short again.
Now, if we can break below the 4003 level, bulls will need to play caution as the first main key level below starts at 3955 which is where we may get a temporary bounce, but based on the flip below 3995 will become the new resistance level.
We’re expecting potential gaps on market open so we’ll leave this report as subject to change for now and as always, we’ll update traders with our red box strategy levels and what to look for.
KOG’s bias of the week:
Bullish above 4003
Bearish below 4003
RED BOX TARGETS:
Break above 4630 for 4645, 4660, 4663 and 4672 in extension of the move
Break below 4620 for 4610, 4603. 3998, 3990, 3985 and 3960 in extension of the move
Please do support us by hitting the like button, leaving a comment, and giving us a follow. We’ve been doing this for a long time now providing traders with in-depth free analysis on Gold, so your likes and comments are very much appreciated.
As always, trade safe.
KOG

Oct 23, 2025 - XAUUSD GOLD Analysis and Potential Opportunity📊 Analysis:
Yesterday, gold dropped to a low of 4004 before rebounding sharply to 4162.
For today, the main plan is to sell rallies into resistance — as long as price stays below 4162, bearish momentum remains dominant.
Only if price breaks and holds above 4162, the bullish side may take control.
There’s also a short-term long opportunity near 4114 — if the level holds, a quick rebound trade can be considered (keep it light and short-term).
🔍 Key Levels to Watch:
• 4162 – Major resistance
• 4150 – Mid-level
• 4128 – Resistance
• 4114 – Intraday key resistance
• 4080 – Support
• 4060 – Support
• 4045 – Support
• 4024 – Support
📈 Intraday Strategy:
SELL: If price breaks below 4084 → target 4080, with further downside toward 4075, 4070, 4065
BUY: If price holds above 4162 → target 4170, with further upside toward 4175, 4186, 4190

Enjoying the Profits / #5,000.80 mark nextQuick update: I am on semi-vacation / not Trading currently due spectacular results I have made on current Bull run and therefore decided to take small vacation and rest. I am constantly getting messages of liquidated Sellers in attempt to find local Top’s and Sell Gold however my practical suggestion remains the same: do not Sell Gold at all costs / this is undisputed Bullish trend and total Bullish domination. Also, reversals on Gold will happen, of course an asset cannot only soar or fall, however those declines in form of a correction are only sweeps to cool down critically Overbought levels however Gold will stay Bullish. Keep Buying Gold from local Low’s as I did for past few quartals. I am back from my well deserved rest on Thursday as normal. I do expect Gold to invalidate #4,300.80 psychological benchmark soon enough which will pave the way towards #5,000.80 psychological benchmark extension which remains my Target for the fractal.

Buy Pressure Building on GoldGold is displaying signs of buyer re-entry after a period of controlled downside movement. The recent liquidity sweep around the lower range indicates that short-term selling pressure has been largely absorbed, creating favorable conditions for a potential upward expansion.
Market activity suggests renewed interest from institutional participants accumulating within the current price zone. The consolidation phase appears to be forming a base, signaling the possibility of a directional shift as liquidity gradually migrates upward. Increasing momentum on the lower end of the range reflects confidence returning to the market, setting the stage for a possible continuation toward higher valuation areas.
The outlook remains constructive as long as current accumulation behavior sustains, with market sentiment leaning toward a recovery-driven advance in the near term.

GOLD Local Long!
HI,Traders !
#GOLD is going down
To retest the horizontal
Support of 4314.84from
Where we will be expecting
A local bullish rebound
And a move up !
Comment and subscribe to help us grow !

Gold Intraday Trading Plan 10/23/2025Gold yesterday was very volatile again. It can move 1k pips within hours. Interestingly, it bounced from 4020 three times and this level acts as a strong support. In lower TF, it seems gold is regaining bullish power. However, in daily, it is pretty bearish. But in 2D, bulls are still in control. Therefore, I am expecting an initial drop from 4124 for gold today to at least 4090 or even testing 4020 again.
If 4090 support holds, gold could go up to 4190. If it finds 4020 support again and bounce from there, we could see 4145 today. However, if 4020 is broken, gold could drop down to 3950 (in my opinion, low chance this will happen).

Gold Plunges — Buying Opportunity EmergesThe strength of the bears eventually caused the price to fall below 4100. After touching 4080, the volatility decreased. I believe that at this point, everyone should know how to trade next. That's right, it is to go long, but pay attention to position control to avoid directly overweighting. It is safer to buy in batches, because the bottom cannot be formed all at once. The probability of this is relatively small. During the rebound, pay attention to the resistance in the area around 4180-4200/4250. If there is a strong and rapid rebound, the price will most likely have some retracement. Therefore, if you are doing short-term trading, you should pay attention to controlling the target. Mid-line trading may also be a roller coaster, but the overall direction should be correct. However, you should also pay attention to the risks. That's all for today.

GOLD: BUY $4235, TARGET $4450! (FED RATE CUT PLAY)📰 MACRO & NEWS: Low-Interest Rate Tailwinds
Gold prices are strongly supported by fundamental factors:
Fed Rate Cuts: The market is pricing in a 99% probability of a Fed rate cut next week. Low rates = An ideal environment for Gold.
Safe-Haven Demand: Political uncertainty (extended US Government shutdown) and lingering trade tensions boost safe-haven appeal.
Key Data: Delayed CPI data, expected on October 24th, will serve as a major market catalyst.
Summary: The fundamental momentum for an upside move is dominant and ready for a breakout.
📈 TECHNICAL ANALYSIS: The Perfect LONG Setup!
The chart shows Gold is correcting towards a powerful Demand Zone, where the Uptrend Line converges with a critical structural low.
🎯 Detailed Trading Strategy
We are looking to initiate a buy position as the price hits this demand zone:
Position: LONG (BUY) - Following the primary bullish trend
BUY ZONE (Entry):
$4,237
$4,235 (Key Demand Zone)
SL (Stop Loss):
$4,227 (Protecting the bullish structure's low)
TP (Take Profit Targets):
TP1: $4,245
TP2: $4,255
TP3: $4,265
TP4: $4,275
Final TP: Open (Expecting a New ATH around $4,450+)
REMINDER: This buy opportunity in the demand zone is strongly backed by macro factors (Fed & Instability). Always manage your risk!
#GOLD #XAUUSD #Fed #ATH #TechnicalAnalysis #TradeSetup

Double top resistance has pulled back as expected.Based on the 4-hour market trend, short-term resistance is currently at 4380-4383 on the upside, while support is at 4280-4293 on the downside. If bulls fail to achieve a sustained breakout, a period of volatile correction is imminent. Trading strategies should prioritize range-bound trading. In the middle, be cautious about buying orders and wait patiently for key entry points. I'll provide detailed trading strategies during the trading session, so stay tuned.
Short gold with a light position at 4375-4383, targeting 4295-4303. Hold if it breaks through!
Go long on gold if it retraces to 4285-4293, targeting 4365-4370. Hold if it breaks through!

Gold's massive market sweep!Yesterday's gold market was volatile. After confirming a high of 4375 in the Asian session, it began to decline. The decline continued throughout the Asian, European, and US sessions, breaking below 4200 and 4100, briefly dipping above 4080 before stabilizing slightly and rebounding in late trading. The daily chart finally closed with a large bearish candlestick pattern around 4130. For intraday trading, focus on the following points:
Price Analysis
Resistance: 4150, followed by 4190, then 4220, and then 4250.
Support: Around 4120, followed by 4100, then 4080, and then the 4010/4000 area.
Trend and From a timing perspective:
The prevailing pattern is a broad sweep and clean-up, characterized by rapid speed, large amplitude, and numerous turning points. This means that the current market trend is not a single directional issue. Within smaller timeframes, long and short positions can interact with each other, but it's crucial to focus on the timing of these shifts. Hitting the right nodes will yield gains for both long and short positions, while hitting the wrong nodes will also result in losses for both short positions. In other words, timing is crucial in the short term.
Based on the market's specific performance: A small double top formed above 4385, entering a broad sweep and clean-up phase. The first move at 4380... After testing 4180 and consolidating the resistance at 4380 for the second time, it broke below 4180 yesterday with a high of 4375, pushing the market down to 4080. In other words, judging by the daily chart structure, the first characteristic of this large-scale sweep cycle is the alternating yin-yang pattern on the daily chart. That is, after yesterday's significant yin-yang decline, if this cycle holds true today, consider a potential bullish trend today.
A bottoming-out followed by a pullback to a bullish close (of course, this is just a hypothesis and requires further market verification).
Looking at the current market performance, yesterday's high of 4375 retreated, testing 4240 in the European session, before consolidating again. The new low at 4130 is expected to be around 4090 and 4180 respectively. The market is currently trading at 4130 with a target of 4000 levels but with a resistance of 4000 levels at the moment and a move above 4130 as the support level. The sweeping correction requires consideration of the stabilization of the decline while short-term bears are gradually weakening and the trend is shifting upwards. Specifically, after breaking the high in the afternoon, a second buy attempt is made after a pullback. Here, a long position at 4116 is suggested, with continued upward movement before the European session, followed by a reduction at 4140 and a full profit at 4160. The current trend seems to confirm the previous view. The daily chart shows a sweeping cycle (with alternating negative and positive signals, the probability of a continuous rise and positive trend after today's bottoming out and rebound is relatively high).
With the bottoming out and stabilization and upward expansion confirmed, the next consideration during the European and American trading sessions is the continuity and strength. Here, the rhythm is also divided by spatial distribution:
From the perspective of support below:
1. The support zone for a breakout from the morning high and a pullback to consolidate is located in the 4100/4110 area (this is the dividing line for maintaining a bullish trend in the future). Holding above this level could result in a sweeping rally (above 4100) or a strong rally (around 4120). Conversely, if it falls below 4100, the Asian session will see an uptick. If it finds pressure in the European session and falls back below the dividing line, a wide range sweep between the highs and lows is expected.
Upper resistance zone:
4190/4200 area (the 0.5 dividing line is also the previous top-bottom conversion line). The spatial dividing line at 0.618 in the 4240/50 area is also the top-bottom conversion line before yesterday's European session decline, and is also the current middle track position on the four-hour chart.
In summary: A large-scale sweep and clean-up, with large and rapid shifts to long positions, does not have an absolute direction in the short term; it is more important to focus on the timing of the long-short transition to identify opportunities. The intraday deep squat and stabilization (slowing decline) suggest a low-to-long strategy at 4185. While holding lower in the afternoon, breaking the morning high and stabilizing, the short-term trend shifts to bullish (continue to hold long positions above 4116 and stretch again). The rhythm of the upcoming European and American sessions will be determined by gains and losses in spatial distribution. Hold above 4100, or conduct a sweep upward move above 4100, or a strong rally above 4120 (a break below 4100 would shift the short-term momentum, transitioning to a wide range-bound sweep based on the Asian session low of 4004 and the European session high). Focus on 4190/4200 and 4240/50 on the upside.
Operational:
1. Repeated dips above 4185 in the Asian session led to a push above 4130; subsequently, a dip above 4116 led to a profit above 4160.
2. Hold the 4100 level in the European and American sessions (a bullish sweep above this level still presents a potential upside opportunity, with support at 4105/4110. Defend against 4095). Below this level, the US market structure shifts and the US trading range re-orients.

THE KOG REPORT - UpdateEnd of day update from us here at KOG:
A good start to the week with the red box breaking at 4030 and our bias level targets completing again in one clean swoop. We had given the 4103-6 region as a potential turning point which can still happen but there is no sign of reversal as yet. For that reason, if we do come down and support, it's likely we'll see a bit higher for now into the 4130's which is where we may see a RIP if we continue without retracement! That's where I would like to wait as it's late session and the move up today has gone a bit too far to even consider any more long trades.
RED BOX TARGETS:
Break above 4030 for 4045✅, 4060✅, 4063✅ and 4072✅ in extension of the move
Break below 4620 for 4610, 4603. 3998, 3990, 3985 and 3960 in extension of the move
As always, trade safe.
KOG

XAU/USD Update 1Next move on the way, focus on proper risk management & stay discipline. Wishing you successful trades..!
Key Reason:
1. Price deeply grab all SSL.
2. Overall market structure was bullish.
3. Trendline respect.
4. 1H Fresh zone for buying.
5. Once price tap in our zone then switch into smaller time frame and look for bullish confirmation. Bullish move expected.
This is not a financial advise. Let's see how it will work.
