Gold final bull/bear battle level 4340 +/-. 21/Oct/25XAUUSD possible having triple top with strong seller taking control over bull near 4340 +/-..
Trade ideas

Gold Trade Plan 17/10/2025( Looking for 10000 Pips Profit !!!!)Dear Traders,
Gold, influenced by geopolitical factors, has continued its bullish trend without any significant correction and is currently trading around 4300. In my opinion, from this point onward, we should follow a bearish scenario — the price is expected to enter a corrective phase by the end of October. The best zone for entering a long-term position would be between 4420–4475, with a target of at least 10,000 pips from the top. There’s also a high probability that the correction will begin before reaching this zone.
Invalidation Level : 4650 !
regards,
Alireza!

Gold Intraday Trading Plan 10/22/2025Yesterday gold went wild and dropped almost 3k pips. This is crazy and it signals a few heavy selling sessions ahead. Therefore, I will look for selling opportunities from 4195. My first target is 4042. Ultimate target for today is 3965.

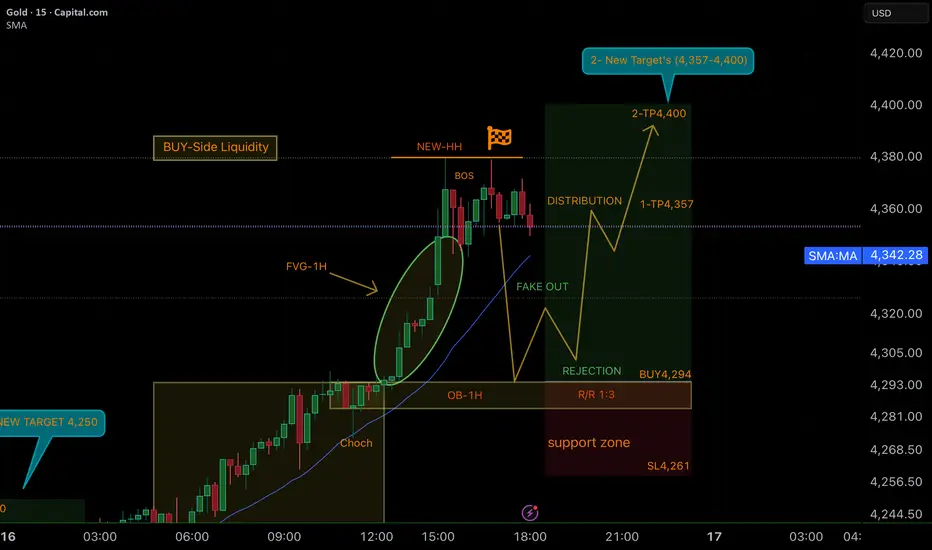
SMART MONEY CONCEPT (SMC)📊 Bullish Analysis XAU/USD (15M)
The market has shown a Change of Character (CHoCH) and respected the 1H Order Block (OB), creating a strong bullish impulse after mitigating the 1H Fair Value Gap (FVG).
Following this move, a Break of Structure (BOS) has occurred, forming a New Higher High (HH), which confirms institutional intention to drive price higher and capture liquidity.
🔑 Projected Scenario
• A possible Fake Out + Rejection around the 4,294 support zone.
• Entry at 4,294 with Stop Loss at 4,261 (Risk/Reward ratio: 1:3).
• First target (TP1) at 4,357.
• Second target (TP2) at 4,400.
📌 Key Takeaways
• Institutions are likely to manipulate liquidity before continuation.
• Patience is required for confirmation at the rejection zone.
• Scaling out profits at TP1 and TP2 gives both security and flexibility in trade management.
✨ Motivational Note
Smart trading is not about predicting; it’s about preparing. Patience and discipline are the strongest weapons of a professional trader. 🚀. GOOD LUCK TRADERS ;)
GOLD Long Trade TVC:GOLD / OANDA:XAUUSD Long Trade
Entry: 4259 - 4267
TP: 4350
This is good trade.
Don't overload your risk like Greedy gambler!!!
Be Disciplined Trader, risk what you can afford.
Use proper risk management.
Disclaimer: Trading is risky, only idea, not advice.

Gold's Historic Rally: Why It HappenedGold approaches $4,500 per ounce for the first time in history. Up more than 50% in less than a year. Everyone's asking the same question: Is this a historic breakout, or the setup for a massive crash?
The answer requires looking at three things: what brought us here, where we are technically, and what could go wrong.
PART 1: THE MACRO STORY
Gold doesn't just rally because people are "scared." It rallies because of structural shifts in how the world's largest institutions view money, risk, and trust.
Central Banks Are Buying Gold at Record Pace
Here's a number that should get your attention: Central banks bought 1,045 tons of gold in 2024. That's the second-highest annual total on record.
In 2025, the buying hasn't slowed down. Poland alone has accumulated 67 tons year-to-date. Turkey, India, Kazakhstan, and others are following suit.
But here's what's really happening: This isn't about inflation hedging. If it were, Western central banks (US, Europe) would be buying too. They're not. Instead, emerging market central banks are diversifying away from the dollar.
Why? Because they watched what happened in 2022 when the US froze Russian reserves. When you hold dollar-denominated assets, they can be weaponized. Gold can't be sanctioned. Gold can't be frozen.
Central banks don't panic sell on a 5% dip. When they buy, they hold. This creates a structural price floor. Every pullback gets accumulated.
What this means: Central bank buying is the foundation of this rally, not a temporary catalyst.
The Federal Reserve is Cutting Interest Rates
According to the CME FedWatch Tool, there is a level of certainty that the Fed would cut rates in October 2025, with markets pricing in another cut in December this year.
When interest rates fall, something important happens to gold: its "opportunity cost" decreases.
Here's the simple version: Gold pays no interest. So when bonds also pay almost nothing (after inflation), holding gold looks pretty reasonable. But when real yields are high, bonds look better and gold looks worse.
Right now, the market is pricing in lower real yields ahead. That's bullish for gold. If the Fed doesn't cut as much as the market expects, that changes everything.
What this means: Rate cuts fuel the rally.
Geopolitical Instability & Currency Debasement
Global tensions remain elevated: Middle East instability, US-China friction, and the ongoing Russia-Ukraine conflict. But that's not the real driver here.
The real driver is the loss of faith in government money.
Gold is at an all-time high, not just in US dollars. It's also hitting all-time highs in euros, yen, and yuan. This isn't a dollar story. This is a global reassessment of what "money" actually means.
Meanwhile, the US national debt is over $35 trillion. Debt-to-GDP is at World War II levels. Other countries (Japan, Europe) are in similar situations, printing money and running massive deficits.
When governments print excessively, investors need a hedge. Gold can't be printed.
What this means: As long as deficits remain high and geopolitical chaos persists, gold has structural demand that goes beyond cycles.
The Bottom Line
Three powerful forces are all pushing in the same direction:
Central banks structurally accumulating gold (de-dollarization)
The Fed cutting rates (lower real yields = gold support)
Global monetary instability (currency debasement = safe-haven bid)
This combination hasn't existed in most traders' lifetimes. That's why this rally feels different. And why it's lasted this long.

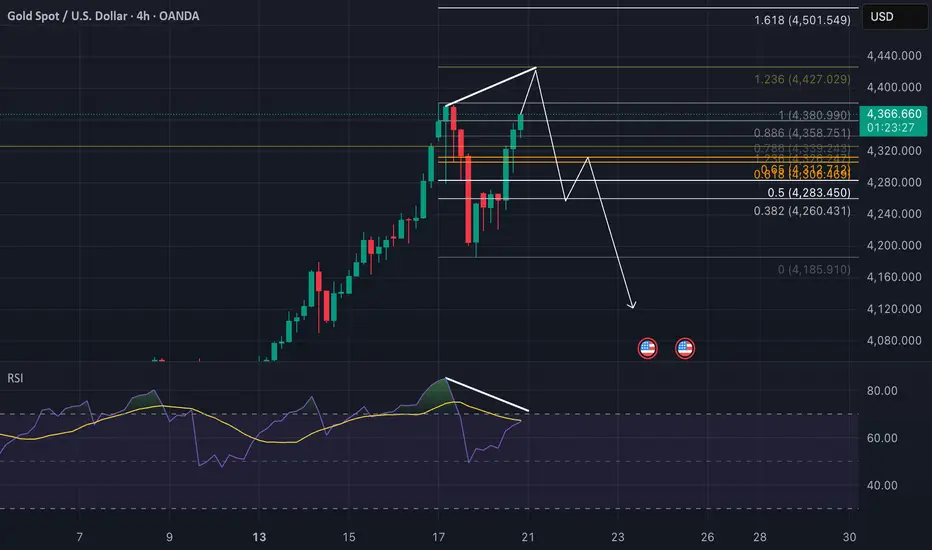
Where we can find* reversal on Gold? (*try to)Gold is showing some wild moves lately, and I think a reversal might be on the horizon based on a possible divergence on the RSI. Check out this 4-hour chart from TradingView—let’s break it down!
The Setup:
We’ve seen gold climbing recently, hitting a peak around $4,380 before dropping back. The RSI looks like it’s diverging, hinting that momentum might be fading that could be a sign of a reversal incoming!
* Two Possible Plays
1) Double Top & Retest: We might see a double top forming, followed by a drop to retest the recent bottom liquidity levels around $4,120-$4,160.
2) Divergence & Retest: The RSI divergence could lead to the same retest of those bottom liquidity levels, giving us a chance to see where it bounces.
Key Technicals: RSI is showing a potential divergence aka momentum weakening while price peaked.
Support zone sits around $4,120-$4,160.
Resistance is near the recent high of $4,366.
Trade Idea (not financial advice):
Watch for a break below $4,160 to confirm the retest, or a bounce from there for a potential long. If it drops past $4,080, might be time to rethink. Targets? Could/or would climb back to $4,366 or higher if momentum kicks in!
Summary:
Gold’s at a crossroads with a possible reversal brewing. Whether it’s a double top or RSI divergence, the next move might retest those lower levels. Keep an eye on it, it can get interesting soon!
P.s. sure it can also continue its growth, so before proceeding with any type of entry find your reversal structure on lower timefrae. GL!
BUY XAUUSD (GOLD)Based on our deep analysis we can see that gold (XAUUSD) will keep heading to the upside.... BUY!

GOLD (XAUUSD) – Waiting for the Retest, Not Chasing the MoveGold has pulled back after a strong run, but I’m not interested in buying blindly here.
Instead, I’m watching for a clean retest of the previous support zone before looking for a long setup.
⚙️ My plan
Wait for price to revisit and retest the blue support area.
Look for confirmation: rejection wick, structure shift, or bullish candle close.
Enter only after the retest — no guessing, no early entries.
Target: around 4 970
Invalidation: below recent lows
🧠 Why
Gold has shown strong momentum recently, but every trend needs a healthy pullback before continuation.
I prefer to trade reaction, not prediction — waiting for the market to prove it’s ready to move higher.
⚠️ Risk & mindset
If support fails, I’m staying flat.
Discipline > prediction. The best trades are often the ones you don’t take too early.
💬 What’s your plan on gold this week?
Are you buying the dip or waiting for confirmation too?
Follow for more structured trade ideas based on clear entries, not emotions.
#GOLD #XAUUSD #forex #tradingstrategy #technicalanalysis #retest #priceaction #education #daytrading

XAUUSD – Buy SetupAfter a sharp pullback from highs, Gold is testing support with strong rejection — potential for a bullish bounce continuation.
Buy Entry: 4225
Stop Loss: 4210
Take Profit: 4370
📈 Bias: Bullish Continuation
⚠️ For educational purposes only.
#XAUUSD #Gold #BuySignal #Forex #TradingSetup #PriceAction

XAUUSD: Market Analysis and Strategy for October 17Gold Technical Analysis
Daily Resistance: 4500, Support: 4059
4-Hour Resistance: 4380, Support: 4176
1-Hour Resistance: 4380, Support: 4280
Gold continued to rise by over $100 yesterday, reaching a high of 4380 in today's Asian session. At this rate, the next move is 4500.
Of course, this won't be the final target of this market rally.
In the short term, although there was a sharp drop of $100 in Friday's Asian session, it was quickly recovered, resulting in a V-shaped reversal, indicating that bullish sentiment has not subsided. The probability of setting a new high today, or even reaching 4400, remains high.
Operationally, continue to look for buying opportunities today. If the decline can be halted around 4330 or 4300, then continue to enter the market.
BUY:4330near
BUY:4300near
BUY:4280near

Is it possible to see gold drop by 1000 points?Here in this scenario I followed the classic analysis, the equal tops pattern and the Volium strategy.
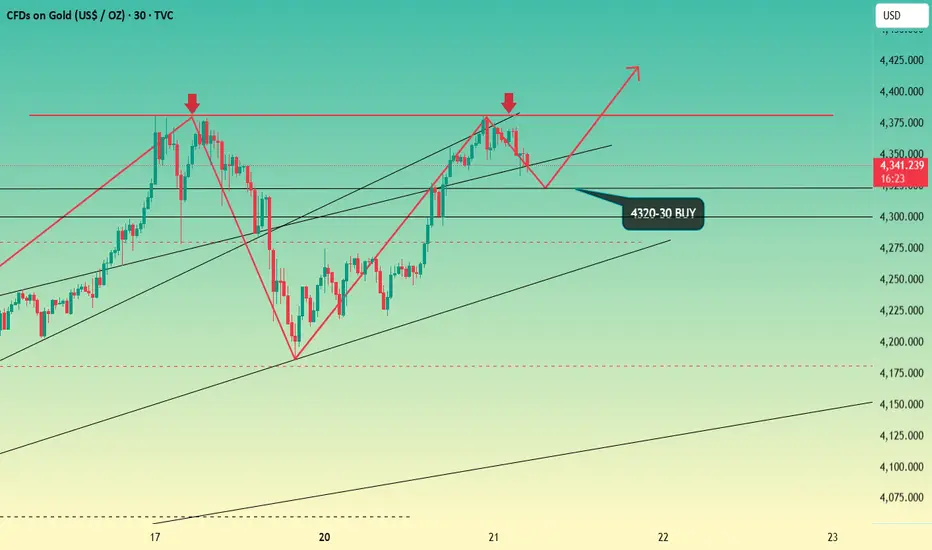
Gold bulls hit new highs, go long on dipsGold directly recovered Friday's losses and hit a new high yesterday, which undoubtedly reflects the strength of the bulls. As mentioned in my post yesterday, with the support level of 4218 held, the low points have been gradually moving up, and a breakthrough above 4280 was only a matter of time. After breaking through 4280, the price surged all the way to a high of 4381, before starting to decline slowly. The gold bulls have risen again, and the current correction ended in the form of a rapid adjustment, allowing gold to return to the bull market.
From a technical perspective, the short-term correction has been repaired, and the price has moved back above all major moving averages, indicating that the market has regained its strength. The 1-hour moving average is still diverging upward in a bullish trend, leaving room for further upside in gold. Additionally, factors such as the U.S. debt crisis, the U.S. dollar credibility crisis, risk-aversion sentiment, and the interest rate cut cycle are driving gold prices higher. As long as these issues are not resolved or mitigated, the escalating contradictions will inevitably push the price to rise further.
Today's Strategy: If gold pulls back to the range of 4320-4330, consider going long on gold appropriately and set up a stop-loss order for risk protection.
XAUUSD EXTENDS BULLISJH MOMENTUM TOWARDS $4350 & $4450 TARGET.Technical Overview
Current Price: $4,292.85
Support Zone: $4,000 – $4,050
Resistance Zone: $4,450 – $4,500
Trend: Bullish (ascending channel)
🔹 Chart Analysis
The price is moving steadily inside the upward channel, respecting both upper resistance and lower support trendlines.
A short-term retracement may occur near the $4,350 zone (first target), aligning with mid-channel resistance before continuing toward the final target around $4,432–$4,450.
The market shows strong bullish candles, confirming buying pressure with limited corrective dips.
The support base near $4,150 remains strong — as long as this zone holds, the bullish trend is expected to continue.
🔹 Price Targets
First Target: $4,350
Final Target: $4,432 – $4,450
Stop-Loss (if trading): Below $4,200 (trendline support)

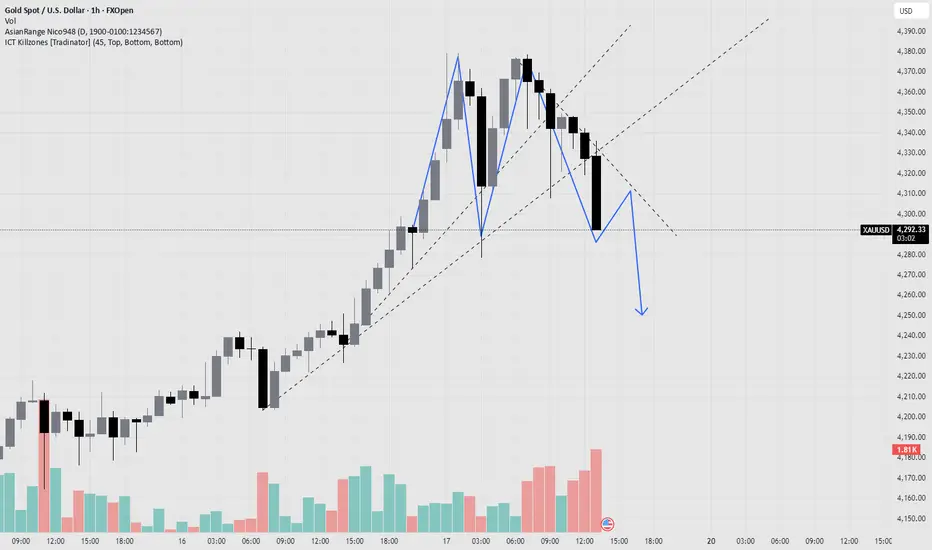
GOLD TIMEFRAME H1 VIEWThis view from my personal view.
You can mark the level that i mark in the chart. i not say this 100% accurate but all the zone i make using H1/H4 zone.
im just sharing the setup or mapping with you guys.
Trade at your own risk. Good Luck

Gold have chance for growth again what's should nextGold has entered a correction phase following a strong bullish move earlier in the month. The price action is currently consolidating within a range, suggesting the market is preparing for its next directional move.
Technically, gold recently reached a record high, prompting many traders to close long positions and take profit. This has led to a gradual shift in market sentiment, with short-term pressure toward the downside at present, the 4,000 level is emerging as a key support zone, where buyers may look to re-enter the market. If the price holds above this area, a bullish recovery could follow on the upside, the next resistance levels are seen at 4,100 and 4,150.
A sustained break above these zones could open the way for renewed bullish momentum.
However, the broader dynamics will depend heavily on upcoming fundamental catalysts, particularly developments in global trade negotiations and macroeconomic data influencing risk sentiment and the U.S. dollar.
You can find more details in the chart.
Trade wisely / Best of luck buddies.
Ps; Support with like and comments for better analysis Thanks for Supporting.

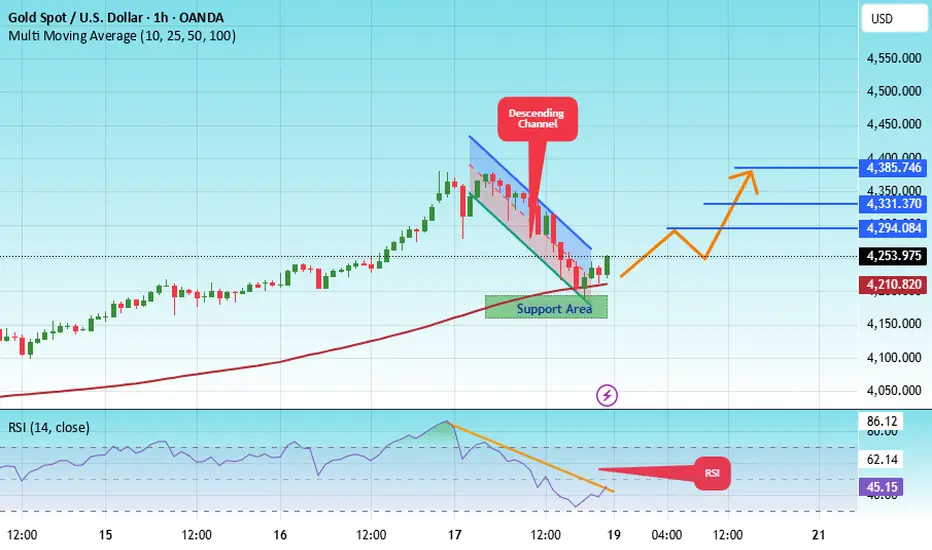
#XAU/USDT Bullish Reversal from Key Support Zone Targeting 4,3#XAU
The price is moving within a descending channel on the 1-hour frame, adhering well to it, and heading for a strong breakout and retest.
We have a bearish trend on the RSI indicator that is about to be broken and retested, which supports the upward move.
There is a major support area in green at 4150, which represents a strong support point.
We are heading for consolidation above the 100 moving average.
Entry price: 4253
First target: 4294
Second target: 4331
Third target: 4385
Don't forget a simple matter: capital management.
When you reach the first target, save some money and then change your stop-loss order to an entry order.
For inquiries, please leave a comment.
Thank you.
GOLD XAUUSD STRUCTURE+FIBONACCIGOLD RALLY COOLS off after a massive buy from Asian /London session but newyork didn't accept gold buying
the golden ratio zone held price for buy.
#gold #xauusd

XAUUSDGold is currently trading near $4,229, showing signs of exhaustion after a strong bullish run within a rising wedge pattern. The price has recently broken below the wedge support, and a bearish divergence is visible on the RSI, indicating weakening momentum.
🔹 Key Zone: The grey area around $4,220–$4,230 may act as a short-term retest zone.
🔹 Bearish Outlook: If price fails to reclaim the wedge support, a continuation move toward the $4,107 support zone is likely.
🔹 Further Support: Below that, next key level sits around $4,015.
🔹 Bias: Short-term bearish correction expected unless price breaks back above $4,235 with strong momentum

GOLD BEARISH BIAS|SHORT|
✅XAUUSD broke its main ascending trendline, and gold is now showing bearish structure with potential continuation toward the next downside target. Price has retested the broken trendline before extending lower and we are seeing a clear rejection.Time Frame 2H.
SHORT🔥
✅Like and subscribe to never miss a new idea!✅


GOLD (XAU/USD) – FINAL GRAND CYCLE ANALYSIS🟡 GOLD (XAU/USD) – FINAL GRAND CYCLE ANALYSIS
“The Rise of Real Money in a Failing Fiat World”
Elliott Waves | Fibonacci | Smart Money | Macro Fundamentals | Market Psychology
📅 Date: October 22, 2025
📍 Current Price: ~$4,039/oz
⏳ Time Horizon: 1970s to post-2050
🎯 Focus: Multi-decade Elliott Wave structure signaling the endgame for fiat currencies
🌐 SUPER CYCLE NARRATIVE – GOLD’S MONETARY METAMORPHOSIS
🔵 Wave I (1971–1980): The Rebirth of Real Money
Gold's first major secular rally began when the Bretton Woods system collapsed and President Nixon ended the U.S. dollar’s convertibility to gold in 1971. Gold soared from around $35 to nearly $875 by 1980. This wave was driven by runaway inflation, the oil embargo, and shattered confidence in fiat money.
🔴 Wave II (1980–1999): The Great Fiat Illusion
Following the 1980 peak, gold entered a brutal 19-year corrective phase, falling to the $250 zone. During this time, the U.S. dollar gained strength, Volcker’s interest rate hikes reined in inflation, and a new era of debt-based prosperity and stock market euphoria unfolded. Gold was dismissed, even by central banks who sold reserves. Structurally, this corrective phase formed a complex WXYXZ pattern , setting the groundwork for the massive Wave III rally.
🟢 Wave III (1999–~2033): The Fiat Reckoning Has Begun
This is the longest and most powerful supercycle wave and the one we are currently in. It is subdivided into five impulsive macro waves. As of now, gold is deep within Wave iii of III , the most explosive phase of the entire structure. The current rally is no longer driven by inflation fears but by existential doubts about the long-term viability of fiat currencies.
📈 Wave I of III (1999–2011): The Institutional Accumulation
Gold rose from around $250 to $1,920 over this period. Triggers included the dot-com bust, 9/11, the 2008 global financial crisis, and the launch of the first gold ETFs like GLD. This wave marked the beginning of institutional interest in gold as a systemic hedge.
📉 Wave II of III (2011–2015): The Disbelief Correction
Gold corrected nearly 45%, bottoming near $1,050. The narrative shifted — QE hadn't caused hyperinflation, the stock market was booming again, and faith in the dollar resurged. Retail abandoned gold, but institutional buyers quietly accumulated from newly created demand zones.
🚀 Wave iii of III (2015–~2026): The True Price Discovery Phase
This is where we are now. Since 2015, gold has exploded upward, driven by COVID-era QE, negative real interest rates, geopolitical instability, and major central banks accumulating gold for cross-border settlements outside the dollar system.
We are currently in the middle of this wave — micro wave (3) of iii — with price around $4,039. According to Fibonacci projections, this wave is expected to peak near $6,552 , corresponding to the 2.618 extension level . If bullish momentum continues, gold could overshoot toward $22,744 , matching the 3.618 Fibonacci extension and marking the likely top of macro Wave III.
In an extreme scenario where fiat trust collapses entirely, the 4.618 extension projects a possible target of $78,940 . All of these levels align with the upper bounds of the long-term logarithmic channel, validating both structure and projections. But most likely this target is for Wave V TOP .
🟣 Wave IV (Projected: 2026–2033): The Great Shakeout
After the parabolic run of Wave iii, a deep multi-year correction is likely. This correction — Wave IV — may retrace toward the long-term red trendline and could coincide with a temporary return to “faith” in fiat through reforms like CBDC rollouts or aggressive fiscal pivots.
This wave could resemble a WXY pattern or large ABC structure and may unfold alongside capital controls, deflationary pressure, and a resurgent tech or dollar narrative. However, this will likely be the last major buying opportunity before gold enters its final, euphoric revaluation.
🟢 Wave V (2033–2045+): The Final Blow-Off Top
Wave V is expected to be driven by an overt crisis of confidence in the global fiat system. Scenarios could include:
Mass adoption of gold-backed or commodity-tied digital currencies
Loss of global trust in the USD as the reserve currency
BRICS or emerging alliances introducing gold into cross-border settlements
Global central banks returning to physical gold as a monetary base
The upside potential here is monumental. The 4.618 Fibonacci extension already targets $78,940 , but under full systemic collapse or monetary reset conditions, gold could reprice toward $100,000–$250,000 per ounce — not as a bubble, but as a return to its role as sound, base-layer money.
📐 Fibonacci Milestones and Structure Alignment
Each major wave has closely respected its corresponding Fibonacci extension. Wave I topped around the 1.618 level ($1,887) . The ongoing Wave iii appears on track to reach the 2.618 level ($6,552) . From there, macro Wave III could stretch toward 3.618 ($22,744) . If Wave V extends fully, a 4.618 projection leads to $78,940 — all within the bounds of the established logarithmic trend channel. In a full-blown systemic reset, price could break even higher.
These levels are not speculative but grounded in structural alignment with Elliott wave geometry , Fibonacci mathematic s, and long-term institutional order flow .
🧠 Smart Money Concepts & Technical Validations
Smart money activity has left clear fingerprints across this cycle. Each break of market structure (in 2016, 2020, and 2023) confirmed higher time-frame bullish continuation. Institutional demand zones — especially during the 2018–2019 consolidation and 2022 pullback — were respected to the dollar.
This cycle isn’t retail-driven mania — it's a stealth institutional accumulation that’s now evolving into price discovery.
📊 Market Psychology Across the Cycle
Investor sentiment has followed classic psychology stages:
From 1999 to 2004, disbelief reigned: “Gold is dead.”
Between 2005 and 2011 came growing awareness: “Gold might work again.”
The 2011–2015 correction brought denial: “It was just a bubble.”
Hope returned in 2016–2020 as price quietly rallied.
From 2022 to 2026, euphoria dominates: “Gold will never go down.”
Wave IV will likely bring fear and capitulation between 2026 and 2033.
Finally, Wave V will ignite mania: “Gold to the moon!”
🚨 Final Synthesis: What This All Means
We are living through the largest repricing of monetary value in modern financial history. Gold is no longer just an inflation hedge — it’s becoming a hedge against the system itself . The structure on the chart doesn't just map price — it maps the collapse of fiat trust and the return of monetary sanity.
Gold is transitioning from:
A commodity hedge →
To a central bank hedge →
To a currency hedge →
And finally, to a system hedge
The current leg — Wave iii of III — is nearing its climax. After a correction in Wave IV, Wave V could take gold into previously unthinkable territory, not because gold changed — but because everything else did.
📌 Final Position Summary
We are currently in wave (5) of iii of III — the most powerful segment of the bull run
The next Fibonacci target is $6,552
The broader Wave III could peak near $22,744
After a correction (Wave IV), the final wave could send gold toward $78,940 , or even into the $100,000–$250,000 zone under extreme monetary reset conditions
This is not a mere forecast — it’s a macro-monetary blueprint for the coming decades.
🌊 "Those who understand the waves will ride them. Those who don’t will be swallowed by the tide." – FIBCOS
📘 Disclaimer: This is an educational market outlook based on technical and macroeconomic structure. It is not financial advice. Always do your own due diligence and risk management.
#XAUUSD #Gold #GoldAnalysis #ElliottWave #Fibonacci #SmartMoneyConcepts #PriceAction #TechnicalAnalysis #MarketStructure #Commodities #InflationHedge #MacroEconomics #CentralBanks #BRICS #MonetaryReset

Gold healthy pull back , no panicIf this current support level does not hold out, then we can see price heading further south towards 4050 price level. Here, I will be accumulating......Watching closely for now......
