Global Uncertainty, Fed Moves, and the Golden Opportunity AheadHey everyone, good to see you here. Let’s unpack what’s been happening with gold after another explosive week in the markets.
Last Friday, gold pushed to new record highs, touching close to 4,400 before heavy profit-taking kicked in during the US session. The pullback shaved roughly 165 off the top, but even with that drop, gold still managed to close the week nearly 6% higher. That makes it nine straight weeks of gains — an incredible run we haven’t seen in years. Since this short-term rally began, gold’s climbed more than 25%, outperforming the 2020 surge that once shook the market.
So what’s driving this strength? It’s a mix of global uncertainty, geopolitical tensions, and traders positioning around the Fed’s policy shift. Rate cuts and the looming risk of a US government shutdown have added volatility, but also reinforced gold’s status as a safe-haven play. Every dip so far has been met with buyers stepping in confidently — a clear sign that sentiment remains firmly bullish.
Technically, the 4,200 zone stands out as key support. As long as price holds above it, the “buy-the-dip” strategy stays valid. The Fibonacci retracements around 0.5 and 0.618 align perfectly with this level, highlighting an area where buyers could reload before the next leg up.
If momentum keeps building, the path toward 4,500 looks open and realistic. The trend is strong, the fundamentals are supportive, and gold continues to attract both institutional flows and retail interest.
Right now, gold isn’t just shining — it’s commanding attention. The question is, are you watching closely enough to catch the next move?
Trade ideas

GOLD (XAUUSD): The Next Resistances
Here are the next potentially significant psychological resistances
too look at on Gold for pullback.
Resistance 1: 2198 - 2203 area
Resistance 2: 2248 - 2253 area
Resistance 3: 2298 - 2303 area
In case of a start of a bearish move,
consider the underlined supports for buying.
❤️Please, support my work with like, thank you!❤️
I am part of Trade Nation's Influencer program and receive a monthly fee for using their TradingView charts in my analysis.

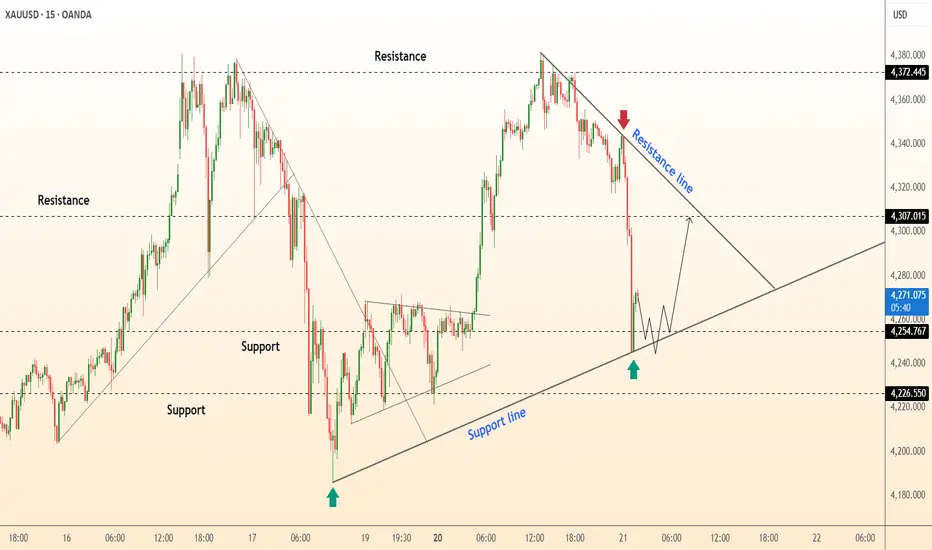
DeGRAM | GOLD held the support line📊 Technical Analysis
● XAU/USD rebounded from the 4,226 support area, confirming the strength of the rising trendline and signaling a potential short-term recovery.
● A break above 4,254 could trigger a bullish continuation toward 4,307, with the upward trajectory supported by a well-formed correction structure after the recent drop.
💡 Fundamental Analysis
● Gold gains support from weaker U.S. yields and safe-haven demand amid ongoing geopolitical concerns and Fed policy uncertainty.
✨ Summary
● Long bias above 4,226; targets 4,254–4,307. Trendline support and improving fundamentals favor a short-term bullish rebound.
-------------------
Share your opinion in the comments and support the idea with a like. Thanks for your support!
GOLD/XAUUSD Long Trade Risking 1% to make 2.23%TVC:GOLD / OANDA:XAUUSD Long Trade
Entry: 4259 - 4266
TP: 4354
This is good trade.
Don't overload your risk like Greedy gambler!!!
Be Disciplined Trader, risk what you can afford.
Use proper risk management.
Disclaimer: Trading is risky, only idea, not advice.

GOLD XAUUSD CORRECTION CHART USING FIB to predict the current sell direction in combination with market structure we hope for a retest on the broken demand floor to sell again .
#gold #xauusd

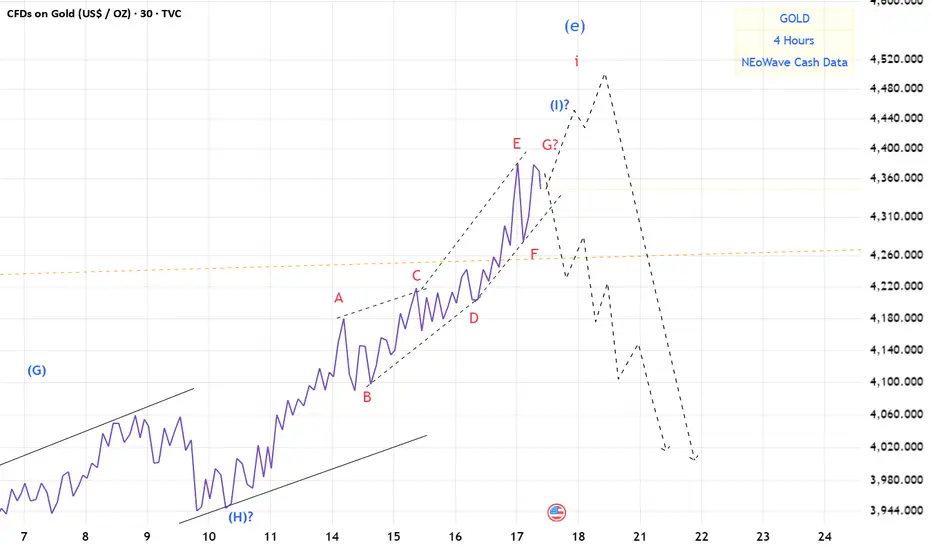
Gold(based on NEo wave)maybe here is the end of wave i.
based on Dow theory good news on top.
crazy people are buying gold.
I think soon we will see crash of gold.
market will not be bullish forever.
Could Gold Recover After Yesterday's CrashGold saw its biggest single-day drop since the infamous 2013 crash. Back then, I was inexperienced, but with some luck and perhaps a bit of reckless bravery, I managed to secure a tidy profit. Unfortunately, my more experienced self missed most of yesterday’s move :)
Now that gold has reached the double-top target near 4000, a short-term bounce could be on the way. However, volatility remains high, making gold a risky trade at the moment.
My plan is to enter around current levels, targeting a recovery toward the 61.8% retracement of the recent drop. It’s a calculated gamble, but the risk-reward ratio looks acceptable, at least for me.

GOLD fell nearly $300, the biggest one-day drop since 2021The precious metals market witnessed a sharp decline in the trading session on Tuesday (October 21), when the spot gold price fell more than 5%, marking the sharpest decline in 4 years. This correction came after many consecutive weeks of increase, when gold continuously set new peaks and reached overbought levels on technical indicators.
As of the time of recording, the spot gold price decreased by 5.21% to 4,129.05 USD/ounce, after falling below the 4,100 USD/ounce mark at one point, meaning a loss of nearly 300 USD compared to the highest level of the day. Previously, on Monday, gold had peaked at about 4,381.52 USD/ounce, before turning down nearly 3.8%.
Strong Dollar Slows Gains
The stronger US Dollar has made dollar-denominated gold more expensive, weighing on demand.
Weakening safe-haven sentiment has also contributed to the sell-off. Expectations of a meeting between US President Donald Trump and Chinese President Xi Jinping next week to ease trade tensions have dampened demand for the precious metal. In addition, the peak gold buying season in India, one of the world’s largest consumer markets, has ended, dampening physical demand.
Markets lose position data, volatility soars
The partial U.S. government shutdown has left traders without access to the Commodity Futures Trading Commission’s (CFTC) weekly speculative positioning report, data used to measure hedge fund participation in gold and silver contracts. The lack of positioning data makes the market more sensitive, especially when speculative buying increases during volatile times.
The volatility has pushed short-term volatility in the precious metal to its highest level in months. Options trading volume on the world’s largest gold ETF exceeded 2 million contracts for two consecutive sessions, a new record, suggesting investors are rushing to hedge or take advantage of volatility to seek profits.
Experts warn of the risk of a deeper correction
According to Bloomberg Intelligence strategists, gold ETF holdings are still below historic highs, suggesting there is still room for a bull run. However, they warn that “every rally has its limits,” and that excessive speculative buying often turns into selling pressure when economic data improves.
“If upcoming economic reports show a stronger-than-expected U.S. economy, a deeper correction in gold is entirely possible,” the report said.
Silver also under pressure after a strong run
Silver, the metal, has risen nearly 80% since the start of the year thanks to tight supplies and rising investment demand that has followed gold’s slide. The widening price gap between London and New York has prompted traders to move the metal to the UK to ease supply and demand pressures.
According to exchange data, treasuries linked to the Shanghai Futures Exchange recorded the largest silver withdrawals since February, while inventories in New York continued to fall, reflecting a restructuring of global supply amid the market correction.
In short, after a long rally and high expectations, the gold market is entering a “necessary cooling” phase. While the long-term trend is still supported by geopolitical risks and loose monetary policy, short-term volatility is likely to remain high as the market reassesses yield expectations, inflation and the health of the US economy.
Technical Analysis OANDA:XAUUSD
The daily chart of gold shows that after a strong increase to the peak around 4,380 - 4,400 USD/ounce, the price has entered a rather deep technical correction phase, touching the Fibonacci support zone of 0.618 around 4,110 USD/ounce corresponding to the EMA21 line.
The strong bearish candle has been partially absorbed, indicating that the selling pressure is weakening and the downward momentum is showing signs of slowing down.
The RSI indicator has escaped the overbought zone and is approaching the neutral level (50), reflecting the state of re-accumulation after the correction. As long as the price remains above the 4,036 - 4,110 USD/ounce zone, the medium-term bullish structure has not been broken.
Overall, gold is in a "breathing" phase after a steep increase, and if it holds support at $4,110/ounce, the prospect of returning to the main uptrend in the coming weeks is very positive.
SELL XAUUSD PRICE 4231 - 4229⚡️
↠↠ Stop Loss 4235
→Take Profit 1 4223
↨
→Take Profit 2 4217
BUY XAUUSD PRICE 3949 - 3951⚡️
↠↠ Stop Loss 3945
→Take Profit 1 3957
↨
→Take Profit 2 3963

XAU/USD BUY SETUP WITH FOR TREND TRADERS by MrPhotonIt tested the long-term trend with the wick below, but the upcoming US-China agreements may show an increase in the long term with volatility, so I am placing my stop loss level at 4040 and targeting a long position in the coming days.

XAU/USD 20 October 2025 Intraday AnalysisH4 Analysis:
-> Swing: Bullish.
-> Internal: Bullish.
Price has printed as per previous intraday expectation by printing a bearish CHoCH which indicates, but not confirms, bullish pullback phase initiation.
Price is currently trading within an established internal range, however, I will continue to monitor price with regards to depth of pullback.
Intraday expectation:
Price to continue bearish, react at either discount of 50% internal EQ, or H4 supply zone before targeting weak internal high priced at 4,380. 990.
Note:
The Federal Reserve’s sustained dovish stance, coupled with ongoing geopolitical uncertainties, is likely to prolong heightened volatility in the gold market. Given this elevated risk environment, traders should exercise caution and recalibrate risk management strategies to navigate potential price fluctuations effectively.
Additionally, gold pricing remains sensitive to broader macroeconomic developments, including policy decisions under President Trump. Shifts in geopolitical strategy and economic directives could further amplify uncertainty, contributing to market repricing dynamics.
H4 Chart:
M15 Analysis:
-> Swing: Bullish.
-> Internal: Bearish.
I have been mentioning in my alternative scenario for almost 1-month that all higher timeframes are requiring a pullback, and we are seeing a narrowing of internal structure, price could target strong internal low. This is how price printed.
Price has printed a bearish iBOS after a very long duration and subsequently a bullish CHoCH to indicate, but not confirm bullish pullback phase initiation.
The bearish iBOS has also confirmed the swing-high.
Intraday expectation:
Price to continue bullish, react at either premium of 50%, or M15 demand zone, before targeting weak internal low priced at 4,185.910.
Note:
Gold remains highly volatile amid the Federal Reserve's continued dovish stance, persistent and escalating geopolitical uncertainties. Traders should implement robust risk management strategies and remain vigilant, as price swings may become more pronounced in this elevated volatility environment.
Additionally, President Trump’s tariff announcements, particularly against China, are expected to further amplify market turbulence, potentially triggering sharp price fluctuations and whipsaws.
M15 Chart:

XAUUSD: Unstoppable Surge - Is Capital Leaving Bitcoin for Gold?XAUUSD: Unstoppable Surge - Is Capital Leaving Bitcoin for Gold?
Hello traders community,
XAUUSD (Gold) is showcasing extraordinary strength, continuously breaking records and reaching new heights. The upward momentum seems to have no end, despite technical indicators entering the "overbought" zone. While Gold shines, the Crypto market is witnessing selling pressure, indicating a clear shift of safe-haven capital.
This analysis will delve into the factors driving the market and outline a detailed trading strategy for this tidal wave.
📰 Macro Analysis & Capital Flow
The market is being driven by a very clear narrative: Capital is seeking the ultimate safe haven.
Gold Ascends, Bitcoin Challenges: The contrasting movements between the two assets considered "digital gold" and "physical gold" are the most notable highlights. While XAUUSD continuously peaks, Bitcoin has plummeted sharply after hitting a historical high, currently struggling at the critical support level of $107,000. If this level is breached, a new wave of selling could be triggered, further driving capital flow towards Gold.
"Doping Boost" from the US Economy: Gold's strength is bolstered by the weakening USD. Factors such as the US government facing a potential shutdown and particularly the market betting that the Fed will continue to cut interest rates to support the slowing economy have reduced the allure of the greenback and interest-bearing assets.
Global Uncertainty: Not to mention the trade uncertainties and escalating geopolitical tensions. In a risk-laden environment, Gold is always the top choice for institutional investors and central banks to preserve value.
📊 Technical Analysis
The M30 chart shows a perfect and sustainable bullish structure.
Ascending Channel: Price is moving very disciplined within a steep ascending channel. The lower support line of the channel is an extremely important dynamic support area.
Main Support Zone - "Buy Zone": The $4285 - $4287 area is a confluence of the lower channel line and old structural zone. This is an ideal area for Buyers to wait, watching for pullbacks to join the main trend.
Resistance and "Breakout": Price has formed a short-term sideways structure after forming a peak around $4380. A confirmed "breakout" through this area will open up further upside potential, aiming for higher liquidity zones.
Next Target - "Sell Liquidity": The liquidity zone for Sellers and also the expansion target of this bullish wave lies at $4468 - $4470, corresponding to the 1.618 Fibonacci Extension level. This is where profit-taking pressure and sellers may emerge.
🎯 Detailed Trading Plan
The main strategy is "Buy the Dip" - Watch for buying opportunities when price pulls back to key support zones. Selling should only be considered when there is a clear reversal signal at strong resistance areas.
Scenario 1: Buy the Trend (Priority) 📈
Entry Zone: $4285 - $4287.
Stop Loss: $4280.
Take Profit: $4310 - $4355 - $4377 - $4400.
Scenario 2: Sell the Rally (High Risk) 📉
Entry Zone: Watch for selling at the liquidity zone above $4468 - $4470.
Stop Loss: $4476.
Take Profit: $4453 - $4423 - $4410 - $4388.
Summary
Gold's rally is supported by both technical factors and solid macro narratives. Although prices are in the overbought zone, the saying "never fight a strong trend" is entirely accurate at this moment. Minor pullbacks, potentially to the EMA or lower channel line, should be seen as opportunities to increase Buy positions.
Trade with discipline and manage your capital tightly. Wishing everyone a successful trading day!
Follow me for the earliest strategies


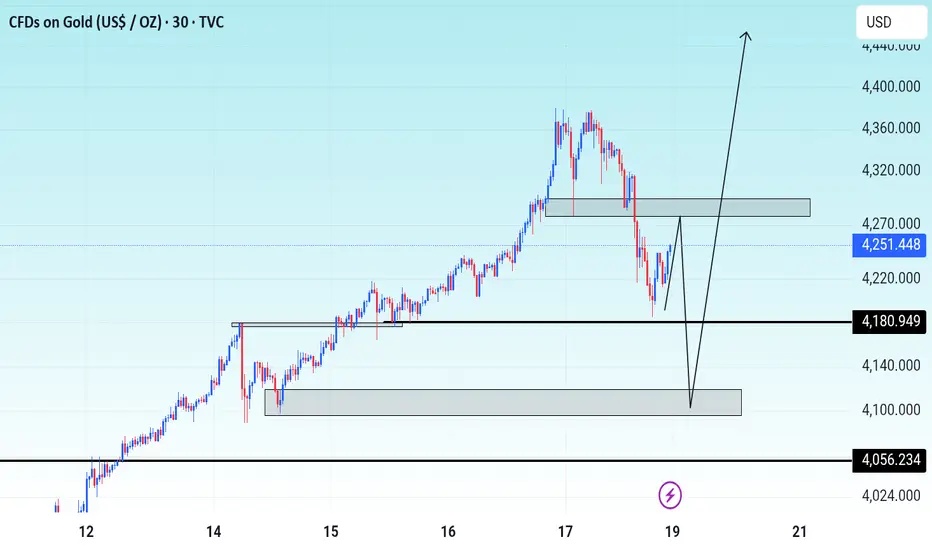
Will Gold buys continue for this week? TVC:GOLD price has dropped to $4 180 support level then looks like it might be going for a rest for the $4290. But question is will the $4056 level hold for bulls or will it break that level? What are your predictions for Gold guys? lemme know on the comment session.
GOLDPreferably suitable for scalping and accurate as long as you watch carefully the price action with the drawn areas.
With your likes and comments, you give me enough energy to provide the best analysis on an ongoing basis.
And if you needed any analysis that was not on the page, you can ask me with a comment or a personal message.
Enjoy Trading ;)

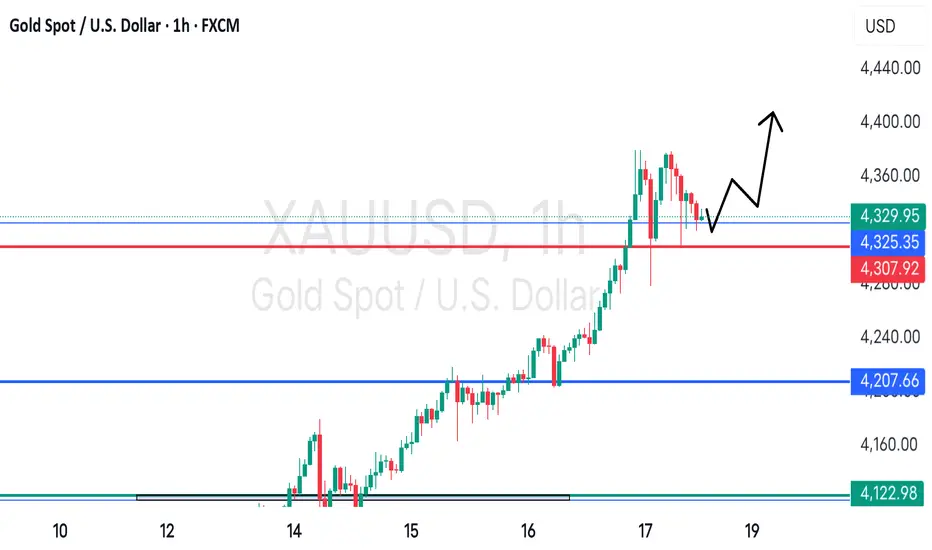
Gold Tests Broken TrendGold is extending toward the broken trendline and could face rejection around this level. For the stop, I’ll place it just above the previous highs. This setup is riskier than the previous one, so if the trade moves in my favor, I’ll consider moving the stop to the entry point to eliminate the chance of a loss.

Gold Price Outlook – Trade Setup (XAU/USD)📊 Technical Structure
OANDA:XAUUSD Gold surged to a fresh record near $4,380 before retracing lower, now consolidating around $4,320–$4,330. The support zone sits at $4,301–$4,290, while the resistance zone is located at $4,368–$4,377. Price action shows a sharp pullback from highs, but bulls still hold ground above the key support. A rebound scenario could see a push back toward the resistance, while a decisive break below $4,285 would invalidate the bullish setup.
🎯 Trade Setup (Bullish Scenario)
Entry: $4,301–$4,290 (near consolidation & above support)
Stop Loss: $4,285
Take Profit 1: $4,350
Take Profit 2: $4,368
Take Profit 3: $4,377
Risk/Reward: ≈ 1 : 4.91
🗝️ Key Technical Levels
Resistance: $4,350 / $4,368 / $4,377
Support: $4,301 / $4,290
🌍 Macro Background
Gold remains supported by Fed rate cut bets, US-China trade frictions, and prolonged US government shutdown fears.
Fed Policy: Powell and Waller signalled two more cuts this year, reducing the opportunity cost of holding gold.
US-China Tensions: Additional port fees and tariff threats fuel safe-haven demand.
US Government Shutdown: Entering its third week, weighing on the USD and indirectly boosting gold.
Geopolitics: Some easing in Ukraine risks could cap upside, but macro drivers remain gold-positive.
📌 Trade Summary
Gold remains in a strong uptrend despite intraday corrections. A long setup near $4,301–$4,290 with stops under $4,285 offers a favourable risk-reward toward $4,368–$4,377. Safe-haven demand and dovish Fed expectations continue to support bullish momentum.
⚠️ Disclaimer
This analysis is for reference only and does not constitute trading advice. Trading involves significant risk, and proper risk management is essential.

GOLD XAUUSD GOLD ,THE price action shows that market closed on a supply roof at 4328-4330 zone late gold buy show that the yellow metal is not done yet.
layer by layer with confirmation on 15min
#gold #xauusd #dollar #dxy

XAU/USD – Gold Technical Rebound Prepares for Next Waveb]🔍 Market Context
After reaching a peak at the ATH GOLD 4,391 USD region, gold has undergone a technical correction — reflecting temporary profit-taking following a strong upward trend.
The market structure still maintains a bullish bias as the support zones below (FVG + OB) remain intact and untested.
Currently, the price is hovering around 4,325 USD, indicating that selling pressure has weakened.
Buyers are likely to return at two strategic zones below — where institutional money (Smart Money) typically accumulates positions before the next upward wave.
💎 Technical Analysis
ATH GOLD: 4,391 USD
Liquidity Zone $$$: 4,465 – 4,424 USD → the upper liquidity zone, the main target for the next upward wave.
FVG Zone: 4,284 – 4,267 USD → an unfilled gap, likely to be retested.
Order Block Zone: 4,244 – 4,230 USD → deep discount zone confluence with Fibo 0.786, high probability of strong reaction.
Liquidity Clear $$$: 4,186 – 4,190 USD → the last defense zone of the main upward trend.
Overall structure remains bullish ; the current decline is merely a phase of adjustment to “accumulate liquidity” before continuing the upward momentum.
📈 Trading Scenarios
1️⃣ BUY Setup #1 – FVG Zone 4,267 USD
Entry: 4,267 – 4,270
SL: 4,255
TP: 4,330 → 4,366 → 4,391
✅ Condition: Confirming bullish candle (rejection / engulfing bullish) at the FVG zone or a small BoS appears on M15.
➡️ Short-term “buy-the-dip” setup, leveraging the unfilled FVG zone — where technical buyers often initiate positions first.
2️⃣ BUY Setup #2 – Order Block Zone 4,244 USD
Entry: 4,244 – 4,230
SL: 4,210
TP: 4,284 → 4,366 → 4,391 → 4,424
✅ Condition: Strong confirming candle (engulfing bullish) or a retracement pattern breaking a small BoS back up.
➡️ Swing-buy setup at deep discount zone — confluence of OB + Fibo 0.786, high probability and optimal R:R.
⚠️ Risk Management
Avoid FOMO buying in the middle of the range (4,320–4,340).
Prioritize waiting for clear reactions at 4,267 and 4,244 before entering trades.
If the price closes an H1 candle below 4,210 → pause all buy orders, re-evaluate price action at 4,186.
Maintain moderate trading volume during the current rebound phase.
💬 Conclusion
Gold is in a phase of healthy technical correction within a major upward trend.
The two zones 4,267 USD (FVG Zone) and 4,244 USD (Order Block Zone) are key “accumulation” areas for large capital.
When bullish confirmation signals appear, these will be safe buy positions before gold heads back to the peak 4,391 – 4,465 USD .
👉 Reasonable Strategy:
Buy at 4,267 – 4,270 USD if reversal confirmation occurs.
Buy at 4,244 – 4,230 USD if a strong OB reaction signal appears.
🔥 “Smart money waits at precise levels — not at the top. The next gold wave will emerge between 4.267 and 4.244.”

XAUUSD Technical Analysis: Golden Crossroads at 4,246.86Executive Summary (1D & 4H Timeframes):
Gold is at a critical juncture. The daily chart reveals a battle between a dominant Head and Shoulders top pattern and a potential Elliott Wave 4 corrective pullback. The neckline at 4,220 is the line in the sand. A decisive break below confirms the H&S pattern, targeting 4,150. However, the 4H chart shows consolidation above this level, with the 200-EMA (4,235) and the 50% Fibonacci retracement providing immediate support. The RSI is bearish but not oversold, suggesting room for a move in either direction. The overarching trend from the last major low remains intact until 4,220 gives way.
Swing Trading Strategy (4H/Daily):
BEARISH SCENARIO (Below 4,220 ): Sell on a confirmed break and close below 4,220. Initial Target: 4,180 (H&S Measured Move). Final Target: 4,150. Stop Loss: 4,265 (above recent swing high).
BULLISH SCENARIO (Above 4,265 ): A hold above 4,235 (200-EMA) and a break above 4,265 invalidates the immediate bearish structure, targeting a retest of 4,300. Buy on a bullish reversal candle above 4,235. Stop Loss: 4,210 .
Intraday Trading Plan (1H/30M/15M):
SHORT SETUP: Look for price rejection at the 4,255 - 4,260 resistance zone (aligned with 4H VWAP and 50-EMA) with bearish candlestick confirmation (e.g., Bearish Engulfing). Sell Entry: 4,255. Target 1: 4,240. Target 2: 4,225. Stop Loss: 4,268.
LONG SETUP: Only valid if price holds above 4,235 and shows strength. A bounce from 4,235-4,240 with a bullish candle (Hammer, Bullish Engulfing) offers a long opportunity. Buy Entry: 4,238. Target 1: 4,255. Target 2: 4,265. Stop Loss: 4,225.
Key Market Drivers & Alerts:
Geopolitical & Macro Watch: Monitor USD strength (DXY) and real yields. Any escalation in global tensions could trigger a safe-haven rush, invalidating technical bearishness.
Indicator Cluster: The convergence of the 200-EMA, Fibonacci support, and the H&S neckline creates a high-probability zone for the next significant move.
Final Word:
The path of least resistance is bearish below 4,220. Intraday traders can fade rallies towards 4,255-4,260, while swing traders await the decisive break. Always manage risk; a close above 4,265 flips the script to bullish.
Trade safe and follow the price action. Like and follow for continued high-quality analysis!

XAUFrom the outside looking in!!!!!
Excellence….
Weeks ended!!! All to plan zero errors!
What happens from here, I don’t care!!!! 🤷
See yous all next week. Pricing is in a blender if you tryna make moves at this point….
You missed, well…. You missed 🤣
Call it a day.
Let’s see what best week got for us!!!
Stay tuned!!!!! For some real shxt!
Jupahduhhhhh🪐

GOLD at Immediate support? Cut n reverse area??#GOLD... perfect move as per our last analysis and idea regarding Gold,
Now market made a new supporting area that is around 4308 as deep supporting area and immediate supporting area is 4324-25 now.
Keep close both areas and if market holds than we can expect further boucne.
NOTE: we will go for cut n reverse below 4308bon confirmation.
Good luck
Trade wisely
GOLD: Absolute Price Collapse Ahead! Short!
My dear friends,
Today we will analyse GOLD together☺️
The market is at an inflection zone and price has now reached an area around 4,177.29 where previous reversals or breakouts have occurred.And a price reaction that we are seeing on multiple timeframes here could signal the next move down so we can enter on confirmation, and target the next key level of 4,122.01.Stop-loss is recommended beyond the inflection zone.
❤️Sending you lots of Love and Hugs❤️

4,200 or 4,285? Gold’s Next Move Decides It All📊 Market Overview
Gold remains under pressure at the start of the week, trading below last week’s record highs, after a sharp correction from the 4,380s down to the 4,240 zone.
Investor sentiment is cautious as the market navigates a mix of uncertain U.S. economic data, a still-closed U.S. government, and renewed geopolitical tensions across multiple regions — all of which are fueling both fear and indecision in the market.
During early Asian hours, gold showed a mild recovery but continues to move sideways in a tight consolidation range, reflecting indecisive liquidity buildup before the next major move.
🧠 Technical Structure (MMFLOW View)
Gold is consolidating between short-term support near 4,206–4,204 and resistance around 4,285–4,287.
Liquidity has started to cluster above and below the current range, suggesting that a breakout is imminent.
The 4,166 – 4,140 region remains a major Smart Money re-entry zone, aligned with the CP BUY ZONE + OBS demand block.
On the upside, 4,313 – 4,342 stands as a key supply zone where large sellers previously stepped in.
Until price breaks out decisively, traders should expect choppy intraday conditions with limited follow-through.
🔑 Key Levels to Watch
🟢 BUY ZONE (Liquidity Re-entry Zone)
Zone: 4,206 – 4,204
SL: 4,200
TP: 4,210 – 4,215 – 4,220 – 4,230 – 4,240 – 4,250 – ???
🔴 SELL ZONE (Liquidity Reaction Zone)
Zone: 4,285 – 4,287
SL: 4,292
TP: 4,280 – 4,275 – 4,270 – 4,260 – 4,250 – ???
⚙️ MMFLOW Scenarios
1️⃣ Bullish Scenario:
If gold sustains above the 4,200 – 4,210 support area, a short-term rebound toward 4,270 – 4,285 can be expected.
Breaking above 4,287 would open room toward 4,313 – 4,342 (OBS Sell Zone), where Smart Money may begin distributing again.
2️⃣ Bearish Scenario:
A clean break below 4,200 could trigger a deeper retracement toward 4,166 – 4,140 (CP BUY ZONE).
This would still represent a healthy correction within the broader bullish macro structure.
⚡ MMFLOW Insights
Market remains neutral-to-bullish, but current movement reflects accumulation within a compression range.
Sideway structure indicates the market is loading liquidity for the next impulsive leg.
Patience is key — traders should wait for clean breakout confirmations before scaling positions.
⚠️ Trading Notes
✅ Use tight Stop Losses — gold’s volatility remains unpredictable during macro uncertainty.
✅ Avoid over-leveraging while price stays inside the sideway channel.
✅ Focus on reaction zones (CP, OBS, and liquidity sweeps) for precise entries.
🧭 Quick Summary
Gold trades sideways below record highs.
Key support: 4,206 – 4,204, key resistance: 4,285 – 4,287.
Short-term bias: Range-bound with bullish undertone.
Best approach: Buy dips at liquidity zones; wait for breakout confirmation before trend trades.
