Gold: Today's predictions and operations have been verified👏Today, our predictions and operations for gold have been verified by the market. We accurately predicted key price levels and risks, and avoided potential losses from the decline in advance:
✔1-Trend Direction Prediction: We clearly stated that "if gold breaks below $4,280 today, it will trigger a further decline". The subsequent market trend was consistent with this judgment—after touching the key support level, gold fluctuated downward as expected.
✔2-Risk Factor Prediction: We took into account the market characteristic of "traders closing positions early to exit on Fridays" in advance, and predicted that the superposition of multiple factors would make the downward trend uncontrollable. The subsequent market sentiment and fluctuation rhythm confirmed this risk.
✔3-Effectiveness of Operational Decisions: We reminded everyone early to "take profits in advance around $4,350 and stop trading", which successfully helped avoid the potential margin call losses caused by the subsequent uncontrolled trend. This decision was fully in line with the market trend.
🎉Today, we have successfully concluded this week’s trading and work. Next week, we will continue to provide you with more accurate market interpretations and operation references from a professional analytical perspective. Finally, we wish you all a relaxing and pleasant weekend in advance!
Trade ideas

Gold sweeps SL, wait for BUY LIMIT at Demand Zone 4,223-4,225Timeframe analysis: H4/30M
Logic: Trend Continuation after liquidity sweep.
MARKET STRUCTURE ANALYSIS (SMC Analysis)
Main Trend: Bullish (Price is moving within a parallel channel).
Structure Confirmation (BOS): The chart has confirmed an upward Break of Structure (BOS), indicating that buyers are controlling the market.
Liquidity Sweep/Fake: The strong bearish candle (marked as "Fake") is a move to sweep Stop Losses of early buyers and gather liquidity before Smart Money pushes the price in the main direction. This is an Inducement action.
Key Demand Zone (POI/Demand Zone/Order Block): The TIMING BUY area (4,223.154 - 4,225.000) is a potential Demand Zone/Order Block identified by Smart Money. The price is expected to retest this area before continuing to rise.
MAIN TRADING SCENARIO (LONG SETUP)
SCENARIO: Wait for the price to Pullback to the POI area to enter a buy order, continuing the main bullish trend.
Parameter
Value
SMC Description
Action
BUY LIMIT
Place a pending buy order
Entry Zone (POI)
4,225.000 - 4,223.150
Demand Zone/Order Block after liquidity sweep.
Stop Loss (SL)
4,214.390
Place below the low of the liquidity sweep candle ("Fake Low"), ensuring safety.
Take Profit 1 (TP1)
4,240.000
Target the nearest Swing High.
Take Profit 2 (TP2)
4,250.000
Target psychological resistance and mid-channel.
Take Profit 3 (TP3)
4,260.000+
Target the upper boundary of the parallel channel.
R:R Ratio
Approximately 1:2.5 to 1:3.5 (Depending on TP)
Good R:R ratio for a trend-following trade.
RISK MANAGEMENT
Risk: Only risk a maximum of 1-2% of the account for this trade.
Breakeven: When the price hits TP1, move SL to the Entry point (Breakeven) to protect capital.
Invalidation: If the price closes the D1/H4 candle below the SL level (4,214.390), the buy plan will be invalidated.

BUYING GOLD AT THIS LEVELTaking buys on gold from this level.
I am expecting for us to find support here and we should see a significant retracement at this level.

XAU/USD Technical Setup ‖ Bullish Momentum or Smart Trap?🏆 XAU/USD: The Golden Heist Blueprint | Swing & Scalp Strategy 💰
📊 Market Overview
Asset: XAU/USD (Gold vs U.S. Dollar)
Market: Precious Metals
Strategy Type: Dual Setup - Swing Trading (Bullish) & Day Trading/Scalping (Bearish)
Risk Level: High Volatility Zone ⚠️
🎯 The Master Plan
🚀 Bullish Scenario: "To The Moon" Setup
Breakout Level: $4,400.00
Action: Direct long entry on confirmed breakout above resistance
Logic: Clean break = institutional momentum shift
🔻 Bearish Scenario: Scalping/Day Trade Setup
Breakdown Level: $4,050.00
Action: Short positions on confirmed break below support
⚠️ Trap Alert: Any pullback above $4,050.00 post-breakdown = potential smart money trap. Watch for false breakouts!
🛡️ Risk Management Zone
Stop Loss (Pullback Buy Plan): $3,950.00
⚠️ Disclaimer: This SL is based on my analysis for the bullish pullback scenario. You're the captain of your own ship! Adjust stops according to your risk tolerance, account size, and trading style. Never risk more than you can afford to lose.
🎖️ Profit Targets
Buy Side Target: $4,600.00
Exit Strategy Notes:
Strong resistance confluence at this level
Overbought conditions likely
Potential trap zone for late entries
Recommendation: Scale out profits gradually rather than waiting for the full target
Sell Side Target: $4,050.00
Exit Strategy Notes:
Major support level - expect bounces
High probability of liquidity grab at this zone
Consider partial profit taking before reaching full target
Recommendation: Trail stops as price moves in your favor
⚠️ Disclaimer: These targets are MY analysis, not financial advice. Take profits when YOUR strategy signals, not mine. Trail stops, scale out, or exit based on YOUR plan. Your money, your rules! 💪
🔗 Related Markets to Watch
Correlated Assets:
DXY (U.S. Dollar Index): Inverse correlation - Dollar strength = Gold weakness
GC (Gold Futures): Direct correlation - Institutional positioning indicator
XAUEUR (Gold vs Euro): Alternative safe-haven flow gauge
US10Y (10-Year Treasury Yield): Inverse correlation - Rising yields pressure Gold
BTCUSD (Bitcoin): Risk-on/risk-off sentiment indicator
Key Fundamental Drivers:
Fed monetary policy & interest rate decisions
Inflation data (CPI/PCE reports)
Geopolitical tensions (safe-haven demand)
Real yields & opportunity cost
🔑 Key Technical Points
✅ Breakout Confirmation: Wait for candle close above/below key levels
✅ Volume Analysis: High volume breakouts = higher probability
✅ Smart Money Traps: Watch for failed breakouts and liquidity grabs
✅ Risk-Reward Ratio: Calculate before entry - minimum 1:2 recommended
✅ Market Structure: Respect higher timeframe trends
🎭 Trading Psychology Reminder
This strategy has a playful "heist" theme for entertainment, but make no mistake — treat your capital with serious respect. The market doesn't care about our plans. Adapt, manage risk, and preserve capital above all else.
Remember:
No setup is guaranteed
Always use stop losses
Never risk your rent money
Emotions are the enemy
The market pays patient traders
✨ If you find value in my analysis, a 👍 and 🚀 boost is much appreciated — it helps me share more setups with the community!
#XAUUSD #Gold #GoldTrading #ForexTrading #SwingTrading #DayTrading #Scalping #TechnicalAnalysis #PreciousMetals #TradingStrategy #RiskManagement #Forex #GoldAnalysis #TradingIdeas #MarketAnalysis #PriceAction #Breakout #SupportAndResistance #TradingView #ForexSignals
Happy trading, and may the pips be ever in your favor! 🎯💎

Double top Pattren Formed ! Gold faced strong rejection from the major supply zone around 4375
Demand Zone: Around 4207, where buyers may look to step in again

Oct 21, 2025 - XAUUSD GOLD Analysis and Potential Opportunity📊 Analysis:
Yesterday, gold pulled back sharply to around 4350 after approaching the all-time high, indicating that bullish momentum remains intact.
For today’s Asian session, the plan is to buy pullbacks into support.
Watch the 4356 support closely — if it breaks, a downside channel could open.
🔍 Key Levels to Watch:
• 4390 – Bullish target
• 4381 – All-time high resistance
• 4372 – Resistance
• 4356 – Key support
• 4350 – Mid-level support
• 4342 – Support
• 4320 – Support
• 4300 – Support
📈 Intraday Strategy:
SELL: If price breaks below 4356 → target 4352, with further downside toward 4350, 4342, 4337
BUY: If price holds above 4372 → target 4376, with further upside toward 4381, 4385, 4390

Gold price analysis October 17GOLD UPDATE – The uptrend shows no signs of stopping
The gold market is in the most “breathable” phase for the Buyers — almost every BUY strategy has brought profits overnight. The bullish momentum remains strong, showing that money continues to flow into this precious metal.
The next target that Gold is aiming for is around 4450, and any correction can be seen as a “golden” opportunity to join the main trend.
📈 Trading strategy:
BUY Trigger: when a price rejection signal appears at the support zones 4285 – 4242 – 4216
🎯 Target: 4450
👉 In this context, following the Buyers is still the only reasonable option. Observe the price reaction around the support zones and just “press the BUY button” when the signal appears.

XAUUSD Potential High Reward Buy SetupBuy Entry @ 4006
SL @ 3951
TP @ 4406
THis is High Reward Swing Trade

XAUUSD NEXT POSSIBLE MOVE Gold is currently trading near a strong resistance zone, where the price has faced repeated rejection. After the recent bullish rally, momentum appears to be losing strength, and signs of bearish pressure are starting to form.
If the price continues to struggle below resistance and forms a lower high or bearish candle pattern, it could confirm that sellers are stepping in.
A break below the minor support level would likely trigger a further downside move, opening the way for deeper correction.
Volume also shows weakening buying activity, supporting the idea that buyers are losing control while sellers begin to dominate.
As long as price stays below this resistance zone, the bias remains bearish, and short entries could be considered on pullbacks or confirmations.

XAU / USD 30 Minute ChartSo I just posted the last chart and then walked away to make breakfast and missed the move down, lol. It was a good call though. NY open is in 40 min. Let's see how things play out. Big G gets a shout out.


Gold – Price Correction, or Price Reversal?Gold volatility picked up dramatically last week as concerns regarding the ability of regional US banks to absorb losses from bad loans jostled for position as the new reason for owning Gold as a safe haven hedge with escalating trade tensions between the US and China.
These drivers joined a growing list of problems supporting why traders and investors could be so focused on adding Gold, and other precious metals, to their portfolios including geo-political risks in Ukraine and the Middle East, unsustainable government debt levels in countries like the US, Japan, France and the UK, as well as the potential for more interest rate cuts from the Federal Reserve.
To showcase how volatility has increased, last week Gold traded from its Monday open at 4012 to a new record high on Friday of 4379, before reversing direction to close the week at 4247. Despite a 1.8% fall on Friday, it still posted a weekly gain of 5.8% and on the way registered its biggest ever weekly price gain in dollar terms (+$235). This type of movement could reflect the increased involvement of speculators in Gold, which can exaggerate price moves as they are quicker to enter and exit positions.
When considering trading Gold in this type of environment it could be worthwhile looking to reduce position sizes to account for bigger price swings and accommodate the need for wider stop loss and take profit parameters.
Keeping apprised of scheduled event risk can also be useful, for example, the release on Friday (1330 BST) of the delayed US CPI reading, which could influence whether Federal Reserve policymakers feel they are able to cut interest rates by 25bps (0.25%) at their meeting on October 29th.
Identifying and monitoring key technical levels and trends can also be important.
Technical Update: Price Correction, or Price Reversal?
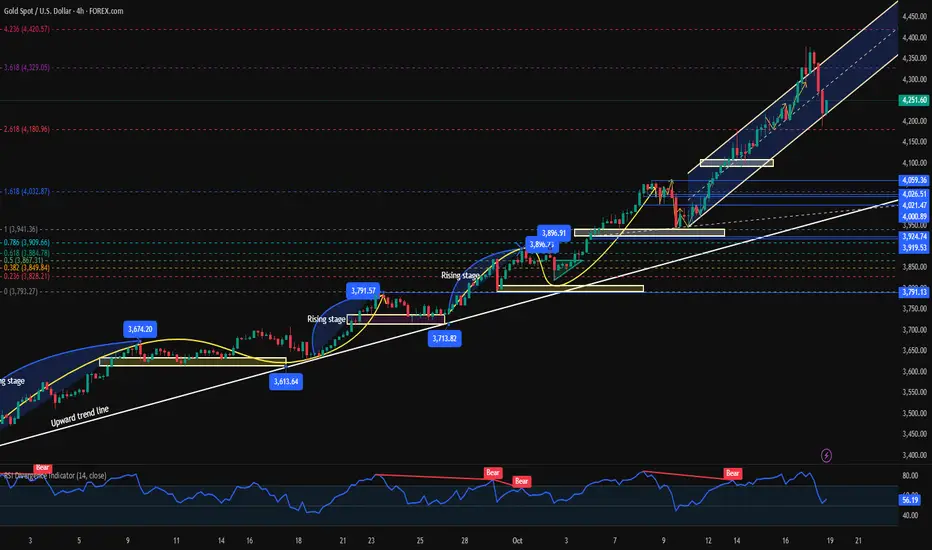
From the August 20th low into Friday’s new all-time high, Gold has risen an impressive 32.25%, reflecting a sustained uptrend. As illustrated in the chart below, corrections during this phase of strength have been brief, typically lasting just one session, with only a single instance of a two-day pullback (marked by the red candles). Each dip has consistently attracted fresh support, helping prices post successive highs and reinforcing the strength of the underlying upside momentum.
This recent activity underscores the positive sentiment behind Gold, despite traditional indicators having signalled stretched upside conditions for some time.
Notably, Bollinger bands continue to reflect a positive technical backdrop, with the mid-average rising, price action touching the upper band, and the bands widening, a sign of increasing price volatility and upward momentum.
Friday’s pullback following the new all-time high at 4379 may be sparking fresh debate among traders, whether this is just another brief correction, as seen during the current uptrend, or the start of a more extended phase of weakness.
Historically, similar dips have quickly attracted support, but upcoming sessions may prove pivotal in determining whether upside momentum can resume or if a period of deeper consolidation is on the horizon.
In this type of environment it may be prudent to establish potentially relevant support and resistance levels to monitor that could have an impact on the direction of Gold prices.
Potential Support Levels:
Price corrections following strong advances are a typical market response to short-term upside overextension, and Gold may well be entering such a phase. Traders could now focus on 4165 as the first key support, which is the 38.2% Fibonacci retracement of the October strength. This level holding if price weakness is seen, could stabilise sentiment, while a closing break lower may lead to a deeper pullback.
A closing break below 4165 wouldn’t necessarily signal a shift in downside sentiment, but it could open tests of 4099, the 50% Fibonacci retracement, even towards 4033, a level equal to the deeper 61.8% level.
Potential Resistance Levels:
Having stalled on Friday at the 4379 level it is possible this now marks initial resistance for the coming week. If the uptrend pattern from the August 20th low is to persist, a close above 4379 may lead to a more extended phase of price strength.
While not a guarantee of higher price levels, successful closes above 4379 may open scope toward 4416, the 238.2% Fibonacci extension, and if this gives way on towards 4506, which is equal to the 261.8% extension.
The material provided here has not been prepared accordance with legal requirements designed to promote the independence of investment research and as such is considered to be a marketing communication. Whilst it is not subject to any prohibition on dealing ahead of the dissemination of investment research, we will not seek to take any advantage before providing it to our clients.
Pepperstone doesn’t represent that the material provided here is accurate, current or complete, and therefore shouldn’t be relied upon as such. The information, whether from a third party or not, isn’t to be considered as a recommendation; or an offer to buy or sell; or the solicitation of an offer to buy or sell any security, financial product or instrument; or to participate in any particular trading strategy. It does not take into account readers’ financial situation or investment objectives. We advise any readers of this content to seek their own advice. Without the approval of Pepperstone, reproduction or redistribution of this information isn’t permitted.

XAUUSD (GOLD) IntraDay Trade Buy SetupBuy around 4255-4250
SL Below 4245
TP1 @ 4275
TP2 @ 4300
TP3 @ 4350

October 19th Gold Weekly ReviewOctober 19th Gold Weekly Review
In-Depth Analysis of the Gold Market | Technical Correction and Trend Outlook After Reaching a Record High
I. Core Market Review
Milestone Breakthrough: Spot gold hit a record high of $4,380 on Friday (October 17th), with its total market capitalization exceeding $30 trillion for the first time, highlighting global capital demand for safe-haven assets.
Technical Pullback: Gold prices subsequently retreated to around $4,220, with a single-day fluctuation exceeding $190, primarily due to a rebound in the US dollar and profit-taking, but the weekly chart still recorded its ninth consecutive week of gains.
II. Analysis of Multiple Driving Factors
1. Macroeconomic Policy Support
Federal Reserve Rate Cut Expectations: The market is betting on 25 basis point rate cuts in October and December, respectively (with a 96.8% and 81.3% probability). The low interest rate environment continues to weaken the dollar's appeal.
Increasing Fiscal Risks: The continued US government shutdown and regional bank risk events (Zions Bancorp and Western Union Bank) are fueling risk aversion.
2. Geopolitical Tensions
Trade Friction Escalates: Trump's tariff rhetoric and countermeasures against China on rare earth metals have raised uncertainty, but expectations of a high-level meeting have temporarily eased market anxiety.
Global Growth Concerns: Under the dual pressures of the trade deadlock and geopolitical conflicts, demand for gold as the "ultimate safe-haven asset" has surged.
III. In-Depth Technical Analysis
Trend Positioning
Long-Term Pattern: The daily moving average system is bullish, and the $30 trillion market capitalization confirms structural capital inflows, maintaining the bull market's foundation.
Short-Term Adjustment: The 4-hour RSI has retreated from the overbought zone to 53, and the price is testing support at the 21-period moving average ($4,230), indicating a healthy technical correction.
Key Price Levels
Resistance: $4275-4280 (Neckline Conversion), $4379 (All-Time High)
Support: $4180-4160 (Bull Resistance), $4090 (Key Level for Deep Pullbacks)
Market Signals
The 4-hour chart shows a double top formation at $4379. If it falls below the $4180 support level, a deep pullback to the $4090 area could occur.
If it holds above $4230 at the beginning of the week and reclaims $4280, the uptrend is expected to resume, with a target of $4500.
IV. Trading Strategy and Risk Management Guide
Operational Logic
Primary Strategy: Short positions in batches upon a rebound to the $4275-4280 area, with a stop-loss of $8 and a target of $4230-4180.
Secondary Strategy: After a pullback to the $4175-4180 area and stabilization, try a small long position with a stop-loss of $8 and a target of $4230-4250.
Risk Management Key Points
Position Management: Open a single position ≤ 20% of your total position to avoid excessive risk exposure;
Stop-loss Discipline: Strictly set physical stop-losses to guard against unilateral fluctuations;
Cycle Adaptation: Short-term traders focus on 4-hour momentum, while medium- and long-term investors focus on the integrity of the daily trend.
V. Response Plans for Special Market Conditions
Position Unwinding Recommendations
Deeply trapped positions (>$100): If a trend reversal signal is confirmed, decisively reduce your position and stop loss, freeing up funds to participate in rebound opportunities;
Shallowly trapped positions (<$30): Use support/resistance levels to cover your position to increase the average price, or hedge and lock in your position to wait for a technical correction.
Beginner's Guide
Avoid blindly chasing gains and losses; instead, consider trading based on fundamental and technical signals.
For first-time traders, a three-step transition model is recommended: simulated trading, light positions, and regular copy trading.
VI. Market Outlook
Despite short-term technical correction pressure, the three core drivers of the Federal Reserve's easing cycle, global debt inflation, and the normalization of geopolitical risks continue to support the long-term bull market for gold. Investors should focus on the defensive strength of the 4180-4160 area. If effective support forms here, gold prices could potentially reach a new high of $4,500.
If you're facing:
🔴 Deeply trapped positions and feeling overwhelmed
🔴 Repeated losses and a lack of a trading system
🔴 Missing out on key market opportunities
👉 Please send a private message with "Solution" to receive:
Account Diagnostic Report
Personalized Trading Plan
Next Week's Key Gold Trading Positions
Professionalism Makes Trading Simple | We Focus on Building a Sustainable Profitable System
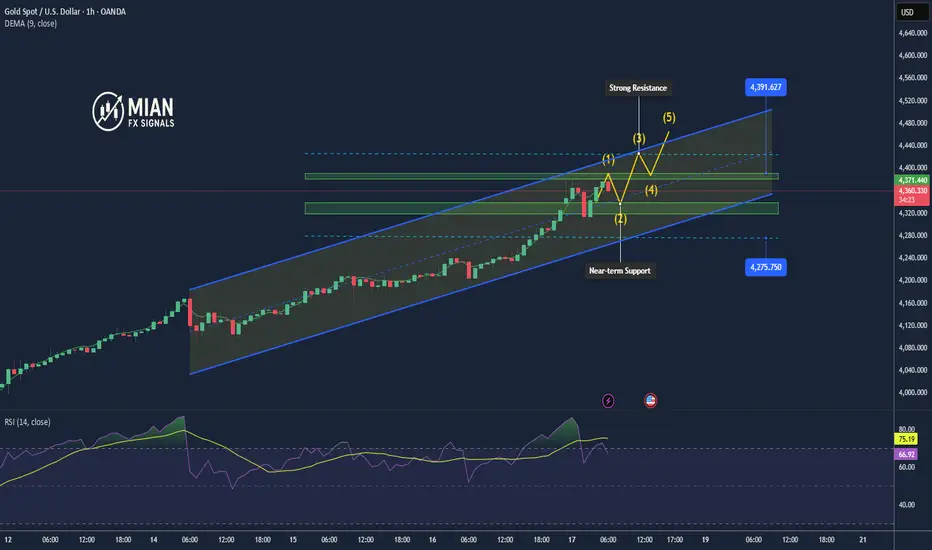
Uptrend Intact: Gold Eyes 4,400 After Sharp Pullback1. Market Overview
After reaching a new all-time high at 4,382, gold experienced a sharp correction down to 4,279, a drop of more than 100 USD/oz in a short time. However, strong dip-buying demand quickly emerged, helping the price rebound and trade back around 4,375, indicating that bullish sentiment remains dominant in the market.
The main drivers are expectations that the Federal Reserve (Fed) will cut interest rates earlier than expected, along with rising geopolitical tensions between major economies — reinforcing gold’s status as a safe-haven asset.
2. Technical Analysis
• Immediate Resistance: 4,382 – 4,390 (all-time high)
• Near-term Support: 4,340 – 4,320
• Major Support: 4,279 (recent correction low)
• EMA 50–100: Still trending upward, confirming that the main trend remains bullish.
• RSI (H1/H4): The overbought condition has been temporarily relieved after the correction, suggesting room for a new upward leg if price holds above 4,340.
3. Outlook
Gold is currently consolidating after a correction phase. If the price remains steady above 4,340, it is likely to continue toward 4,400 – 4,420.
Conversely, a break below 4,320 may trigger short-term profit-taking pressure.
4. Suggested Trading Strategy
🔺 BUY XAU/USD: 4,348 – 4,342
🎯 TP: 40 / 80 / 200 pips
🛑 SL: 4,335
🔻 SELL XAU/USD : 4,425 – 4,428
🎯 TP: 40 / 80 / 200 pips
🛑 SL: 4,431
Gold price analysis October 21GOLD UPDATE – Buying opportunity is forming after a strong correction
Today's European session recorded a rather deep correction of gold, when the price fell nearly 100 USD before temporarily stabilizing again. However, the main trend is still leaning towards the Buyers, and the support zones below are considered ideal areas to observe BUY signals.
Notable zones include: 4223 – 4193 – 4267, where the market may react and create opportunities to enter orders.
The upcoming US session is still likely to maintain the upward momentum, so the priority strategy at this time is still to wait for BUY when there is a confirmation signal of price rejection at support.
🎯 Trading plan:
BUY NOW: 4367
BUY Trigger: when there is a signal of price rejection at 4223 or 4193
Target: 4500

GOLDPreferably suitable for scalping and accurate as long as you watch carefully the price action with the drawn areas.
With your likes and comments, you give me enough energy to provide the best analysis on an ongoing basis.
And if you needed any analysis that was not on the page, you can ask me with a comment or a personal message.
Enjoy Trading ;)

XAU shortGoing for shorts to break through lows and sweep on $4281 mentioned in previous post.
Biggest hurdle again $4318 with a recent pull away from there abit of risk is on but can be achieved as I said, it’s too crucial and can have multiple playbacks.
LFG LONDON! 🤝🏾

XAU / USD 4 Hour ChartHello traders. Taking a quick look at the 4 hour chart, as we are almost closing the day out, I have marked my current area of interest. All wicks get filled at some point. So we are going to retest the area of interest and push back up, or we break and close below said area, and push down. I am not trying to rush a trade, so for me, I am going to see how the candles print during the overnight sessions, and see how things look for tomorrow. BIg G gets a shout out. Be well and trade the trend. Let's see how things play out.

Gold Breaks Out Above 4270, Targeting 43301️⃣ Market Overview
During the U.S. session, gold (XAU/USD) surged sharply, breaking above the key resistance zone of 4270–4280 and reaching 4323, its highest level of the week.
The main drivers were a weaker U.S. dollar and expectations that the Federal Reserve (Fed) may cut interest rates sooner than anticipated.
Additionally, rising geopolitical tensions in the Middle East and Trump’s latest remarks on Ukraine have strengthened safe-haven demand for gold.
2️⃣ Technical Analysis
• Main trend: Strong uptrend, breakout from the 4250–4280 consolidation zone
• Resistance: 4330 – 4345 – 4360
• Support: 4290 – 4275 – 4250
• EMA20 (H1): Strong upward slope, acting as dynamic support
• RSI (H1): Around 68, showing continued bullish momentum with a possible short-term correction
• Candlestick pattern: A bullish engulfing on the H4 timeframe confirms continuation of the uptrend.
3️⃣ Outlook
The current rally shows that buyers remain firmly in control, though after a strong breakout, gold may experience a technical pullback to 4290–4300 before advancing further toward 4330–4345.
As long as the price holds above 4290, the medium-term bullish trend remains intact.
4️⃣ Trading Strategy
🔺 BUY XAU/USD: 4299 – 4302
🎯 TP: 40 / 80 / 200 pips
🛑 SL: 4295
🔻 SELL XAU/USD: 4330 – 4333
🎯 TP: 40 / 80 / 200 pips
🛑 SL: 4337

GOLD Breakout? Support broke??#GOLD... So market just broke his supporting area that was actually 4186-87
Keep close and sustain below can create further volume for short
Good luck
Trade wisely

Gold market plunges towards 4390's Gold market opens the session maintaining its bullish trajectory, with momentum plunging toward the 4390’s as buyers retain control within the prevailing uptrend. follow for more insights , comment and boost idea

GOLD at Breakout Level? what's next??GOLD -- perfect move as per our last couple of ideas regarding gold and now market again near to his current resistance and upside breakout area that is 4260-61
keep close that area because if market sustain above that level than we can expect further rise in gold prices.
good luck
trade wisely
