GOLD → Positive backdrop. Consolidation before growth?FX:XAUUSD is consolidating after a shake-down in the Asian and Pacific sessions. The price hit a new low of 4278, but bulls are aggressively buying up two liquidations (manipulation?). The metal is preparing for its ninth consecutive week in positive territory, with an 8% increase over the week.
Key drivers: Fed members confirmed their readiness to cut rates in October and pointed to risks for the labor market. The situation with the trade war between China and the US is still tense.
However, negotiations between the presidents of three countries on the conflict in Eastern Europe have raised hopes for de-escalation, which has temporarily reduced demand for defensive assets. The shutdown continues, which supports the price of gold.
The correction in gold is a temporary pause, and any decline will be used for purchases.
Technically, the focus is on the global trading range of 4280-4380, with consolidation within 4350-4330. A breakout of the accumulation zone could trigger a move in the direction of the breakout
Resistance levels: 4350, 4380
Support levels: 4320, 4300, 4280
Technically, before rising, the price may test the liquidity zone located below the specified support zones. However, it is also worth watching the 4350 trigger—a breakout of resistance and a close above this level could trigger continued growth within the current bullish trend.
Best regards, R. Linda!
Trade ideas

Gold Consolidates Before Next MoveGold Consolidates Before Next Move
Gold is currently showing a short-term correction after reaching the $4,380 area. The price has pulled back as expected near $4180, and remains above this strong key support area.
From the current data we have, the price could rise from the market price where it is now or it could move a little lower before a recovery could occur towards the next targets at $4,250, $4,300, and $4,350.
A break above $4,380 would confirm a continuation of the bullish trend.
⚠️ However, if the price of gold falls below $4,180, then this could be caused by a strong sell-off that may not be related to normal movements. The decline could be caused by profit-taking by investors who are holding the price up.
⚠️ So, never trade without a stop loss. The market is positioned only for long trades and this carries a high risk. It is not a normal way for the price to develop.
If a downward wave occurs, it will occur without any pattern or confirmation, so be prepared for it at any time.
You may find more details in the chart!
Thank you and Good Luck!
❤️PS: Please support with a like or comment if you find this analysis useful for your trading day❤️

Gold ready for another spike 4380Gold (XAU/USD) is holding above the support trend line, showing potential for a bullish rebound. As long as price stays above the 4,220 support area, it may target the next resistance near 4,380.

Latest Gold Price Update Today👋Hello everyone, what are your thoughts on OANDA:XAUUSD ?
At the time of writing, XAUUSD is pulling back after reaching its recent peak. This retracement is mainly due to profit-taking by investors after gold hit a near-record high around $4,380.
However, the overall long-term trend still favors the bulls. The main driving force behind this remains strong technical buying momentum. Investors are increasingly turning to gold amid global uncertainties, seeking a safe haven to protect their capital.
Ongoing risks — from a prolonged U.S. government shutdown, escalating U.S.–China trade tensions, political instability in France, and heightened currency volatility — continue to push capital flows into gold, reinforcing its status as the “king of assets.”
From my personal perspective, based on current market momentum, I remain optimistic about gold’s outlook. The next key support levels are around $4,200, followed by $4,100.
💬What about you — how do you see the next move for this precious metal?

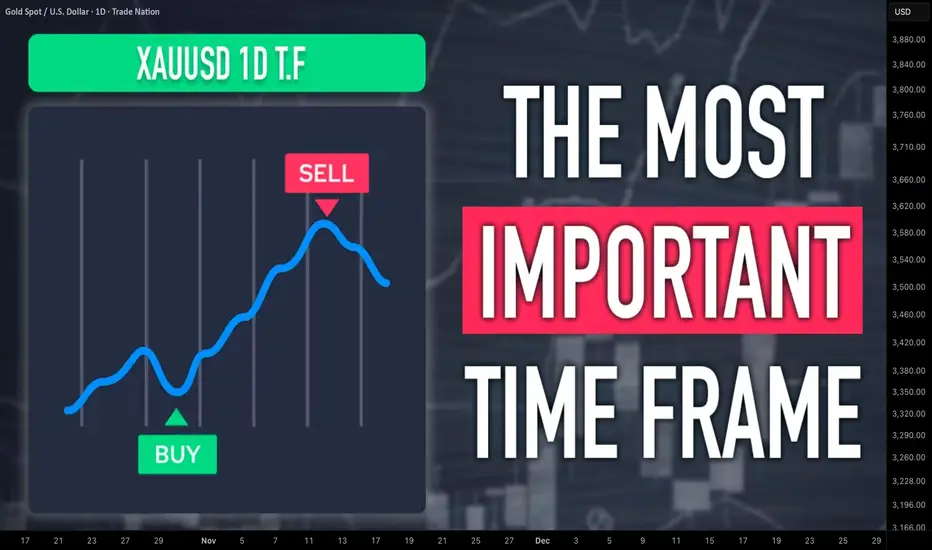
How to Analyze Daily Time Frame on Gold. 5 Important Things
There are 5 important things that you should analyze on Gold on a daily time frame to accurately predict long term, midterm and short term movements.
In this article, I will share with you a step-by-step guide for daily time frame analysis that you can apply on Gold or any other financial instrument.
1 - Identify the market trend
When you analyze a daily time frame, you should identify long term, midterm and short term market trends.
Long-term trend is based on the analysis of one year long price action.
In the example above, Gold is trading in a long term bullish trend because the price keeps setting new higher high and new higher lows during the year.
Midterm trend is based on the analysis of a price action for the last 4–5 months.
Above, we can clearly see that a mid-term trend is bullish because again, the price sets new higher highs and higher lows over time.
Short-term trend is based on the analysis of price movements for the last 2 months.
Short-term price action is also bullish on Gold, with a clear sequence of higher highs and higher lows.
According to the trend analysis, long-term, mid-term and short-term trends are bullish.
2 - Identify the directional bias
The directional bias defines a highly probable future direction on the market.
In our example, we can anticipate that Gold will keep growing among all the dimensions: long-term, mid-term and short-term.
3 - Execute structure analysis
Identify important historic horizontal and vertical structures.
That will be the points from where you should look for trading opportunities.
When you analyze key levels, identify the structures that are lying close to the current price levels.
Make sure that all the structures that you spotted were respected by the market in the past.
4 - Look for price action patterns
Price action patterns are the language of the market.
Proper identification of the patters will help you correctly understand the intentions of the market participants.
You can see that a bearish breakout of a rising channel triggered a correctional movement on the market.
Gold started to fall steadily within a bullish flag pattern and after it tested a key support, the price violated the resistance of the flag.
5 - Analyze candlesticks
Candlestick patterns can provide extra clues and confirmations.
You can see that the market formed multiple rejections from key support, an inside bar formation and bullish engulfing candle.
Violation of the inside bar to the upside with a strong bullish candle is an important bullish signal.
Combining trend analysis, structure analysis, price action and candlestick analysis, and you can make predictions and look for trading opportunities.
You can also make your analysis even more sophisticated, for example, analyzing fundamental analysis or applying technical indicators.
❤️Please, support my work with like, thank you!❤️
I am part of Trade Nation's Influencer program and receive a monthly fee for using their TradingView charts in my analysis.
Gold – Madness in MotionGold rose this week — so far (and I really want to stress so far ) — by around 10%. That’s massive by any standard.
On Monday, I tried to catch a dip and missed it. Since Tuesday, I’ve been on the sell side — completely wrong on direction , yet somehow still managed to finish positive overall.
Yesterday my stop got hit, but after what happened overnight, it turned out to be just a scratch. With this kind of volatility, a recovery of 250pips can happen in ten minutes.
Looking at the chart — it’s bullish, no question. Should it be bought? Hmmmm...
Looking at the volatility… for me, it’s become untradeable.
Can it keep going higher? Of course.
How high? Nobody knows.
At this point, any prediction is just throwing numbers in the air.
Trading corrections, as I’ve tried to do, is a guessing game. I’ve had some luck so far, but after yesterday's stop loss, I’m stepping aside.
My take: stay out. Let others make money if they can.
A 1,000-pip rise and an equal reversal — all while I was asleep (and trust me, I sleep very little) — is too crazy. Stops can be wiped for bulls just as easily as for bears.
At some point, it will settle down and define its levels.
Until then — it’s not for me anymore.
( HANZO Gold Protocol ) Bullish Reversal DetectedStatus: Active Reversal Protocol
Symbol: Gold
Session: London–New York Overlap (Smart Exit Window)
➕Bias: Bullish Reversal
Goal: Controlled with minimal drawdown
Tactical Edge: Reversal Protocol through liquidity engineering
Confidence Level: ★★★★★ (Smart Money Aligned)
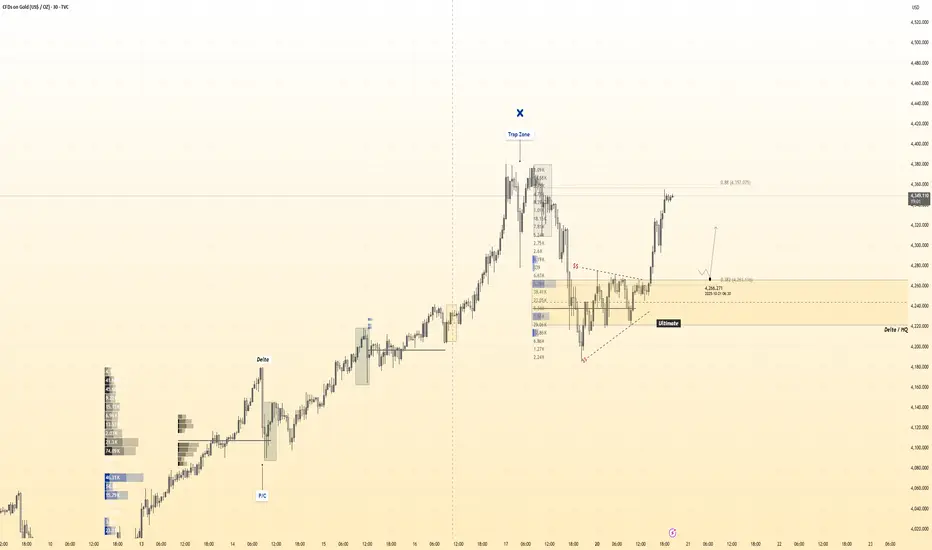
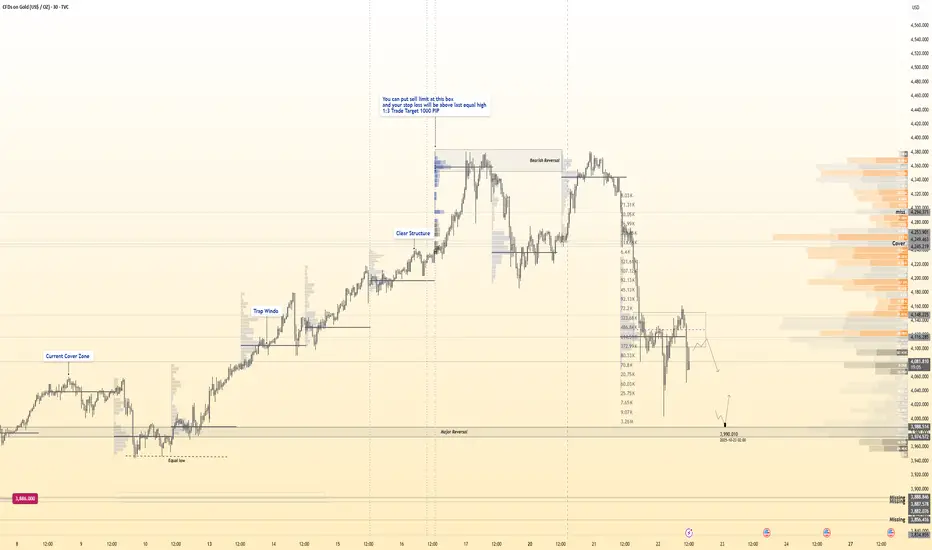
☄️4270 Bullish Reversal Zone — Full Breakdown
1️⃣ Fixed Range HVN Alignment
The 4270 level aligns perfectly with the High Volume Node from the previous accumulation phase — a sign of institutional absorption where orders were heavily exchanged before breakout.
2️⃣ Volume Gap Above, Density Below
Below 4270 we have heavy volume clusters, while above it the profile becomes thin — confirming that 4270 is the last defended zone before liquidity imbalance.
3️⃣ Liquidity Trap Confirmation
The sharp push below 4300 earlier collected stop-loss liquidity, making 4270 the smart money re-entry zone after clearing out retail buyers.
4️⃣ Fibonacci Alignment (0.382–0.5 Zone)
4270 sits inside the 38.2% retracement of the impulsive move, which is a premium re-entry level used by institutional models.
5️⃣ Structural Confluence (Old Resistance → Support)
Previous breakout base and trend compression aligned with 4270 mark it as a flip zone — the structural confirmation of a reversal block.
6️⃣ Delta HQ Reversal Indicator
At the base of the move (near 4270) the Delta HQ showed negative absorption turning neutral, meaning sell volume failed to push price lower — a key reversal trigger.
7️⃣ Session Logic
The level coincides with the post-10:30 session retest window (smart money re-entry timing), fitting your 10:30–10:30 volume cycle.
8️⃣ Trap Zone Above (Liquidity Vacuum)
The upper “Trap Zone” confirms that price already engineered liquidity above, freeing up path for bullish continuation from 4270 upward.
9️⃣ Internal Trendline Compression Break
The descending pattern leading into 4270 forms a bullish breakout wedge — clear compression followed by volume breakout.
🔟 Institutional Behavior Evidence
Sharp imbalance candle after 4270 test shows controlled accumulation — classic smart money re-entry behavior before next expansion.
🎯 Summary (Hanzo Logic)
4270 = Delta Reversal + HVN Defense + Liquidity Reset + Fib Precision
A high-confidence engineered re-entry zone built by smart money to refill positions before bullish continuation.
Lingrid | GOLD Channel Breakout Bullish Extension ActiveThe price perfectly fulfilled my previous idea . OANDA:XAUUSD continues its bullish structure within the ascending channel, forming a new A-B-C movement after a clean breakout above the compression zone. Price is consolidating just above the previous breakout level near 4200, setting a potential base for the next impulsive leg higher. A sustained move above 4200 could trigger a push toward 4290, marking a retest of the resistance zone. Momentum remains strong, supported by higher highs and channel integrity, suggesting continuation of the broader uptrend.
⚠️ Risks:
Failure to hold above 4100 may trigger a deeper retest toward 4060.
Strong USD recovery or hawkish Fed remarks could pressure gold prices.
A sudden shift in global risk sentiment could limit bullish continuation.
If this idea resonates with you or you have your own opinion, traders, hit the comments. I’m excited to read your thoughts!

GOLD DAILY CHART ROUTE MAP UPDATEHey everyone,
Check out our updated Daily Chart Route Map, now featuring updated levels for tracking Golds movement.
We’ve refined our proprietary Goldturn Channel, our unique method for constructing ascending channels. Price action recently broke out above the channel, with a body close above 4325, leaving a long-term gap open near 4444.
Currently, we’re observing rejection at 4325, and our channel top is now acting as support. The market is range-bound between 4325 (resistance) and 4183 (channel top as support). A decisive break above or below either of these levels will help define the next directional move, keeping in mind the open gap overhead at 4444.
On the downside, 3961 remains the pivotal swing zone, aligning with the channel midline, should we see a confirmed break below 4183.
As always, we will keep you all updated with regular updates throughout the week and how we manage the active ideas and setups. Thank you all for your likes, comments and follows, we really appreciate it!
Mr Gold
GoldViewFX

Gold can Fail its Rally and Fall Towards 4125Hello traders, I want share with you my opinion about Gold. The market for Gold has been through a highly complex and volatile phase after breaking down from its prior upward channel. This led to a significant fall into the support zone, followed by a strong recovery that has since pushed the price of XAU above a major ascending trend line. Currently, the asset is undergoing a corrective pull-back towards this broken trend line, setting the stage for what I believe is a critical test. In my mind, the price action is setting up a potential 'bull trap'. I expect that the price will first make a correction to the trend line, find support, and then attempt another rally. I think this rally will be exhaustive and will fail upon reaching the 4280 mark. A confirmed rejection from that peak would signal a major reversal. The subsequent decline should have enough momentum to break the major ascending trend line. Therefore, I have placed my TP for this reversal scenario at 4125. Please share this idea with your friends and click Boost 🚀
Disclaimer: As part of ThinkMarkets’ Influencer Program, I am sponsored to share and publish their charts in my analysis.

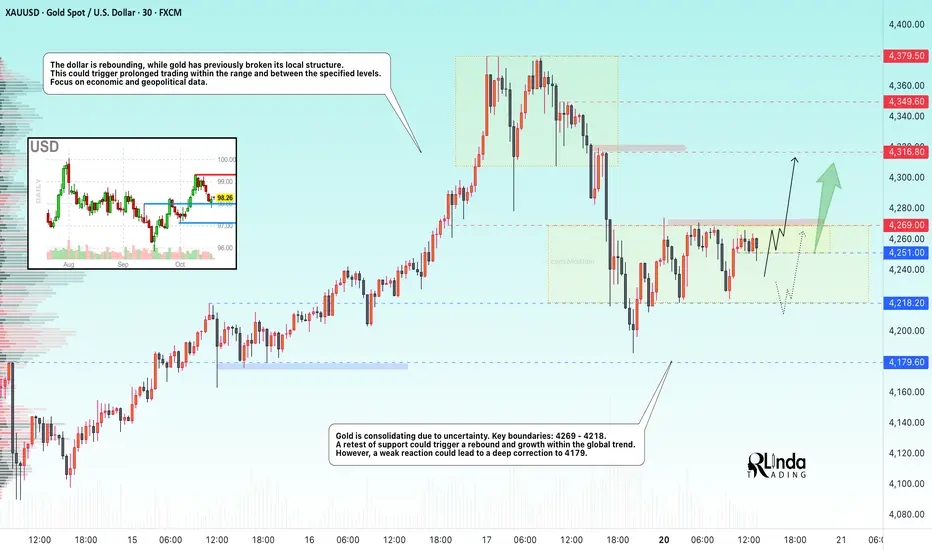
GOLD → Consolidation. 4269 - trigger. Chances for growth?Gold is consolidating due to uncertainty. On Friday, the market broke its local structure, which slightly changed sentiment. Focus on current consolidation.
Key drivers of the week: Trump's threat to impose 100% tariffs on Chinese imports and China's response supported demand for safe havens. Problems with regional banks (Zions, Western Alliance) and the fall in Treasury bond yields below 4% increased the inflow into gold. Powell maintained a neutral tone, but markets are expecting two rate cuts in 2024.
All eyes are on inflation data, US-China negotiations, developments between Russia, the US, and China; any de-escalation of the situation could trigger a correction.
Technically, the upward trend in gold remains relevant. Corrections will be bought up as long as uncertainty surrounding trade policy, the banking sector, and the Fed's monetary policy persists.
Resistance levels: 4269, 4316
Support levels: 4251, 4218
At the moment, a pre-breakout base is forming around 4269. If the structure remains intact and the price continues to attack resistance, the chances of a breakout and growth will be high. Otherwise, a close below 4251 could trigger a retest of 4218.
Best regards, R. Linda!
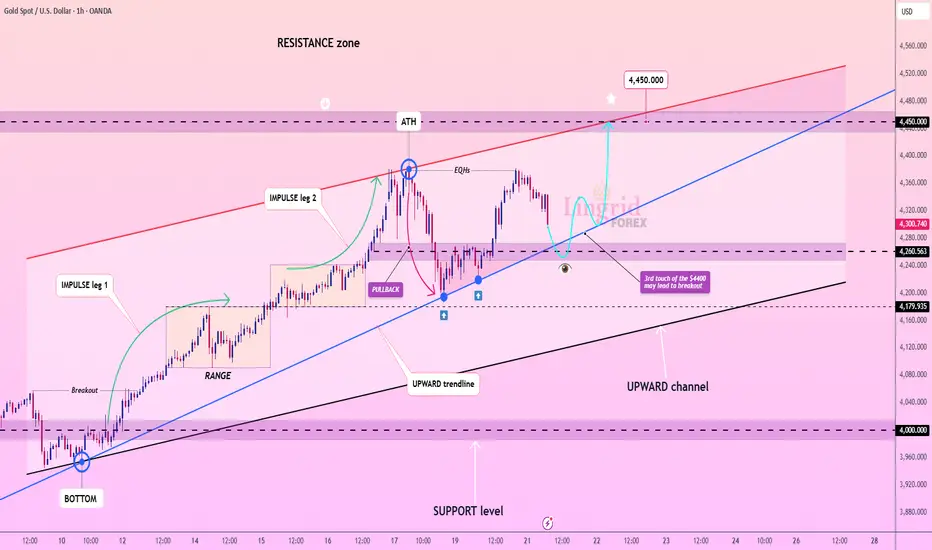
Lingrid | GOLD Trend Continuation Pattern FormingOANDA:XAUUSD is maintaining its bullish structure within an upward channel, where the price continues to create impulsive legs followed by controlled pullbacks. The third touch of the $4,380 resistance area suggests an increasing probability of a breakout continuation toward $4,450. As long as the $4,250–$4,270 support region holds, buyers remain in control of the broader trend. Momentum remains constructive, supported by higher lows and consistent rebounds from the trendline base.
⚠️ Risks:
Failure to hold $4,240 could invalidate the bullish setup.
Strong CPI data may cap gold’s upside.
A sudden drop in inflation expectations could weaken safe-haven demand.
If this idea resonates with you or you have your own opinion, traders, hit the comments. I’m excited to read your thoughts!
The perfect time to sell gold!After finishing and achieving my Gold Target (which was over achieved) Now will try to sell it. Lets see how it goes today with good R:R.

( Gold Protocol ) Bullish & Bearish Reversal Detected➕ Bearish Reversal " 4115 Zone
➕ Bullish Reversal : 3990
🩸 Volume Surge Confirmed — Institutional buyers active
🩸 Session Aligned — Timing matches liquidity expansion window
🩸 Cluster Shield Formed — Demand imbalance verified
🩸 Delta Shift Positive — Accumulation phase confirmed
🩸 POC Retest Completed — Weak shorts absorbed
🩸 Structure Break Pending — Bullish intention verified
Logic: This is engineered reversal, not prediction.
💯 Objective: Controlled execution with minimal drawdown.
Gold Testing 4,210 Support as Bulls Eye Another Leg HigherHey Traders, in today’s session we’re keeping a close watch on XAUUSD for a potential buying opportunity around the 4,210 zone. Gold continues to trade within a broader uptrend, and the current pullback appears to be a healthy correction toward a key support and resistance confluence at 4,210.
Market structure:
Momentum remains bullish, with price forming higher highs and higher lows. The ongoing correction could provide a trend-continuation entry if buyers step in near support.
Key level:
4,210 — a decisive zone where previous reactions have sparked renewed buying interest.
Outlook:
A sustained bid from this area could pave the way for another push toward 4,300 and beyond, keeping Gold aligned with its dominant bullish trajectory.
Trade safe,
Joe.

Gold price correction is within expectations, waiting for layout
News:
When it comes to long-term gold trading, attempting to find a "perfect low" is often unrealistic. While Friday's drop of nearly $200 in gold may seem dramatic, it's only half of last week's gains, making the correction still within reasonable bounds. After hitting 4186, prices quickly stabilized and rebounded to 4247, forming a typical bottoming-out pattern. This level is the 0.5 retracement support level of this week's upward trend.
Specifically:
Opportunities often lurk amidst sharp declines. After Friday's pullback to key support, bullish sentiment has stabilized. We maintain a bullish outlook for the start of the week and recommend placing long positions in batches above Friday's low.
Based on recent trends, the market is expected to trade sideways and rise slowly at the beginning of the week, with a focus on the 4220-4210 support zone. If the Asian session can break through and hold the 4275-4285 pressure zone, then you can follow up with long orders in the European and American sessions; if it maintains volatility, then wait patiently for opportunities to accumulate at low levels and stick to the long strategy on pullbacks.
Trading strategy:
Buy: 4225-4220, SL: 4210, TP: 4275-4300

“I Am Become Meme, Destroyer of Short-Sellers”: Gold at $4,200Remember those days where you could short gold and turn a profit? They’re gone. The precious metal is relentlessly pushing higher, breaking every short-seller’s dreams and portfolio.
It’s official — gold has gone full meme. The shiny metal that your grandparents swore by is now trending on Reddit threads, popping in Discord chats, and somehow getting the same hype energy as Nvidia NASDAQ:NVDA in 2023 and Dogecoin COINBASE:DOGEUSD in 2021.
Gold OANDA:XAUUSD just crossed $4,200 per ounce early Wednesday, notching a 60% gain year-to-date — its best run in modern history and enough to make short-sellers lose sleep and tons of cash.
Its market cap now sits near $30 trillion, which means there’s more money parked in gold than the nominal GDP of every country not named the United States.
Let’s unpack what’s fueling this blistering rally and why traders just can’t stop buying.
🪙 Gold as the Trade of 2025?
Not too long ago, gold was a boring asset that just sat there like a pet rock. Not anymore. The OG store of value is finding new meaning as the “asset for uncertain times.” That is, even amid an ongoing earnings season .
What’s driving it? Pretty much everything that usually rattles markets.
• Rate cut expectations: The Fed’s recent pivot toward easing has taken real yields lower — and gold loves that. Non-yielding assets look a lot more appealing when Treasuries don’t pay much.
• Geopolitical jitters: The Trump-Xi trade tension reboot has everyone looking for a hedge that doesn’t involve a risk disclaimer the size of a novel.
• ETF inflows: Gold-backed ETFs are hoovering up bullion at record pace as everyone seeks exposure to the precious metal.
Add in central bank hoarding — especially from China, India, and Turkey — and you’ve got a near-perfect cocktail for demand.
💰 Meme Metal or Market Masterclass?
Reddit’s r/WallStreetBets is now flooded with gold posts, some featuring rocket emojis other saying it’s one big bubble. Regardless, the retail crowd is buzzing with memes, showing that the age-old asset has reached its youngest audience.
Individual traders are clearly in on the move, and the narrative is simple enough to spread like wildfire — gold is going up, it’s at record highs, and there’s a clean number to chase: $5,000 .
Is it rational? Maybe not entirely. If 2021 taught markets anything, it’s that “meme energy” can be a legitimate technical indicator. But it will take more than undergrads buying on their iPads to move this $30 trillion behemoth.
⚖️ The Case for (Even) Higher Prices
The $5,000 target — just 20% away — doesn’t sound crazy to gold bulls. Here’s why:
• Fed momentum: With the labor market showing signs of cracking, two more rate cuts are priced in for this year.
• Central bank accumulation: Global reserves are quietly diversifying away from the dollar. It’s a structural de-dollarization move and (likely) not a phase.
• Broader liquidity wave: Investors are flush with cash, even amid the AI boom, and some of that money inevitably spills into gold.
😬 The Other Side of the Coin
But before you run to your local pawn shop with diamond hands, it’s worth noting: no rally goes vertical forever.
Gold’s RSI has hovered above 70 for weeks — deep in overbought territory. Historically, every time the metal’s gone this far this fast, there’s been a pullback of 10-15% to shake out the latecomers.
Add in profit-taking, potential surprise Fed commentary, and a stronger dollar bounce, and you could see a retest of support near $3,850–$3,900.
And don’t forget the opportunity cost. When rates eventually bottom, stocks and crypto could start reclaiming their allure. Gold doesn’t pay yield, doesn’t innovate, and doesn’t post memes — it just sits there, shiny and smug.
🥈 The Silver Lining
If gold’s story sounds wild, silver’s chart looks even wilder. Silver OANDA:XAGUSD topped $53.60 earlier this week — up 83% year-to-date — riding on both industrial demand and good old FOMO.
ETFs tracking silver have seen some of their largest inflows ever, with some day traders even rotating profits from gold to silver in hopes of juicing returns.
When both metals rally together, it usually signals broad market uncertainty — and a collective “we don’t trust anything else right now” mood.
Off to you : How are you navigating the gold rush? Are you in already, looking to get in, or calling tops and lower from here? Share your views in the comments!

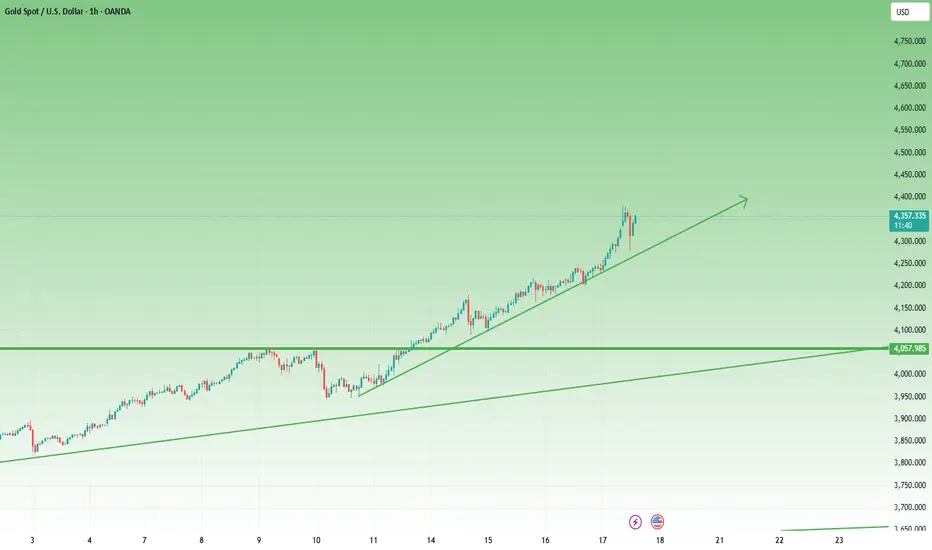
Gold (xauusd): still bullishHello guys!
Gold (XAU/USD) is showing a strong bullish trend on the 30-minute chart, but we can see that the upward trendline has recently been broken. Despite this, the price is approaching a key support zone between 4,086 and 4,058 (highlighted in blue), which has held as a strong buying area in the past.
Currently, the market could play out in two scenarios:
Blue scenario – A shallow pullback from the current price down to the support zone, followed by a rebound.
Red scenario – A slightly deeper retracement, touching the lower end of the support zone before buyers step in.
In both cases, this support area is likely to act as a strong demand zone, providing a good opportunity to enter long positions . The overall bullish trend remains intact, so the expectation is that after this retracement, the price will continue upward toward 4,180 and beyond.
✅ Key levels to watch:
Support: 4,086 – 4,058
Resistance: near 4,180 (next target)
Trading plan: Wait for the price to approach the blue support area and look for bullish confirmation (reversal candlestick, bullish engulfing, or strong buying volume) to enter long positions.
Disclaimer: As part of ThinkMarkets’ Influencer Program, I am sponsored to share and publish their charts in my analysis.

Gold Price in Free Fall👋Hello everyone, let’s take a look at OANDA:XAUUSD and see what’s happening!
At the time of writing, the precious metal continues to move within a downward wave. At one point, gold dropped close to the $4,000 mark, down more than $350 compared to the same time in the previous session — a decline of nearly 5%.
This marks the sharpest drop after nine consecutive weeks of gains. The main reasons behind this move are the strengthening U.S. dollar, profit-taking pressure, and diminishing caution as U.S.–China trade tensions show signs of easing.
In addition, optimism over the potential reopening of the U.S. government, reduced political uncertainty, and improving trade sentiment have lessened investors’ urgent demand for safe-haven assets like gold.
From a technical perspective: Gold had previously fallen after forming a double-top pattern, breaking through several key support levels. It is now reacting around $4,100, gaining temporary momentum from the $4,000 support zone.
In the short term, I expect a minor rebound before the downtrend may resume, but from a medium to long-term view, I remain optimistic, supported by expectations that the Fed will soon ease monetary policy, Trump’s tariff measures, and continued gold buying by central banks.
What about you — how do you see gold’s next move today? 💬Share your thoughts in the comments below.
Good luck and happy trading!

Gold’s recent rollercoaster- A Lifetime of LessonsThere are plenty of lessons to take from Gold’s recent rollercoaster — lessons about volatility, psychology, and how easily conviction can turn into chaos.
But before we get into technicalities, let’s look at what really happened… and what it means for us as traders.
________________________________________
1️⃣ The Illusion of Strength
When Gold went straight from 4000 to 4400 in just a few days, the move looked unstoppable.
Social media was full of confidence — “China is buying”, “5k incoming”, “This is the new era for Gold.”
But markets don’t move in straight lines forever.
Every parabolic rise eventually collapses under its own weight.
And when it does, it doesn’t just destroy buy positions — it destroys false convictions.
The first lesson?
Moves that look too strong to fade are usually too weak to sustain.
________________________________________
2️⃣ Confidence Can Be Expensive
Believing too much in one direction — especially when price already exploded (see the rise from 3300 to 4k in one month) — is one of the fastest ways to lose money.
A trader who bought at 4350 because he was “sure” China would keep buying quickly learned how expensive “sure” can be.
The market doesn’t reward conviction.
It rewards discipline, flexibility, and risk control.
Confidence without control is just another form of gambling.
________________________________________
3️⃣ Trading ≠ Investing
This move also reminded everyone of a fundamental truth:
You are not China.
China buys Gold as a store of value, not as a speculative trade.
They bought at 2500, 3k, 3.5k and 4400 — not to take profit in two days, but to build long-term reserves.
You, as a trader, operate in a completely different universe.
Mixing trading logic with investment narratives is a silent killer.
You might tell yourself, “If China buys, I’m safe.”
But China doesn’t use a stop loss and don't trade in margin (use laverage),— YOU DO.
If you don’t understand the difference, better stay on the sidelines and watch.
At least you won’t lose money while learning the hard way.
And if you want a more down-to-earth comparison — my mother started buying Gold in the early ’70s, as a store of value through the communist period.
She bought through the gold bubble of the late 1970s, bought at the bottom afterward, continued through the 1990s, and kept doing it until she retired in 2005.
She wasn’t trading — she was preserving value.
That’s what investing is.
What we do here, every day, is something entirely different.
________________________________________
4️⃣ Right vs. Wrong? It’s Not About That
And now that we’ve made the distinction between investing and trading clear,we must also understand something even more important:
Trading is not about being right or wrong — it’s about timing, money management, and perspective.
Let’s take a few real examples from last few day's chaos:
• On Friday, if you bought at 4275 and the price spiked overnight, you could’ve closed with 1000 pips profit — you were “right.”
• But if someone else sold at 4370 during that same night, they were also “right,” catching the drop.
• If you had bought the dip from the all-time high, around 4300, you’d likely be down 1000 pips in drawdown quickly same Friday — and let’s be honest, who really holds that?
• If you sold at 4300 on Monday near resistance, you would have been stopped out as price revisited the ATH — even though your direction was correct eventually.
• Likewise, if you bought yesterday at 4200 during the drop, you’d have been liquidated on the next 2000-pip fall. And if Gold now rises again to 4400 or even 5000 — how does that help you?
Obviously, these are illustrative examples, just to express the point — not literal trades.
And for those who commented under previous posts — either out of boredom or the need to contradict — I have two things to say:
1️⃣ If you don’t understand what I just explained, you have no business being in trading.
2️⃣ If you do understand but still feel the urge to argue, your comment is nothing more than trolling and emotional projection.
Because this isn’t about numbers or ego — it’s about understanding how the market really works, beyond the noise and the narratives.
________________________________________
5️⃣ The Real Lesson
The 4000–4400 move wasn’t just a chart pattern.
It was a psychological test — a reminder that the market exists to expose overconfidence.
When something looks “certain,” that’s usually when it’s most dangerous.
In trading, survival matters more than prediction.
And sometimes, the smartest trade is no trade at all.
________________________________________
6️⃣ Final Thoughts
Gold’s rollercoaster taught more than a dozen books on trading psychology ever could.
It reminded us that:
• Parabolic moves end violently.
• Overconfidence without a stop loss is suicide.
• You’re not an investor — you’re a trader.
• Being “right” means nothing without timing.
• And sometimes, the best position is to stay out.
The market didn’t just move from 4000 to 4400 and back.
It moved through the hearts and minds of every trader watching it —and left behind a few lessons worth remembering for a lifetime.

Gold Breaks New Records: Unstoppable Momentum ContinuesGold Breaks New Records: Unstoppable Momentum Continues
It was a big surprise that gold seems unstoppable and from all perspectives remains on the rise. I have not seen anything like this before in one of the most tradable assets.
All this upward momentum remains unclear. In my opinion, it is not related to the Federal Reserve or geopolitical issues, as we have heard this topic all this year and it has been evaluated millions of times. But this is the situation.
Technical Analysis:
Gold broke out to another important price level of 4200, thus showing a very strong upward momentum. Gold continues to mark a historical high.
Blue Scenario:
Gold also remains on the rise today. If it stays above the current support area of 4180, then it should continue to rise further to 4250 and 4300 for now.
Red Scenario:
If gold faces any profit, it could fall to a maximum of 4105 before moving up again.
You may find more details in the chart!
Thank you and Good Luck!
❤️PS: Please support with a like or comment if you find this analysis useful for your trading day❤️

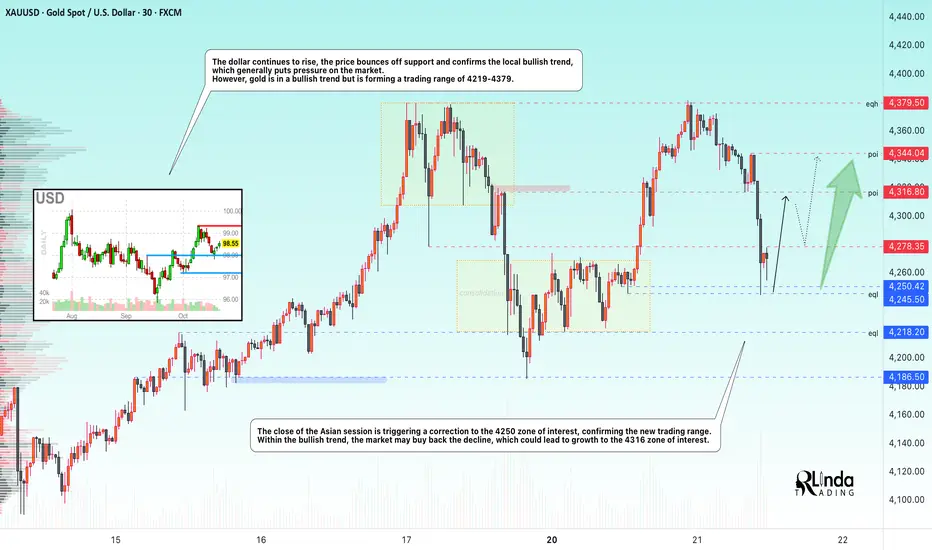
GOLD → The correction forms a trading range. Growth?FX:XAUUSD is adjusting to $4250 after retesting the all-time high of 4380. Short-term pressure is linked to hopes for an easing of the trade war between the US and China, but the bullish trend remains intact.
Key factors: Bentsen's meeting with the Chinese Vice Premier this week has revived optimism for a deal. The reduction in trade risks is temporarily supporting the USD. Hassett's statements about the imminent resumption of government work have reinforced risk-on sentiment.
Support for gold: The threat of tariffs rising to 155% from November 1 reminds us of the risks. Two rate cuts before the end of the year remain in focus. Friday's inflation data release and US corporate earnings reports are keeping demand for hedging alive.
Accordingly, the correction in gold is a temporary pause. The uptrend will remain unchanged as long as macro uncertainty persists.
Support levels: 4250, 4218
Resistance levels: 4278, 4316
Within the bullish trend, the price is forming a trading range. A retest of support could end in a recovery, with the fundamental background favoring the bulls. A retest of 4245 could trigger growth, as could a breakout of 4278 (closing above resistance).
Best regards, R. Linda!
GOLD 4H CHART ROUTE MAP UPDATE & TRADING PLAN FOR THE WEEKHey Everyone,
Please see our updated 4h chart levels and targets for the coming week.
We are seeing price play between two weighted levels with a gap above at 4333 and a gap below at 4225. We will need to see ema5 cross and lock on either weighted level to determine the next range.
We will see levels tested side by side until one of the weighted levels break and lock to confirm direction for the next range.
We will keep the above in mind when taking buys from dips. Our updated levels and weighted levels will allow us to track the movement down and then catch bounces up.
We will continue to buy dips using our support levels taking 20 to 40 pips. As stated before each of our level structures give 20 to 40 pip bounces, which is enough for a nice entry and exit. If you back test the levels we shared every week for the past 24 months, you can see how effectively they were used to trade with or against short/mid term swings and trends.
The swing range give bigger bounces then our weighted levels that's the difference between weighted levels and swing ranges.
BULLISH TARGET
4333
EMA5 CROSS AND LOCK ABOVE 4333 WILL OPEN THE FOLLOWING BULLISH TARGETS
4422
EMA5 CROSS AND LOCK ABOVE 4422 WILL OPEN THE FOLLOWING BULLISH TARGET
4494
EMA5 CROSS AND LOCK ABOVE 4494 WILL OPEN THE FOLLOWING BULLISH TARGET
4572
BEARISH TARGETS
4225
EMA5 CROSS AND LOCK BELOW 4225 WILL OPEN THE FOLLOWING BEARISH TARGET
3985
EMA5 CROSS AND LOCK BELOW 4122 WILL OPEN THE SWING RANGE
3985
3857
EMA5 CROSS AND LOCK BELOW 3857 WILL OPEN THE SECONDARY SWING RANGE
3741
3632
As always, we will keep you all updated with regular updates throughout the week and how we manage the active ideas and setups. Thank you all for your likes, comments and follows, we really appreciate it!
Mr Gold
GoldViewFX
