Gold (XAUUSD) Technical Setup – M15 | Civilian Pipster🏆 Gold (XAUUSD) Technical Setup – M15 | CivilianPipster
📊 Gold is currently trading near 4260, showing early signs of recovery after the recent correction. The structure indicates a potential decision zone ahead — either a breakout continuation or a retest drop.
🔸 Key Observation:
Price is forming a rising wedge within a short-term uptrend.
A strong supply zone lies around 4285–4295, where sellers previously dominated.
Immediate demand support rests at 4210–4190, aligning with the lower trendline.
💡 Potential Scenarios:
🟢 Bullish:
If gold breaks above 4295 with momentum, we may see a move toward
Target 1 – 4350,
Target 2 – 4370+.
🔴 Bearish:
If price fails near 4280–4290 and breaks below 4240,
expect a retest of 4210–4190 demand zone before next direction.
⚖️ Summary:
Gold is in a make-or-break zone — wait for confirmation before entry.
Whichever side breaks first (4280 or 4240) could lead the next 100+ point move.
🚀 Stay patient. Smart money waits for structure — not noise!
#CivilianPipster | #XAUUSD | #GoldAnalysis | #TradingSetup
Trade ideas

GOLD XAUUSDIT FEELS GOOD TO HAVE PREDICTED THE SELL OF GOLD and the price action respected at 4372-4385 zone from my previous post for your reference...now i see a possible newyork retest into 4400-4415 on the same trend line acting as dynamic resistance ...
layer by layer ,GOLD IS CRAZY NOW

Gold Intraday Trading Plan 10/22/2025Yesterday gold went wild and dropped almost 3k pips. This is crazy and it signals a few heavy selling sessions ahead. Therefore, I will look for selling opportunities from 4195. My first target is 4042. Ultimate target for today is 3965.

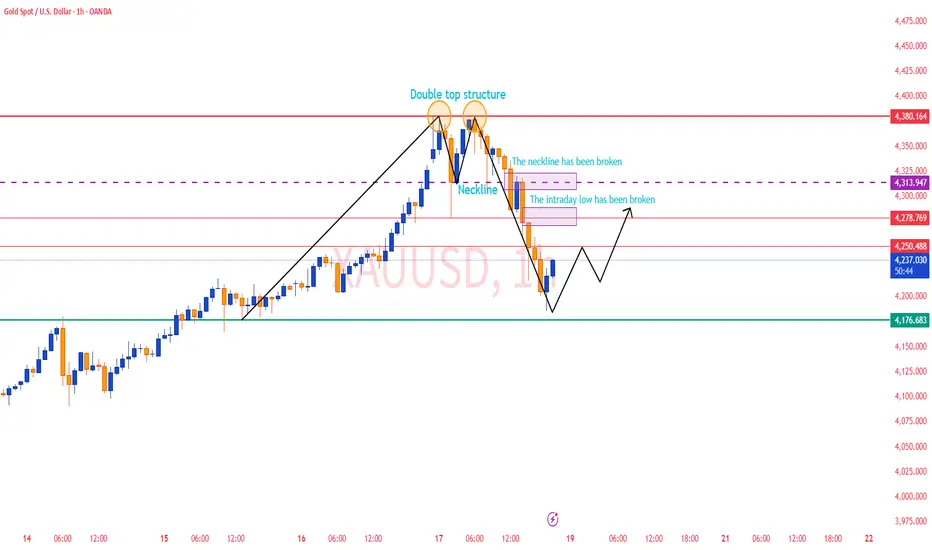
XAUUSD (Gold) – Bearish Rejection from Supply Zone!
Gold is showing a clear reaction from the 4,350–4,360 USD supply zone (highlighted in red). After multiple rejections, price is struggling to break higher — signaling that sellers are taking control once again.
On the 1H timeframe, we can see strong bearish candles forming right after testing the resistance zone, confirming a potential reversal setup.
🔍 Market Structure Analysis:
Resistance (Supply Zone): 4,350–4,360 USD
Support (Demand Zone): 4,170–4,200 USD
Current Price: ~4,342 USD
Trend Bias: Short-term bearish
Confirmation: Consecutive lower highs and rejection wicks at resistance
📊 Possible Scenario: If sellers maintain momentum, we could see price push down toward the green demand zone (4,170–4,200) — the next key area where buyers previously stepped in.
This level aligns with previous liquidity sweep and demand re-test structure, making it a high-probability target for short-term traders.
💡 Trading Plan:
Entry: After a confirmed break below 4,320 or bearish retest
Target: 4,200 USD
Stop Loss: Above 4,360 zone
Risk/Reward: Around 1:3 depending on entry confirmation
⚠️ Note: Always wait for candle confirmation before entering. The market could still consolidate before making the next move. Manage risk wisely.
---
🧠 Bias Summary:
📍 Gold remains bearish as long as price stays below 4,360 resistance zone.
📍 Next key target sits around 4,200 demand zone.
---
💬 What’s your view on Gold this week?
Do you think buyers will defend the 4,200 zone again, or are we heading lower? Drop your analysis below 👇
#XAUUSD #Gold #PriceAction #SupplyAndDemand #SmartMoneyConcepts #TradingView #ForexAnalysis

Bullish Scenario (Primary Setup): Entry (Buy Zone): 4,180 – 4,2Technical Overview:
Gold is currently in a retracement phase, testing a strong BUY ZONE between 4,180 – 4,200.
This zone has previously acted as a major support area, where buyers stepped in.
The chart shows a possible bullish reversal pattern forming near this zone, suggesting a potential rebound.
🟩 Bullish Scenario (Primary Setup):
Entry (Buy Zone): 4,180 – 4,200
Target: 4,384
Stop-Loss: Below 4,160
Rationale:
The buy zone aligns with previous price reactions, confirming strong demand.
Wick rejections around 4,190 indicate buyer interest.
Price action suggests a possible V-shaped recovery or higher-low formation before continuation upward.
🟥 Bearish Scenario (Alternative):
If price closes below 4,160, the support zone will be invalidated.
In that case, exp TFEX:KKP1! TFEX:DELTA1! TFEX:JPY1! TFEX:EURUSD1! TFEX:GD1! TFEX:GF1! TFEX:USDJPY1! TFEX:GF101! TFEX:SVF1! TFEX:GO1! ect further downside toward 4,120 – 4,100.
⚙️ Summary Table:
Parameter Value
Trend Bias (Short-Term) Neutral to Bullish
Key Support (Buy Zone) 4,180 – 4,200
Target 4,384
Stop-Loss Below 4,160
Risk–Reward Ratio ≈ 1:3
📊 Conclusion:
Gold (XAU/USD) is approaching a critical support zone. As long as the price holds above 4,160, a bullish rebound toward 4,384 remains likely. However, a confirmed break below this level could trigger a deeper correction. TFEX:KEX1! TFEX:ICT1!

XAUUSD Case Study/Trend Continuation in Action📅 20 Oct 2025 | 15M Chart | Yogiraj Trading Academy
After a strong reversal confirmation, Gold has perfectly respected the Inverse Head & Shoulders structure on the 15-minute chart.
As highlighted earlier, the key breakout zones of 4323 and 4380 acted as the decision points — once broken and sustained, the market confirmed trend continuation.
🔍 Technical Breakdown:
Timeframe: 15 Minutes
Pattern: Inverse Head & Shoulders
Breakout Zone: 4323–4380
Current Status: Breakout confirmed; retest expected
Next Target: 4440+ zone
Stop-loss Zone: Below 4280 (structure invalidation)
⚙️ Market Psychology:
This setup shows how markets transition from accumulation to expansion.
Traders who entered prematurely during consolidation faced whipsaws, while disciplined traders who waited for neckline breakout confirmation entered at optimal risk-reward points.
🧘 Lesson from This Case:
Confirmation > Prediction.
Patterns reflect emotions — fear at lows, greed near breakouts.
Structure-based entries build long-term consistency.
🚩 Yogiraj Trading Academy Insight:
At Yogiraj Trading Academy, we integrate Technical Analysis + Trading Psychology + Discipline to guide traders toward independence and emotional mastery.
Always trade with risk management, clarity, and patience — the real pillars of professional trading.
📊 Watchlist Levels:
Support: 4280 / 4250
Resistance: 4380 / 4440
Continuation likely if sustained above 4380
⚔️ Trade at your own risk with proper discipline and capital protection.
#YogirajTradingAcademy #XAUUSD #TechnicalAnalysis #MarketPsychology #HeadAndShoulders #TrendContinuation #TradingMindset #yogeshonale

XAUUSD: Accumulation Within Price Channel XAUUSD: Accumulation Within Price Channel - Scalping Strategy Awaiting New Wave
Hello traders community,
XAUUSD (Gold) is expected to move sideways today, with accumulation being the main theme. Although the long-term upward pressure remains intact, in the short term, the market needs a "breather" and to accumulate more liquidity before it can break out strongly.
📰 Macro Analysis & Cash Flow
Fundamental factors continue to provide a solid "support floor" for Gold prices:
Safe Haven Flows: Ongoing trade uncertainties and geopolitical tensions show no signs of cooling down, continuing to favor safe-haven assets like Gold.
Weak USD: Expectations of an early Fed rate cut, combined with the risk of a US government shutdown, are weakening the USD and indirectly supporting XAUUSD.
Conclusion: The foundation for an upward trend remains very solid. Sideways movements or short-term corrections should be seen as opportunities.
📊 Technical Analysis
On the H1 chart, we clearly see Gold moving within a "Corrective Ascending Channel." This is a typical accumulation pattern.
Resistance Zone ("SELL LIQUIDITY POC"): The $4340 - $4342 zone is an extremely important resistance area. This is the confluence of the upper edge of the price channel and the Point of Control (POC) for Sellers. Profit-taking and short-selling pressure will be strong here.
Support Zone ("Buy scalping"): The $4207 - $4209 zone is the underlying structural support, corresponding to the lower edge of the price channel. This is where Buyers can step in to "Buy the dip."
Current Status: The price is "compressed" within this range, creating excellent short-term trading opportunities.
🎯 Intraday Trading Plan (Scalping)
With sideways movement being the main scenario, the optimal strategy is short-term trading (scalping) at the two edges of the price channel.
Scenario 1: Short Selling (Sell) 📉
Entry: $4340 - $4342
(SL): $4350
(TP): $4320 - $4302 - $4288 - $4260 - $4242
Scenario 2: Short Buying (Buy) 📈
Entry: $4207 - $4209
(SL): $4200
(TP): $4233 - $4250 - $4275 - $4290
Summary
Today is an ideal day for scalpers. Prioritize short-term trades within the $4207 - $4342 range. A strong breakout beyond one of the two edges of this price channel will be a confirmation signal for the next trend.
Always manage your capital tightly and trade with discipline!

Gold’s Final Surge Before the Fall: The Herd Joins at the TopGold has rallied over 27% exactly as projected in the previous analysis
Now, the structure shows clear signs of exhaustion — price is approaching the end of wave 5, historically the stage where euphoria peaks and reversals are born.
Across the world, the crowd is piling into gold in a classic late-cycle buying frenzy. This kind of herd behavior — “everyone rushing to buy at once” — has always marked the final chapter of impulsive moves before major trend reversals.
The chart highlights potential trigger zones for the coming reversal:
Upper red dashed lines: triggers for aggressive traders
Lower red dashed lines: triggers for more conservative entries
Once those levels start breaking down, expect momentum to flip hard — and fast — signaling the beginning of a sharp corrective phase for gold.

Gold price analysis October 17GOLD UPDATE – The uptrend shows no signs of stopping
The gold market is in the most “breathable” phase for the Buyers — almost every BUY strategy has brought profits overnight. The bullish momentum remains strong, showing that money continues to flow into this precious metal.
The next target that Gold is aiming for is around 4450, and any correction can be seen as a “golden” opportunity to join the main trend.
📈 Trading strategy:
BUY Trigger: when a price rejection signal appears at the support zones 4285 – 4242 – 4216
🎯 Target: 4450
👉 In this context, following the Buyers is still the only reasonable option. Observe the price reaction around the support zones and just “press the BUY button” when the signal appears.

A Sell Setup For GoldAfter finishing and achieving my Gold Target (which was over achieved) Now will try to sell it. Lets see how it goes today with good R:R.
Kidos

The Fundamentals That Could End the Debasement TradeThe “debasement trade” has emerged as one of the key market themes: a strategy based on the loss of value of fiat currencies amid unlimited monetary creation, rising public debt, and the erosion of purchasing power. In this context, investors have turned to so-called “tangible” assets—gold and silver—viewed as safe havens against monetary dilution.
But while this narrative has dominated much of the year, several fundamentals could gradually bring it to an end by late 2025.
First, the end of the U.S. government shutdown would restore confidence in American fiscal management and reduce the political risk premium. In the same vein, clearer fiscal consolidation and a return to minimum budget discipline could signal that governments are regaining control over the trajectory of deficits and debt. This mere shift in perception could be enough to ease fears of U.S. dollar “debasement.”
At the same time, if central banks maintain or raise real interest rates, fiat currencies would regain competitiveness against non-productive assets. Positive real yields restore the value of cash and reduce the appeal of inflation hedges. This is even more true if inflation expectations decline: less fear of price surges means less need to seek protection through gold or other precious metals.
A stable or stronger dollar would reinforce this dynamic—it is, in fact, the most important factor signaling the end of the debasement trade.
Historically, a firm greenback weighs on precious metals while signaling renewed confidence in monetary stability. At the same time, a better global growth environment could redirect capital toward risk assets at the expense of “hard assets.”
Another key element is the tightening of liquidity conditions. Less money in circulation and less speculative excess would dry up flows into safe-haven assets. Similarly, a geopolitical de-escalation would reduce demand for protective values. If, in parallel, institutions reallocate toward bonds—attracted by once again appealing yields—that would mark the end of the great flight from the fiat system.
Finally, the real turning point will come with the return of political and monetary credibility. When markets once again perceive authorities as capable of managing debt, inflation, and growth without resorting to the printing press, the engine of the debasement trade will naturally shut down. Once confidence is restored, the risk premium on tangible assets will decline, placing the dollar, real yields, and macroeconomic discipline back at the center of the game.
DISCLAIMER:
This content is intended for individuals who are familiar with financial markets and instruments and is for information purposes only. The presented idea (including market commentary, market data and observations) is not a work product of any research department of Swissquote or its affiliates. This material is intended to highlight market action and does not constitute investment, legal or tax advice. If you are a retail investor or lack experience in trading complex financial products, it is advisable to seek professional advice from licensed advisor before making any financial decisions.
This content is not intended to manipulate the market or encourage any specific financial behavior.
Swissquote makes no representation or warranty as to the quality, completeness, accuracy, comprehensiveness or non-infringement of such content. The views expressed are those of the consultant and are provided for educational purposes only. Any information provided relating to a product or market should not be construed as recommending an investment strategy or transaction. Past performance is not a guarantee of future results.
Swissquote and its employees and representatives shall in no event be held liable for any damages or losses arising directly or indirectly from decisions made on the basis of this content.
The use of any third-party brands or trademarks is for information only and does not imply endorsement by Swissquote, or that the trademark owner has authorised Swissquote to promote its products or services.
Swissquote is the marketing brand for the activities of Swissquote Bank Ltd (Switzerland) regulated by FINMA, Swissquote Capital Markets Limited regulated by CySEC (Cyprus), Swissquote Bank Europe SA (Luxembourg) regulated by the CSSF, Swissquote Ltd (UK) regulated by the FCA, Swissquote Financial Services (Malta) Ltd regulated by the Malta Financial Services Authority, Swissquote MEA Ltd. (UAE) regulated by the Dubai Financial Services Authority, Swissquote Pte Ltd (Singapore) regulated by the Monetary Authority of Singapore, Swissquote Asia Limited (Hong Kong) licensed by the Hong Kong Securities and Futures Commission (SFC) and Swissquote South Africa (Pty) Ltd supervised by the FSCA.
Products and services of Swissquote are only intended for those permitted to receive them under local law.
All investments carry a degree of risk. The risk of loss in trading or holding financial instruments can be substantial. The value of financial instruments, including but not limited to stocks, bonds, cryptocurrencies, and other assets, can fluctuate both upwards and downwards. There is a significant risk of financial loss when buying, selling, holding, staking, or investing in these instruments. SQBE makes no recommendations regarding any specific investment, transaction, or the use of any particular investment strategy.
CFDs are complex instruments and come with a high risk of losing money rapidly due to leverage. The vast majority of retail client accounts suffer capital losses when trading in CFDs. You should consider whether you understand how CFDs work and whether you can afford to take the high risk of losing your money.
Digital Assets are unregulated in most countries and consumer protection rules may not apply. As highly volatile speculative investments, Digital Assets are not suitable for investors without a high-risk tolerance. Make sure you understand each Digital Asset before you trade.
Cryptocurrencies are not considered legal tender in some jurisdictions and are subject to regulatory uncertainties.
The use of Internet-based systems can involve high risks, including, but not limited to, fraud, cyber-attacks, network and communication failures, as well as identity theft and phishing attacks related to crypto-assets.

GOLD XAUUSD PROFIT TAKING IS NORMAL ,market marker start rally and later take there money...trading is demand and supply.
layer by layer
#gold #xauusd


Gold is correction done? 22/Oct/25XAUUSD probably will break the uptrend line (blue) since triangle breakouton August as price now just stalling at the trendline before creating panic selling /stop lost..Price could reach as low as 3940 +/- before...

XAU LongsOkaaaay, got busted out the last long set after coming in hot from shorts 🥵 !!!
Looking for longs with same targets from previous post. $4318 is coming back I guarantee it and will be on way once $4150 gets the closures…
If you paid any attention to previous posts I did mention $4141 was the target if she was to roll over with extremes into $4011 📍
Asia delivered with a sharp reaction and we currently need the lows printed to sustain.
Major handle here is $3983 and can be driven back however if the low is the target with a max low end into $3938 so allow and leave room to layer in. 🧠
Above is a second profile at $4108 and if she gets over with closures i believe she will work on $4150 to settle then the blender begins where I think we will start consolidating/charging up for release on CPI…
Full target remains at $4484.74
Let’s see how we go people!!!!
🫶🏽🫶🏽🫶🏽

Gold faces a technical correction – watching 4185–4190 zone📊 Market Overview:
Gold (XAU/USD) fell sharply from 4260 to 4190 during the Asian–European sessions before stabilizing near 4195. Selling pressure came mainly from rising US bond yields and a stronger USD. However, the 4185–4190 support area may trigger technical buying in the upcoming US session.
📢Technical Analysis:
• Support: 4185 – 4178 – 4162
• Resistance: 4212 – 4230 – 4250
• Price remains below the EMA50 (H1), keeping the short-term bias bearish.
• Narrowing candles on H1 suggest market compression ahead of the US session.
• A close below 4185 could extend losses toward 4170–4160; holding above may trigger a rebound to 4210–4230.
💡 Outlook:
Gold is in a corrective phase with sellers still dominant. The 4185–4190 zone is a key short-term pivot for direction confirmation.
🎯 Trade Idea:
🔻 SELL XAU/USD : 4225–4228
🎯 TP: 40 / 80 / 200 pips
🛑 SL: 4231

Is the plunge in gold prices a trend or a correction?
News:
Recent fiscal and political uncertainty in the United States continues to linger, with the recurring risk of a government shutdown and the slow pace of fiscal negotiations disrupting economic data releases and expectations management. On the monetary policy front, market expectations for further Fed rate cuts persist, forming a "mildly dovish" psychological anchor alongside the Fed's forward guidance. This limits the upward potential for real interest rates, favoring gold, a non-yielding asset. Meanwhile, geopolitical tensions remain, reinforcing the value of safe-haven assets. Furthermore, any unexpected surprises in the upcoming US inflation report could trigger a repricing of the interest rate path, potentially significantly increasing short-term volatility.
The dollar's temporary strength is primarily driven by the resilience of the equity market and the stickiness of short-term yields. However, this "strength" reflects more of a short-term suppression than a trend reversal. If inflation and growth weaken marginally, or if the market re-prices its assumption of two rate cuts, the dollar will have room to retreat, and gold could gain additional momentum.
Specifically:
Structural bullish: From a long-term perspective, gold prices have completed a large M-shaped upward trend. If they fail to break below the effective support level of 4100, the theoretical target range could gradually move towards 4200-4300 (corresponding to the linkage between trend continuation and rising risk premiums). This path relies on the macroeconomic combination of continued geopolitical uncertainty, falling inflation, and lower interest rates, which has not been overturned.
Trading strategy:
Buy: 4085-4075, SL: 4060, TP: 4145-4180

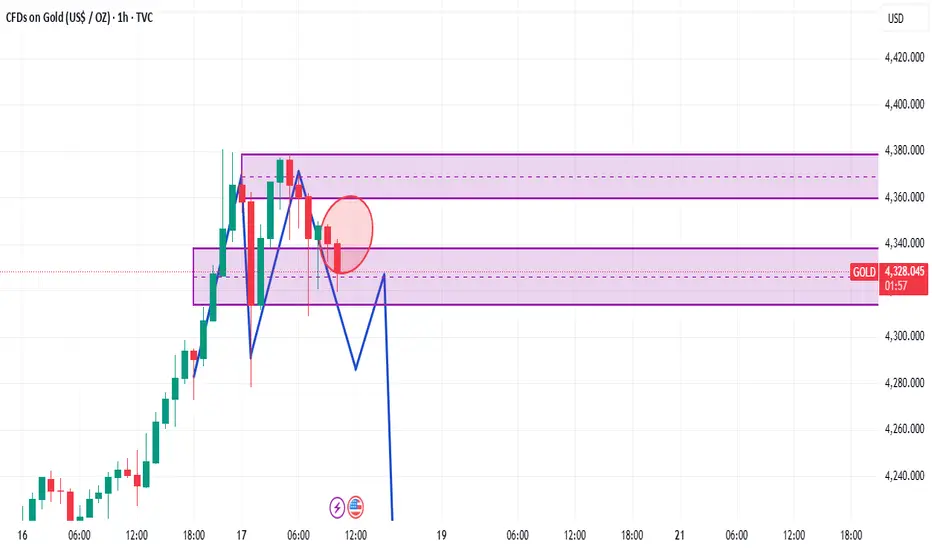
Gold drops sharply – profit-taking pressure spreads💹 1. Market Overview
Gold (XAU/USD) continued its sharp correction today, falling from $4,347 → $4,318 after failing to sustain above the $4,382 high.
The decline mainly came from:
Heavy profit-taking near strong resistance zones.
USD rebound and Treasury yields rising again.
Market sentiment turned cautious as traders await Fed’s next move on the rate-cut cycle.
📊 2. Technical Analysis
• Short-term trend: Correction within the medium-term uptrend channel.
• Resistance zones: $4,340 – $4,355 | $4,370 – $4,382 – $4,400
• Support zones: $4,318 – $4,305 | $4,285 – $4,260 – $4,240
• EMA20 – EMA50 (H1): Price testing below EMA20 → needs H1 close above $4,330 to confirm recovery.
• RSI (H1): Down to 42 → correction pressure still dominant.
• Volume: Increased at $4,318 → possible dip-buying activity emerging.
🔮 3. Outlook
Gold is in a healthy technical correction after the strong rally.
The medium-term bullish trend remains valid as long as price holds above $4,285.
If a bullish reversal candle appears near $4,315–$4,320, buyers could re-enter.
A break below $4,300 could trigger a deeper fall to $4,285 – $4,260.
🎯 4. Trading Strategy
🔻 SELL XAU/USD : $4,419 – $4,421
🎯 TP: 40 / 80 / 200 pips
🛑 SL: $4,425
🔺 BUY XAU/USD: $4,303 – $4,300
🎯 TP: 40 / 80 / 200 pips
🛑 SL: $4,296

XAU Shorts DemolishedGreat work everyone!!!!
Love to all and stay happy at the least…
Crucial handle here is $4281, we can see some extreme low ends on $4233 before rushing out on a high note.
Definitely Pay attention to $4281 for closures because when she’s ready we should be taking back ground on $4318 and taking flights to $4484.74!!!!! ✈️
Refer to the original longs post from yesterday for handle and best of luck… 🤞
Confirm with closure 🫶🏽🤝🏾

AXUUSD Set trapsMany say that gold will be strengthened by a strong bearish correction
This is mostly not true
Gold will rise as soon as the market opens.
Don't waste the opportunity and think wisely

Gold Analysis and Trading Strategy | October 17-18✅ 4-Hour Chart Analysis:
Gold has entered a clear correction phase after a prolonged rally, with a recent high near 4379.52 followed by a sharp drop to around 4215.
Currently, the price is trading above the Bollinger middle band (around 4111), while MA5, MA10, and MA20 are all turning downward — indicating that short-term bullish momentum is weakening.
The Bollinger Bands are beginning to narrow, suggesting that volatility is calming. As long as the price holds above MA20 (around 4110), the medium-term bullish structure remains intact.
In the short term, gold may continue to consolidate between 4210–4280. If it breaks below 4200, a further correction toward 4150–4170 is possible.
✅ 1-Hour Chart Analysis:
On the 1-hour timeframe, gold has shown a steady decline after peaking near 4379, confirming a short-term bearish shift.
MA5, MA10, and MA20 have formed a bearish crossover, and the Bollinger Bands are opening downward — indicating that bears currently dominate the market.
The price is hovering near the lower Bollinger Band (around 4210), suggesting a potential for a short-term rebound, but resistance lies at 4240–4250.
If the rebound fails to hold, gold is likely to remain in a weak consolidation range between 4200–4250.
🔴 Resistance Levels: 4240–4250 / 4280–4290 / 4320
🟢 Support Levels: 4200–4190 / 4170–4150
✅ Trading Strategy Reference:
🔰 If the price rebounds to 4240–4250 and faces resistance, consider light short positions.
🎯 Targets: 4210 / 4190
🔰 If gold retraces to the 4170–4190 zone and holds steady, consider entering long positions in batches.
🎯 Targets: 4230 / 4250
📊 Summary:
Gold has entered a high-level correction phase after an extended rally. The medium-term bullish trend is still valid, but momentum has slowed.
Traders are advised to control position size, stay flexible, and wait for clearer direction before making larger commitments.
Trapped in Shorts — Is There Still a Chance to Recover?During yesterday’s session, gold retested the 4200 support level and quickly rebounded, breaking above the 30 resistance and maintaining strong momentum throughout the consolidation phase. Not only did it hold the current bullish trendline, but it also decisively broke through the 50 resistance. After completing the support–resistance switch, today’s opening saw a surge driven by positive data and remarks from Fed’s Kashkari, sending prices soaring toward 4380. The bullish breakout has further strengthened the technical outlook for gold.
So far this week, gold has surged nearly $400, marking an impressive 8.8% gain—a truly remarkable move in the gold market.
This unexpected rally likely caused heavy losses for many short positions—hopefully, none of you were caught in the squeeze.
For those holding trapped positions, it may be wise to hold on temporarily; a pullback toward 4300 is still possible today. That area could provide a chance to reduce losses—or even turn them into profits with proper management.
Trading Strategy:
Continue to follow the prevailing trend—look for buying opportunities on pullbacks rather than chasing highs. Key supports are seen around 4326 (30M), 4309–4300 (1H), and 4314/4278 (2H). If prices stabilize above these zones, the bullish momentum could extend further.

BEARS GAINING MOMENTUMif this current h1 candle closes bearish within the block then it will be a good sign of more sells,
but we have to wait for 12pm to see if it will close below the block for a good sell entry