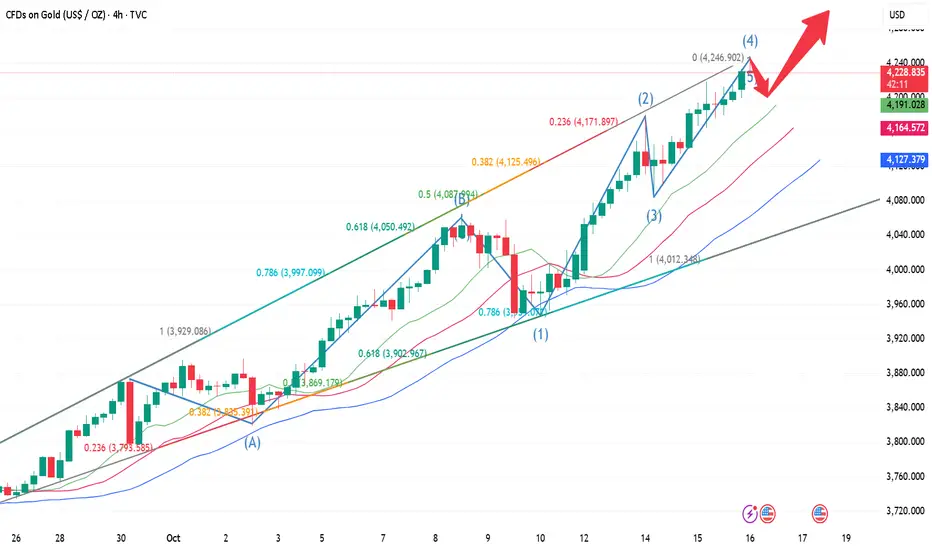
10.16 Gold maintains the upward trend in the Asian session!!!From a multi-period analysis perspective, first observe the monthly chart's rhythm. From a long-term perspective, 3130 represents a watershed in the long-term trend. Above this level, consider a long-term bullish approach. From a weekly perspective, the current bull-bear watershed is 3585. Above this level, consider a medium-term bullish approach. From a daily perspective, focus on the 3997 support area for now. Above this level, consider a short-term bullish approach. From a four-hour perspective, which we've consistently emphasized, support currently lies at 4175. Above this level, consider a short-term bullish approach. On an hourly basis, prices are also currently bullish, but short-term divergence is occurring. Therefore, be mindful of short-term bullish risks in the event of further upward movement. Meanwhile, today's early trading session saw another surge in gains, with the early morning low serving as a watershed for the day. Above this level, consider a short-term bullish approach. Focus on the 4235-4266 area as an upward move.
Gold's Asian session low of 4199.73 marks the intraday watershed. Above this level, bullish momentum is expected to continue. (Also, a divergence is occurring in the hourly chart, so be aware of the risks associated with a short-term rally.)
Trade ideas
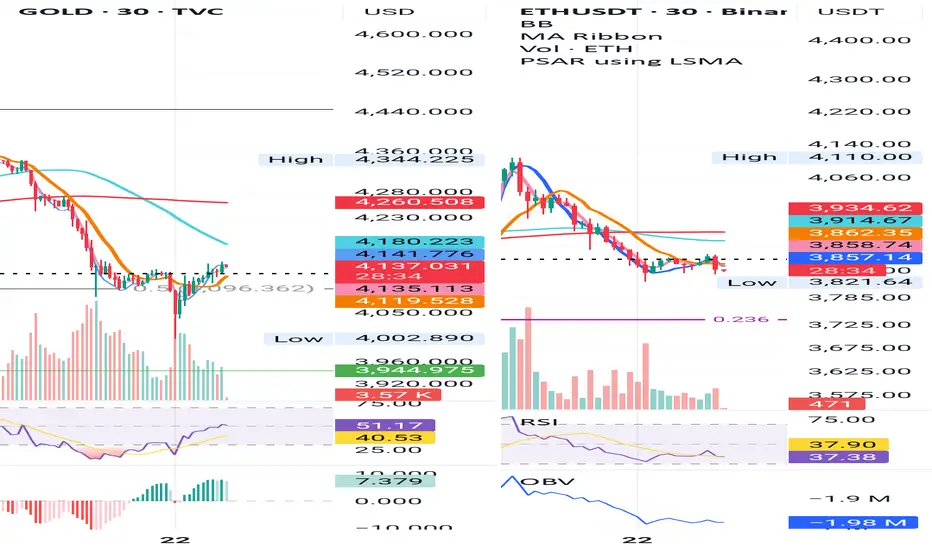
Gold & ETH 30-Min – Parallel Structures, Subtle Differences
Gold found support right at the 0.5 Fib 4096 $ and is now trading above yesterday’s close, a sign of renewed strength.
ETH, meanwhile, is retesting yesterday’s close as support but is now slipping slightly below it, showing early weakness after failing to sustain the bounce.
From a system perspective, both charts are aligned:
BB Center < SMA < Price < MLR, a constructive setup that still supports potential continuation, if price stabilizes above support.
However, Gold continues to show more strength, holding structure more cleanly and staying resilient above key short-term levels.
This parallel move between a risk asset (ETH) and a defensive one (Gold) suggests a market in transition: strength rotating, but not breaking.
Bias: Short-term neutral-to-bullish, Gold firm, ETH needs confirmation.
Always take profits and manage risk.
Interaction is welcomed.
BULLS IN CONTROL We are now buying, gold went down to test a major buy zone around 4004 and now trying to close above 4125, so you can buy around 4127-22 and tp at 4190 or even allow it to run but it's best to just after 6am UTC if price is still above 4125 by then, better still you can buy now because it will definitely buy more .

Are AI Comments Taking Over TradingView?Lately, I’ve noticed a pattern in many idea comment sections — perfectly structured replies that sound smart but feel… robotic.
It made me wonder how much of the community interaction we see here is actually human anymore.
🔍 Why it matters
TradingView was built around discussion and idea sharing.
But if AI tools start filling comment sections, it becomes harder to tell whether you’re learning from real traders or just reading automated feedback.
💡 How to spot AI-generated comments
Too polished: Sentences are perfectly balanced, emotionless, and often repeat the same structure.
Generic praise: “Great analysis, thanks for sharing!” — repeated under hundreds of different tickers.
No real chart feedback: They never mention levels, entries, risk, or timing.
Repetitive language: Look for identical sentences or phrases across multiple ideas.
🧭 Why I wrote this
This isn’t to criticize anyone — I actually use AI for research myself.
But I believe human experience, real charts, and emotion still matter in trading.
AI can support us, but it shouldn’t replace our community.
📣 What do you think?
Have you noticed more AI-style comments lately?
Do you think they help, or do they make it harder to learn from others?
Follow if you want more educational posts about real market logic, trading psychology, and tech’s impact on trading.
#AI #tradingview #education #markets #tradingpsychology #daytrading #stocks #community
GoldGold 🥇 | Comprehensive Technical Analysis - Setting a Significant Rejection Zone
Current Price: Around $4,353 | Timeframe: Daily - Weekly
Date: October 21, 2025
══════
📊 Overview On the Market:
Gold has completed an exceptional bullish cycle, reaching new all-time highs above 4,400, which I believe represents the local high for the current phase.
However, several technical factors now point to an imminent correction before any potential continuation.
══════
🔍 Key Technical Notes:
▪️ Price Zone:
The stock is currently trading in a bullish zone—an area where institutional investors historically tend to take profits and open short positions.
▪️ Market Sentiment:
Fear and Greed Index: 78/100 (Extreme Greed)
These extreme readings in bullish zones precede corrections in 85% of historical cases.
▪️ Structural Analysis:
- Overall Structure: Bullish (higher timeframes)
- Internal Structure: Showing signs of weakness and bearish divergence
- A potential Change in Personality (CHoCH) is forming on medium timeframes
▪️ Supply and Demand Zones:
Multiple untested resistance zones below, as well as unfilled fair value gaps that act as price magnets.
▪️ Multiple Timeframe Analysis:
Price is analyzed across multiple timeframes (4-hour, 1-day, 1-week, etc.) using advanced order flow techniques and proprietary market structure mapping tools—all of which point to a potential upcoming correction.
══════
🎯 Expected Scenario (High Probability):
Stage 1 - Initial Correction:
📍 Target 1: $3,777-$3,816
(Balance Zone)
📍 Target 2: $3,688-$3,749
(Discount Zone - Optimal Entry)
Stage 2 - Deeper Correction (Moderate Probability):
📍 Target 3: $3,465-$3,580
(Strong Institutional Demand - Buy Orders)
In addition to unfilled fair value gaps that act as price magnets.
Note: Additional Confirmation Required
After Reaching the Discount Zones:
The possibility of a continued uptrend exists, but is not currently highly likely. The situation will be reassessed upon reaching the demand zones.
══════
⚡ Why this analysis?
This analysis is based on:
✓ Advanced order flow analysis techniques
✓ Professional tools for mapping market structure
✓ Premium/Discount Zone Theory
✓ Detecting institutional order blocks
✓ Market sentiment analysis
✓ Liquidity level mapping
These are not traditional retail trading tools; they are institutional analysis techniques used by professional traders.
═════
📚 Previous Record:
Some may remember my previous analysis of gold in August 2023:
📌 Analysis for August 13 2023:
- Expectations: Rise from 1780
- Targets: 2500 → 2800 → Over 3800
- Result: ✅ 100% Success Rate
- Actual Movement: Reaching over 4400 (147% Profit)
- Update (April 2024): "Trade Closed at Target"
This analysis is based on the same institutional framework applied to this current situation. The methodology is effective because it tracks actual cash flow—not trader sentiment.
═════ ═════
⚠️ Risk Management (Mandatory):
Regardless of your confidence level, risk management is non-negotiable:
✓ Don't risk more than 1-2% of your capital on each trade.
✓ Always set a stop-loss before entering.
✓ Avoid excessive leverage.
✓ Maximize your profits. Steps
✓ Research yourself (DYOR)
══════════════════════════════════════ ═════
⚖️ Disclaimer:
This is educational technical analysis and does not constitute financial advice or an investment recommendation.
Trading carries a significant risk of capital loss.
Past performance does not guarantee future results.
Trade at your own risk.
Consult a licensed financial advisor before making any investment decisions.
══════
💬 Share your opinion with us:
What do you think of gold at these levels?
📊 If you found this analysis helpful, don't forget to like and follow it for more analysis.
🔔 Turn on notifications to receive updates as soon as this setting develops.
═════

GOLD: Next Move Is Up! Long!
My dear friends,
Today we will analyse GOLD together☺️
The price is near a wide key level
and the pair is approaching a significant decision level of 4,315.29 Therefore, a strong bullish reaction here could determine the next move up.We will watch for a confirmation candle, and then target the next key level of 4,350.59.Recommend Stop-loss is beyond the current level.
❤️Sending you lots of Love and Hugs❤️

uptrend confirmed in 1H timeframeDear Traders,
The higher timeframe is still in an uptrend. TP - 4355
Thank regard
Giridhar

XAUUSDBased on my previous analyses, where I projected gold to rise from $2,900 toward $4,500, the price has now reached $4,380. However, this is not the end of the move. There is still a small upward leg remaining, likely targeting around $4,565 to complete this wave count. After that, gold is expected to enter a corrective phase lasting roughly one year, with a potential decline toward the $3,200–$3,120 range. For now, we’ll continue following this current wave until it completes, and then we’ll proceed with the next stages of the analysis.

Use Average as Resistance for GoldGold is rising rapidly, making this a risky trade. The 21-period EMA usually works well for gold on the 15-minute timeframe. With a trailing stop set just above the moving average, I’m planning to target the trendline.

XAUUSD is in buy area!Price level 4205.00 is a strong liquidity sweep showign up a momentum gain on GOLD to reverse from this long term support level gold has started to bounce off the level.
As daily and long term trend continue to be bullish price is highly likely to continue to remian upside with another momentum gain from this support level. A bullish trade is high probable from the long term support level.

Weekly Analysis for GOLDA strong retracement occurred from Friday which offer a great discount for buyers to get in again since gold is still in a strong bullish trend.

Take Profit Another trade hit the take profit mark. Covering the previous 4 losses before our system aligned,

GOLD XAUUSD Gold has been upgraded to qualify as a High-Quality Liquid Asset (HQLA) under Basel III regulations due to its unique characteristics that align well with the goals of liquidity and risk management in stressed market conditions.
Reasons Gold Qualifies as Basel III HQLA
High Market Liquidity:
Gold is widely traded on global exchanges and over-the-counter markets with deep liquidity, ensuring it can be quickly converted into cash at predictable prices, even in stressed conditions.
Low Credit and Counterparty Risk:
Unlike bank-issued securities, gold is a physical asset that does not depend on a counterparty’s creditworthiness, reducing risk during financial crises.
Safe-Haven Status and Historical Stability:
Gold has a long-standing reputation as a store of value and safe-haven asset during economic uncertainty, enhancing its reliability as a liquidity buffer.
Market Recognition and Standardization:
Gold is globally recognized, with transparent pricing and well-established custody and settlement mechanisms, fulfilling Basel Committee’s criteria for Level 1 liquid assets without haircut.
Diversification of Liquidity Sources:
Including gold as HQLA provides banks with an additional source of liquidity that is uncorrelated with sovereign or corporate debt, improving resilience under liquidity stress.
Summary
Gold’s upgrade to Basel III HQLA status reflects its strong liquidity, low credit risk, safe-haven appeal, and widespread market acceptance, making it a valuable asset for banks to hold in their liquidity buffers under the Liquidity Coverage Ratio requirements.
TRADING GOLD LAYER BY LAYER
#GOLD #XAUUSD

GOLD (XAUUSD) – Possible Bullish Setup Incoming!Gold just bounced off a strong demand zone (green area) after testing it multiple times — showing buyers are still defending this level hard 💪.
Right now, we’re seeing a potential retest pattern, and if price holds above the green zone, we could see a sharp push toward the supply zone (red area) around $4,250 – $4,300.
🧠 My plan:
Waiting for a pullback confirmation near support
Looking for bullish structure continuation
Targeting the upper resistance zone
Stop loss below the demand zone
📊 Key Levels to Watch:
Support: $4,000 – $4,050
Resistance: $4,250 – $4,300
⚠️ Note: Major USD news events are coming up — volatility could either fuel the breakout or cause fake moves. Stay alert!
---
🔥 What do you think —
Will Gold hold this level and fly to 4300?
Or will sellers break below 4000?
💬 Drop your analysis below 👇
❤️ Like if you’re bullish | 🔁 Repost if you’re watching XAUUSD this week!

COULD GOLD (XAU/USD) BOUNCE TO THE UPSIDE OR DROP?GOLD (XAUUSD) is currently being held by a strong support trend line which is is struggling to breakthrough.. however, it is currently in a new downtrend and could continue to fall to the downside.
If The support trendline has been broken, this will be a great sell opportunity.. if it struggles to break, then it will be a great buy opportunity. Keep an eye!

Gold rebounds sharply but remains volatile – watch 4100 & 4180🟡 Market Overview
After plunging near $4,000/oz, gold quickly rebounded to around $4,138/oz. The rally is now facing resistance near 4,150, as selling pressure emerges again. Market volatility remains high following this morning’s sharp drop.
📊 Technical Analysis
• Support: $4,100 – $4,110 and $4,000 – $4,020
• Resistance: $4,170 – $4,180 and $4,200
• EMA20: price fluctuating around EMA, showing indecision
• Candlestick pattern: long lower wick near $4,000 confirms strong buying interest at major support
💡 Outlook
Gold is in a technical rebound phase, but rapid intraday swings are likely. Holding above $4,100 supports a continued recovery; breaking below $4,090 could trigger a return toward $4,050 or even $4,000.
________________________________________
🎯 Suggested Trading Plan
🔺 BUY XAU/USD: 4,100 – 4,097
🎯 TP: 40 / 80 / 200 pips
🛑 SL: 4,093
🔻 SELL XAU/USD: 4,177 – 4,180
🎯 TP: 40 / 80 / 200 pips
🛑 SL: 4,183

XAUUSD Buy Setup – Reversal Building Above 4100 to 4274..Gold (XAUUSD) showed a sharp decline yesterday, falling from 4381 to 4005, marking a strong correction phase after making new highs. However, today’s price action indicates that buyers are stepping back in around the 4000 psychological Pivot Zone, suggesting potential reversal momentum.
Currently, gold is trading near 4140, and now there are high possibilities that gold will go for long till the Target level 4205 and Target level 4274..
KEY POINTS
Current price 4140
Target level 4205
Target level 4274
Pivot Level 4100/4080

Gold - short term pull back Gold has been running hot, but I’m expecting a relief move to the downside before continuation. We’ve just seen a bullish flag completion, and markets often need to cool off before resuming the larger trend.

XAUUSD A sniper insider trader is a highly strategic and precise investor who uses confidential, non-public information to make perfectly timed trades for maximum profit. Like a sniper, this trader acts with patience and accuracy, waiting for the ideal market moment to strike, often executing moves so subtle and calculated that they can go unnoticed by regulators or competitors.

Time for GOLD To DROP! (is XAUUSD heading to the downside?)For weeks gold (XAUUSD) has been sky rocketing to the upside, however there have been many new signals indicating that it could be a bearish move to the downside. Nothing keeps going up forever! Gold has broken major support levels + trend line and channel breakout. Time to sell!
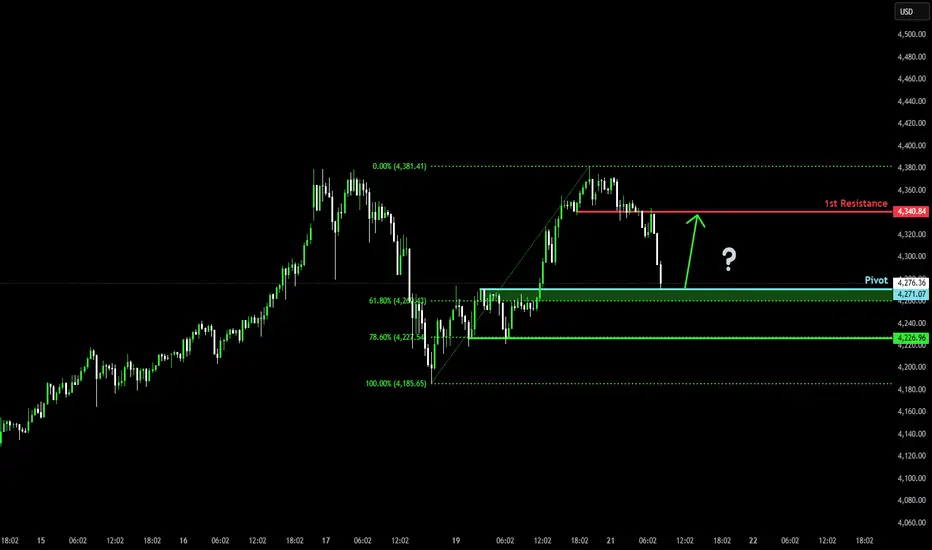
Could we see a bounce on Gold?The price is reacting off the pivot which is a pullback support and could bounce to the 1st resistance which acts as a pullback resistance.
Pivot: 4,271.07
1st Support: 4,226.96
1st Resistance: 4,340.84
Disclaimer:
The above opinions given constitute general market commentary, and do not constitute the opinion or advice of IC Markets or any form of personal or investment advice.
Any opinions, news, research, analyses, prices, other information, or links to third-party sites contained on this website are provided on an "as-is" basis, are intended only to be informative, is not an advice nor a recommendation, nor research, or a record of our trading prices, or an offer of, or solicitation for a transaction in any financial instrument and thus should not be treated as such. The information provided does not involve any specific investment objectives, financial situation and needs of any specific person who may receive it. Please be aware, that past performance is not a reliable indicator of future performance and/or results. Past Performance or Forward-looking scenarios based upon the reasonable beliefs of the third-party provider are not a guarantee of future performance. Actual results may differ materially from those anticipated in forward-looking or past performance statements. IC Markets makes no representation or warranty and assumes no liability as to the accuracy or completeness of the information provided, nor any loss arising from any investment based on a recommendation, forecast or any information supplied by any third-party.
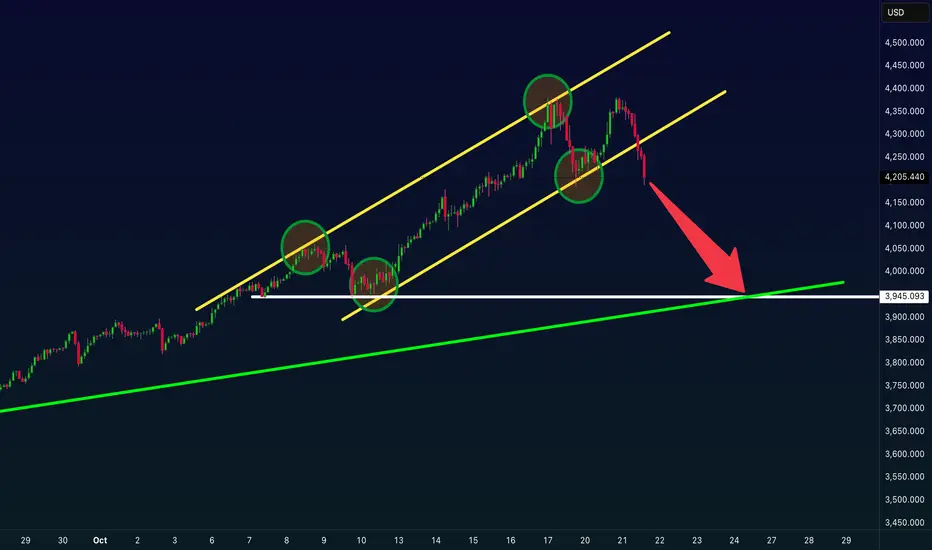
Big cycle M double top, beware of big pullbackGood morning, bros. Last night we proposed a strategy of short selling in batches if gold rises first and touches the upper pressure level of 4365-4380, and achieved good profits. After today's opening, gold rebounded to this range several times, and it can be said that it has basically recovered the losses since last Friday. However, the intraday rebounds have failed to effectively break through this resistance range. If the bulls want to fully counterattack and move towards the 4400 mark, they need to break through the upper resistance. Judging from the long-term trend, the market has a tendency to form an M-shaped double top, so be cautious in chasing the rise in intraday trading and beware of possible large market corrections.
Judging from the short-term trend, the resistance near 4350 is still obvious. If the European session rebounds to this level again without breaking through, the bull market will be difficult to sustain in the short term. We can consider trying a light short position once, but be sure to set a stop loss. At the same time, if the short-term support of 4330-4320 below cannot be held, gold will fall further to test yesterday's rebound low of 4305-4295. Once 4305-4295 is breached, it may trigger a technical sell-off, pushing the gold price to accelerate its correction to 4240 or even the 4220 neckline.
Trade intraday at key levels, but be wary of market whipsaws.
OANDA:XAUUSD

GOLD XAUUSD: Looking to short.Bearish within bullish. Is that a thing? Waiting for the first BOS and then a pullback. Then probably looking for sell entry once the second BOS happens.
However if the first BOS didn't happen then it will continue bullish.
Go GOLD!
