GOLD (XAU/USD): Bullish Move from SupportIt appears that there is a possibility of a continued bullish movement on 📈GOLD price, potentially originating from an underlined blue support cluster.
Furthermore, a brief liquidity sweep below that level, followed by a bullish breakout above a minor resistance on an hourly timeframe, seems to be observed.
The anticipated target for this bullish movement is 4300.
Trade ideas

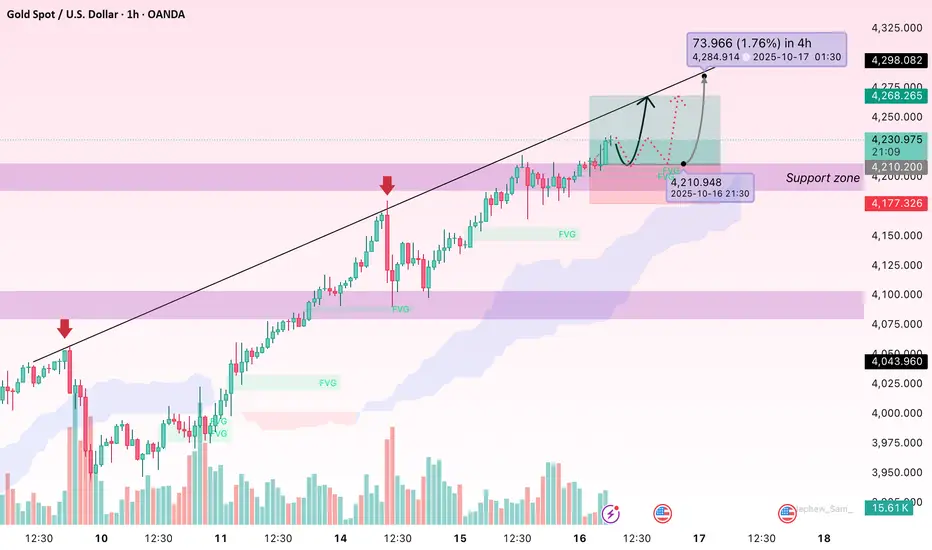
XAUUSD Maintains Uptrend – Potential Retest AheadHello everyone,
Today, observing the H1 gold chart, I notice that buying pressure remains strong, but recent minor pullbacks indicate the market is seeking balance before the next move. XAUUSD continues a clear uptrend with higher highs and higher lows, alongside multiple Fair Value Gaps (FVGs) forming and filling. The Ichimoku cloud lies beneath the price, sloping upward, creating a solid buffer, while volume slightly narrows near peak candles, signalling a healthy retest before a breakout.
Key support zones around 4210–4205 and 4190–4185 could allow minor retracements to “clean” liquidity before challenging resistance at 4238–4245 and moving toward 4268–4275. Conversely, if these supports weaken, selling pressure could drag the price down to 4168–4160 before the uptrend resumes.
On the macro side, Fed rate-cut expectations remain the primary support for gold. Recent statements by Chair Powell were dovish, and the Beige Book shows slower growth in some regions, usually pulling yields down and softening the USD. US–China geopolitical tensions and the risk of a prolonged government shutdown also drive safe-haven demand, while central bank and ETF net purchases continue, reinforcing the trend through pullbacks. Positive USD/yield data may only trigger technical retracements before the broader trend persists.
What do you think — will XAUUSD retest successfully or undergo a deeper pullback before breaking higher?
Gold Pulls Back in Technical Correction, No Reversal Signal YetHello everyone,
Gold has entered a corrective phase after reaching the historical peak at 4,380–4,400 USD/oz. Selling pressure has emerged, triggering a strong bearish candle and sending price back to retest the 4,220–4,240 USD zone — also the lower boundary of the Kumo cloud on the Ichimoku system, acting as short-term support. At the moment, gold is attempting a slight recovery around 4,265 USD but still trades inside the Kumo cloud, suggesting a sideways correction after an overheated rally. On the H1 chart, the bullish structure has temporarily weakened with a sequence of Lower Highs and Lower Lows forming. The 4,280–4,310 USD area is a red Fair Value Gap (FVG) zone, currently serving as the nearest resistance where sellers may re-enter. Meanwhile, the thick Kumo cloud continues to reflect persistent corrective pressure, especially as recent declines were supported by rising volume — confirming profit-taking at peak levels.
From a fundamental perspective, this retracement is a healthy “cool-down” following nine consecutive weeks of gains. Gold surged nearly 25% in just two months — an exceptionally rare move in history — so profit-taking was inevitable. Additionally, sentiment has been influenced by the Federal Reserve’s lack of clear commitment regarding the timing of rate cuts. Recent US macro data such as CPI and retail sales exceeded expectations, giving the Fed justification to maintain a cautious stance. This has boosted the US Dollar Index (DXY) back toward 106.5, while the US 10-year Treasury yield has moved near 4.1%, reducing gold’s appeal as a non-yielding asset. Risk sentiment has also improved as geopolitical tension between the US and China cooled and the US government avoided a shutdown, prompting some safe-haven flows to rotate out of gold. Several analysts agree that this pullback is constructive for the broader trend, with Alex Kuptsikevich from FxPro noting that gold was “overbought” and needed a rebalancing phase, while Phillip Streible of Blue Line Futures reiterated that the long-term trend remains bullish.
In the short term, gold may continue to move within the 4,220–4,280 USD range, with a potential retest of the 4,210–4,220 USD zone — the lower boundary of the Kumo cloud. If buyers step back in and price breaks above 4,285 USD, a rebound toward the 4,300–4,315 USD FVG resistance zone is likely before the market decides its next direction. Only a confirmed break below 4,200 USD would reinforce further downside toward 4,150 USD. Conversely, holding above 4,200 USD would suggest gold is still in a healthy consolidation phase and retains the potential to revisit 4,300–4,350 USD in the coming sessions.

XAUUSD – Favor the BULLISH scenario, trade the price channelMacro backs the bulls: Gold just broke above $4,200/oz on expectations of imminent Fed rate cuts, while geopolitics and renewed US–China trade tensions are sending flows back into safe havens. Such capital typically doesn’t “flip” quickly, so the uptrend still has room.
H1 technicals: Price is moving cleanly inside an ascending channel with clear push–pause rhythms. The lower trendline is providing solid support; the 4.22x area is the nearest footing, with an overhead supply zone at 4.28x–4.30x.
Reference trade plan:
Wait for a pullback to 4,228–4,222 to buy the continuation.
SL: below the channel floor around 4,196–4,200 to avoid noise.
TP1: 4,250, TP2: 4,272, TP3: 4,295–4,305 (scale out into the supply zone).

GOLD → The aggressive trend continues. Focus on 4240FX:XAUUSD continues to break records, testing the $4,240 level amid a weakening dollar and sustained demand for safe-haven assets. The risks of a correction are growing as economic news releases approach.
Key supporting factors: Statements by US officials about China's “seizure of supply chains” and retaliatory measures are keeping markets on edge. US shutdown: The government shutdown is costing the economy $15 billion a week, increasing uncertainty. The probability of a rate cut in October and December is ~95%, which is putting pressure on the dollar. However, statements by Fed officials may adjust market expectations.
The bullish trend for gold remains unchanged. Any corrections will be seen as a buying opportunity. Key benchmarks are the development of the trade conflict and negotiations on the resumption of the US government.
Support levels: 4212, 4203
Resistance levels: 4234, 4235, 4250
Within the uptrend, it is worth waiting for a correction to support in order to open positions more profitably. There are no reasons for a trend reversal, and the fundamental background is bullish. We expect a retest of support before growth. However, a breakout of the 4234-4239 zone could trigger further growth!
Best regards, R. Linda!

GOLD 4H CHART ROUTE MAP Hey Everyone,
This is an extended 4H chart idea, continuing from our previous analysis, now with the added Goldturn levels above, allowing us to continue to track ongoing movement.
After completing the 4212 move, price continued to push upward, leaving a small gap near 4383 before facing rejection. We’re now seeing price retest the lower Goldturn levels for support, with a current test around the 4212 Goldturn. The 4212–4154 zone remains a key weighted area, and as long as price holds above this zone, we may see a potential bounce.
We’ll return on Sunday with our multi-timeframe roadmap and trading plans for the week ahead. Thank you all once again for your continued support, likes, and comments, we truly appreciate it.
Mr. Gold
GoldViewFX

What to Do When the Market Is in an Uptrend?Hello everyone,
When the market is rising , most traders get excited. Every price push feels like a wave of enthusiasm – everyone believes they are on the winning side. But in reality, even in the most favorable conditions, not everyone makes a profit . The simple reason: a rising market does not automatically mean a win; it’s about knowing when to buy and when to wait . I’ve seen many traders jump into positions just because the price is going up, only to be surprised when the market pulls back . An uptrend is not a straight line up, but a series of higher highs – pullbacks – higher highs , and the winners are those who know how to choose the right timing.
Confirm the Trend – Don’t Confuse Uptrend with a Technical Rebound:
Before placing a trade , the first step is to confirm whether the market is truly in an uptrend . A proper uptrend should have higher highs and higher lows , with the price staying above moving averages like EMA 20, EMA 50, or above the Ichimoku Kumo cloud . If the price just bounced from a low after a sharp decline, it may only be a technical rebound , and confusing the two can make you buy at the top . For example, when gold keeps forming new highs at 1,920 – 1,940 USD/ounce, while the lows remain higher than the previous ones, the money flow clearly supports the uptrend .
Buy on Pullbacks – “Buy the Dip” Is a Smart Entry:
Once the uptrend is confirmed, the next step is to choose the right entry point . Don’t rush to follow the price when the market is flying , as every uptrend has pause phases . Each minor correction or pullback is a chance to buy the dip . Watch important support zones , such as Fibonacci 0.5 or 0.618 or unfilled FVG areas . When the price touches these levels and shows a reversal signal , it is usually the highest probability entry point .
Note: even in an uptrend , the market may experience shakes due to profit-taking or short-term adjustments . This is normal and should not cause panic. In fact, the pullback is an opportunity to buy at a better price . Wait for a confirmation signal from candlestick reversals or indicators like RSI not oversold . For example, if gold rises from 1,900 to 1,940 and then pulls back slightly to 1,915 – 1,920, this can be a good entry , instead of chasing at the peak .
Risk Management – Stop Loss and Take Profit:
Even when the market is rising , risk management is crucial. Place Stop Loss below higher lows or the nearest support zone to protect against sharp pullbacks. Take Profit can be set at the next resistance zone , or use trailing stop to lock in profits as the price continues upward. For example, buying gold at 1,915 USD/ounce , you could place SL below 1,905 and TP near the resistance at 1,950 USD.
Monitor Macro News – Don’t Let Big Waves Sweep Away Profits:
A strong trend always has a reason behind it: monetary policies , inflation data , or global capital flows . Staying informed helps you avoid being caught off guard.
I’ve covered this part, you can click here to read more.
Patience and Discipline – Two Weapons to Survive an Uptrend:
One of the biggest challenges for traders is… standing still . When the market keeps rising , FOMO (fear of missing out) can make you jump in immediately, but most hasty trades end up buying right before a pullback . I’ve made this mistake many times – buying when the price is flying , then watching the position turn red in a few hours. Later, I realized that in an uptrend , patience to wait for a pullback is the key to winning. Wait for the price to return to a support zone , wait for a confirmation signal , then enter.
Discipline is not only about entry timing but also risk management . Place Stop Loss below the nearest low , Take Profit at the next resistance zone , and if the price continues upward , move SL favorably – trailing stop protects profits without exiting too early. Emotions are the biggest enemy of a trader ; greed or rushing leads to wrong decisions. Following your plan and discipline avoids unnecessary losses.
An uptrend is a perfect time to increase profits , but it can also make traders complacent . If you can identify the trend , wait for the right entry , and maintain discipline , you will not only ride the wave but also survive it. Is the market rising? The question is not whether to buy or not , but whether you have enough patience to wait for the right moment .

XAUUSD: Price can Drop to Support Zone and Break Trend LineHello everyone, here is my breakdown of the current Gold setup.
Market Analysis
Gold has been in a very strong uptrend, which accelerated after breaking out of a prior Upward Channel. This led to a new, steeper rally along a major Trend Line, culminating in a new All-Time High around the 4380 mark.
Currently, after reaching that peak, the price has completed a healthy correction back down to the main Trend Line, which also aligns with the Support zone at the 4250 level. The price has bounced from this area and is now attempting to rally again.
My Scenario & Strategy
My scenario is a bearish one, built on the idea that this second attempt to rally will fail to make a new high. I'm looking for this current rally to lose momentum as it approaches the prior ATH of 4380. The key signal for me would be a strong and clear rejection from that area, showing that buyers no longer have the strength to continue pushing the price higher.
Therefore, the strategy is to watch for this failure at the highs. A confirmed reversal would validate the short scenario and should lead to a decline that breaks the major ascending Trend Line. The primary target for this corrective move is 4205, which is inside the major Support zone.
That's the setup I'm tracking. Thank you for your attention, and always manage your risk.

Lingrid | GOLD Consolidation - Breakout - Momentum TradeThe price perfectly fulfilled my previous idea . OANDA:XAUUSD recently made new all-time high inside a steep upward channel, maintaining strong bullish momentum. The structure suggests a healthy correction phase forming a short-term range above the 4,280 support zone. As long as the price remains above the upward trendline, the bullish structure remains intact with potential continuation toward 4,450 and higher. The ongoing range formation may serve as consolidation before the next impulsive breakout higher.
⚠️ Risks:
A sustained break below 4,280 could trigger a deeper correction.
Rising U.S. yields or hawkish Fed comments may weigh on gold prices.
Reduced geopolitical tension could cool safe-haven demand.
If this idea resonates with you or you have your own opinion, traders, hit the comments. I’m excited to read your thoughts!

THE KOG REPORT - UpdateEnd of day update from us here at KOG:
A fantastic start to the week with price following and the indicator levels on the dip before resuming the move upside into the regions we wanted. We did say yesterday that the move on Friday was a little suspicions and we had a feeling they would correct the move this week, little did we know it would happen in one day.
We have now broken above the level after updating traders suggesting scalps only for the short from the hotspot, which worked well but we're a little stretched now. Support here is way down at the 4310-6 level and resistance stands at 4355 which is where we may get a potential RIP back into support before further advances in price.
KOG’s bias of the week:
Bullish above 4230
Bearish below 4220
RED BOXES:
Break above 4255 for 4265✅, 4270✅, 4284✅ and 4304✅ in extension of the move
Break below 4237 for 4230, 4220, 4210, 4206, 4185 and 4177 in extension of the move
As always, trade safe.
KOG

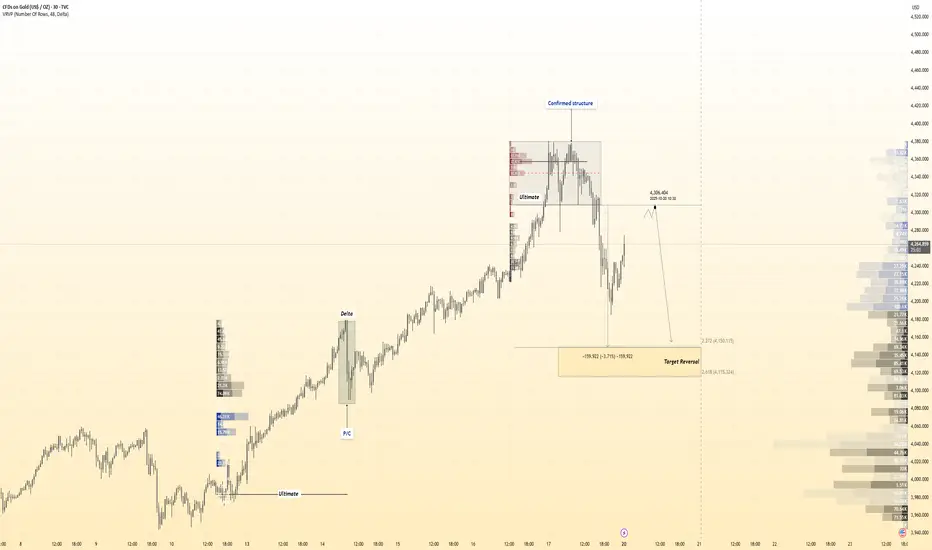
(XAU/USD – Gold Spot, 1-hour timeframe)...(XAU/USD – Gold Spot, 1-hour timeframe), here’s the breakdown:
Current price: Around $4,337
First target (near-term): Around $4,284
Second (main) target: Around $4,205
These target levels are marked on my chart with blue arrows labeled “Target Point.”
📉 Interpretation:
The chart suggests a bearish (downward) move — likely following a correction from the peak labeled “2.”
The Ichimoku cloud and marked arrows indicate a short-term pullback, with a stronger support zone near $4,205–4,210.

( HANZO Gold Protocol ) Bearish Reversal Detected SELL Scenario — Hanzo Reversal Intel (Smart Money Phase III)
🔥Sell Reversal : 4307 Zone
Status: Active Reversal Protocol
Symbol: Gold
Session: London–New York Overlap (Smart Exit Window)
🧩 Technical Breakdown
➤ Volume Surge Confirmed
A clear overload of institutional sell volume detected at exhaustion highs. The tape confirms aggressive unloading by composite operators.
➤ Session Alignment
The Smart Money exit window is open — this is where large players offload liquidity before volatility collapse.
➤ Cluster Shield Active
Price met a dense supply cluster on the volume map, validating an active imbalance zone. This zone acts as a precision trap for late buyers.
➤ Delta Shift Turned Negative
Order flow flipped — buyers absorbed, sellers dominate. Imbalance sustained across multiple timeframes.
➤ POC Retest Completed
Liquidity re-engaged at the Point of Control, confirming absorption and rejection — final validation before reversal.
➤ Structure Fracture Pending
Micro-structure shows early bearish intent — liquidity purge complete, ready for engineered drop.
🧠 Hanzo Logic
This setup isn’t a prediction — it’s an engineered reaction. Every confirmation aligns with controlled liquidity flow, not retail patterns. Hanzo logic reads the market as a machine, not a chart.
🎯 Execution Objective
Bias: Bearish
Goal: Controlled short with minimal drawdown
Tactical Edge: Reversal precision through liquidity engineering
Confidence Level: ★★★★★ (Smart Money Aligned)
⚡️ Hanzo Signature Insight
Most traders see resistance — we see distribution intelligence.
What looks random to others… is designed precision to us.
GOLD (XAU/USD): New Target $4200; Here's Why!It appears that 📈GOLD price has completed a corrective movement that was initiated earlier today.
We see a confirmed bullish breakout above the neckline of a double bottom pattern on an hourly timeframe.
That happened following a test of strong intraday support, indicating significant upward pressure.
My target is set at 4200.

Gold 1979 vs 2025 — When History Whispers and Markets Listen
🌕 1. The Echo of 1979
In 1979, the world watched Gold do the impossible. The metal surged from $226 to over $850 per ounce in less than a year, a 275% explosion that turned fear into fortune.
The triggers were seismic.
🇮🇷 The Iranian Revolution disrupted global oil flows.
🏛️ The U.S. Embassy hostage crisis fueled geopolitical panic.
⚔️ The Soviet invasion of Afghanistan reignited Cold War fears.
💸 And double-digit inflation in the U.S. shredded faith in the dollar.
By early 1980, panic replaced logic. Every newspaper screamed, “Buy Gold before it’s too late!” Then came Paul Volcker’s shock therapy as interest rates jumped above 15% and COMEX doubled margin requirements. Within eight weeks, Gold fell more than 40%, marking the end of one of the most dramatic speculative manias in modern history.
🔁 2. Fast-Forward to 2025: The Parallels Are Uncanny
The world of 2025 looks hauntingly similar.
🕰️ 1979 🔮 2025
Iranian Revolution and Cold War tensions Gaza war, U.S.–China decoupling, and regional instability
Oil shock and inflation Energy disruptions and persistent post-pandemic inflation
Dollar under pressure Record U.S. debt and fiscal erosion
Panic buying of Gold Central bank accumulation and retail FOMO
Fed under Volcker turns hawkish Fed under Powell trapped between cuts and control
By late August 2025, gold sat quietly near $3,415, then erupted into a seven-week vertical rally above $4,300, a mirror image of 1979’s euphoric climb. But just like back then, euphoria was the prelude to exhaustion.
⚠️ 3. The Anatomy of the Current Crash
On October 17, 2025, Gold plunged $250 in one day, a shocking 5–6% drop that broke its parabolic structure and sent fear rippling across markets.
What triggered it?
🏦 A hawkish shift in the Federal Reserve’s language as officials hinted rate cuts might be delayed.
💰 Real yields surged, breaking the inverse correlation that had fueled gold’s climb.
🏛️ Institutional profit-taking hit record levels, confirmed by rising COMEX open interest and volume.
🗞️ Sentiment flipped overnight as headlines shifted from “Gold to $5000” to “Gold crashes $250.”
The move marked the first true break of structure (CHoCH) since the rally began, historically the signal that smart money is quietly exiting.
🔍 4. Lessons from 1980 — The Signs of a Top
Before gold crashed in 1980, five clear warning signs appeared.
⚙️ 1979–1980 Signal 💡 2025 Equivalent 🧭 Status
Fed turns hawkish Powell signals “pause / higher for longer” ⚠️ Emerging
Rising bond yields vs. flat Gold Real yield divergence ✅ Confirmed
Parabolic candles Daily range above $100 ✅ Seen
Media frenzy “Gold to $5000” hype ✅ Seen
Margin hikes and record OI Record COMEX participation ⚠️ Rising
Four out of five signals are already flashing. History teaches that when everyone believes Gold can only rise, it’s often about to fall.
🧭 5. What Smart Traders Should Do Now
🟡 Phase 1 – Immediate Protection (Next 24 Hours)
If you’re long, secure 50–75% of gains and protect above $3,950.
If you’re short, trail stops to $4,200 and look for targets at $3,950 → $3,800 → $3,600.
If you’re flat, stay patient and wait for at least two daily candles of stabilization before acting.
🟠 Phase 2 – Stabilization (Next 3–5 Days)
Watch for:
🕯️ Long lower wicks on daily candles show buyer absorption.
📉 Shrinking COMEX volume indicates exhaustion of sellers.
📊 Flat or falling real yields confirming support.
🔵 Phase 3 – Re-evaluation (Next 1–2 Weeks)
If gold reclaims $4,000+ with strength and Fed tone softens, a controlled re-rally may begin. If Gold stays below $3,800, the correction likely extends toward $3,500, the same 30–40% retracement seen in 1980.
🧘♀️ 6. Beyond the Chart — Discipline Over Drama
When a $250 candle appears, instincts scream, “Do something!” But professionals know the truth: reaction destroys capital, observation preserves it. The coming days are not about prediction but about posture. Stay liquid, track sentiment, watch real yields, and remember that even in 1980, Gold’s crash didn’t end its story — it simply reset the cycle for the next era of accumulation.
✨ History doesn’t repeat, but it rhymes. In 1979, Gold taught us that fear creates bubbles. In 2025, it’s reminding us that even truth needs a pullback before it shines again.
If this article helped you today and brought you more clarity:
Drop a 🚀 and follow us✅ for more trading ideas and trading psychology. Thank you.

#XAUUSD: Small Time-Frame Big Trade! Comment Your Views! Price is at the 'premium buying level' at this point we could expect it to continue the bullish momentum towards 4300$ or $4350. Please use accurate risk management while trading gold.
Good luck

GOLD WEEKLY CHART MID/LONG TERM ROUTE MAPHey everyone,
Please check out our updated Weekly Chart Route Map, featuring updated revised key levels after completion of our last long term weekly chart idea for precise level-to-level tracking.
We’ve refreshed our long-term structure on the weekly chart. Price action recently rejected the 4294 level and is now range-bound between 4284 (resistance) and 4059 (support). This consolidation aligns with a detachment from the EMA5, highlighted on the chart with a circle. Even if a full detachment doesn’t materialize, a partial (halfway) correction remains the more probable scenario.
To determine the next directional move, we’ll need a decisive test and break of either boundary level. On the broader horizon, 3006 stands as the long-range pivotal swing zone, which may come into play if a major correction unfolds.
🔹 Note: The key distinction between a retracement range and a swing range is that swing ranges typically produce larger bounces and wider price reactions compared to standard retracement ranges.
We’ll continue to update this outlook throughout the week as the structure develops. Thank you all for your likes, comments and follows, we really appreciate it!
Mr Gold
GoldViewFX

4,000 Pips Up, 2,000 Down – Gold’s Wild Ride Continues!Last week has been a wild ride for Gold traders, with the price rallying aprox 4,000 pips (around 10%), only to sell off 2,000 pips on Friday in what many expected to be a well-deserved correction.
The big question now is: was that correction enough, or is Gold preparing for another leg down before continuing higher?
In my view, this was just the first leg of the correction, and I expect another wave of selling to come this week.
Currently, Gold is recovering from Friday’s sharp drop, and this rebound could potentially push prices back above 4,300.
If that happens, I’ll be watching closely for signs of weakness to position myself short.
Overall, I believe a new test of the 4,200 area is likely before any sustainable recovery can take place.

Double Top Confirmed! Is Gold About to Fall Deeper?As expected from my previous idea , Gold touched its target of $4,183 ( the double top pattern’s target(Small) ). Before reaching that target, it had some ups and downs over the past few days, mainly due to the ongoing US-China tensions .
Gold is trading near a Support zone($4,193 – $4,156) .
From a classical technical analysis perspective, it’s forming a clear double top pattern on the 1-hour timeframe . There’s also a regular bearish divergence (RD-) visible between the two peaks of the double top.
From an Elliott Wave theory standpoint, it looks like Gold has started its corrective wave. If the Support zone($4,193 – $4,156) and the double top pattern’s neckline break , we can expect further downside .
I expect that after breaking the Support zone($4,193 – $4,156) and the neckline , Gold could drop at least to around $4,083(First Target) .
Second Target: $4,057
Stop Loss(SL): $4,385(Worst)
Note: Keep in mind that given the ongoing US-China tensions, any news could invalidate this analysis. So it’s more important than ever to manage your risk carefully these days.
Please respect each other's ideas and express them politely if you agree or disagree.
Gold Analyze (XAUUSD), 1-hour time frame.
Be sure to follow the updated ideas.
Do not forget to put a Stop loss for your positions (For every position you want to open).
Please follow your strategy; this is just my idea, and I will gladly see your ideas in this post.
Please do not forget the ✅ ' like ' ✅ button 🙏😊 & Share it with your friends; thanks, and Trade safe.

Lingrid | GOLD Weekly Support Hold Long OpportunityOANDA:XAUUSD pulled back sharply from the resistance and printed a higher low right at the confluence of the uptrend and above previous week low 4,050. Structurally, the broader upward channel remains intact while price retested the downward trendline from above, keeping the higher-low sequence alive. If 4,000–4,050 support continues to hold, it favor a rebound toward 4,245 and, if momentum extends, a run at 4,400; a daily close back below 4,043 would defer the bounce. Broader momentum still skews bullish with successive higher lows, suggesting the recent drop is a corrective pullback within the trend rather than a top.
⚠️ Risks:
A decisive break below 4,000 that invalidates the uptrend confluence could extend losses toward 3,950–3,900.
Strong USD and higher real yields on hawkish Fed rhetoric/data may cap upside or accelerate downside.
Diminishing geopolitical risk or risk-on equity strength could sap haven demand for gold.
If this idea resonates with you or you have your own opinion, traders, hit the comments. I’m excited to read your thoughts!

GOLD Analysis: Watching for Reaction Near Buyer ZoneHello traders, I want to share with you my opinion about Gold. The market for Gold has been in a strong bullish trend for quite some time, forming a clear upward channel structure. Each impulse has been followed by a short consolidation phase (range), allowing the market to gather liquidity for the next push higher. However, after reaching the key Resistance Level near 4368, the price entered a Seller Zone where heavy supply emerged, triggering a sharp correction. This move broke the short-term market structure and pushed the price down towards the Buyer Zone — an important support area that previously acted as a base for a strong rally. Currently, Gold is trading near the bottom of a descending correction channel, approaching a crucial decision point. I expect the market to make a small corrective move to retest the Resistance Line of this channel, and if rejection follows, it could open the way for another bearish leg toward my TP around 4020. From a broader perspective, this decline still looks like a healthy correction within a major uptrend, so I’ll be watching closely how the price reacts inside the Buyer Zone — it might offer great opportunities for the next bullish impulse later on. Thank you for reading! Please share this idea with your friends and click Boost 🚀

THE KOG REPORT - UpdateEnd of day update from us here at KOG:
Record day here on Gold with price accelerating downside wiping gains above 4200 which was a key level for bulls to defend. The move however, was long awaited and although we didn't get it from the top, we got the break on the bias level and then consequently completed out targets surpassing the extension of the move and hitting the target we had given for the bears.
Now, very important close here with support below at the 4104 level and resistance above at the red box which is circled. 4120 is the level that needs to cross to begin some form of retracement, otherwise, we continue with the move downside targeting the next red box.
From Camelot this morning:
Price: 4270
RED BOXES:
Break above 4275 for 4283, 4295 and 4303 in extension of the move
Break below 4256 for 4250✅, 4233✅ and 4210✅ in extension of the move
As always, trade safe.
KOG

XAUUSD: Correction Within Uptrend – Demand Zone in FocusHello, traders! The gold market (XAUUSD) continues to demonstrate strong bullish momentum within a clearly defined uptrend structure that has been developing for several weeks. The movement is characterized by a sequence of higher highs and higher lows, supported by a well-respected ascending trend line. Throughout this upward phase, we’ve observed multiple breakouts from short-term consolidation zones and corrections — each confirming the dominance of buyers. These breakouts, marked on the chart, acted as continuation signals that pushed price toward new local highs.
Currently, after reaching the 4,360.00 area, gold entered a corrective phase, forming a short-term retracement. This pullback brought the price back to the previously broken trend line and into the Demand Zone 2 (4,200–4,250) — an area that has repeatedly served as strong support for the market.
My scenario for the development, if sellers manage to push the price below the 4,200.00 level, the structure will temporarily weaken, and we may see a deeper correction toward the next Demand Zone 2 (4,100–3,950). This zone would then act as a potential re-accumulation area before buyers could regain control. At the same time, Demand Zone 1, located higher, continues to confirm the overall bullish context — showing that gold maintains its medium-term uptrend despite the current short-term correction. Manage your risk!

GOLD → Correction after aggressive growthFX:XAUUSD is in a correction phase after a month and a half of aggressive growth. The price is forming a trading range and continues to storm support...
The record growth was overheated, and traders are closing long positions. A gradual change in the fundamental background and market sentiment is also provoking an outflow of funds. However, US-China negotiations, the ongoing US shutdown, and the tense geopolitical situation, including the cancellation of Trump's meeting with Putin, create additional risks in the economy, which may support the metal.
The correction in gold looks like a healthy pause. The $4,000 level remains key support. A recovery above $4100 indicates continued buyer interest, but further dynamics depend on news about trade negotiations.
Resistance levels: 4082, 4107, 4163
Support levels: 4059, 4000
A breakdown of the trading range support could trigger further sell-offs. Focus on 4000K, aggressive reaction possible. At the moment, the market is falling as aggressively as it rose. We need to wait for the price to slow down in order to make reasonable technical decisions.
Best regards, R. Linda!
