600 PIPS ALREADY Price moved 600 pips already from our entry (4081-86) without any major retracement .
Trade ideas

Today's gold trading strategyThe contradiction between supply and demand has set the price floor.
The gold market is currently facing a dual situation of "tight supply and strong demand". On the supply side, the global underground reserves of gold are only 20%, and the output of mined gold in 2025 can only maintain a slow growth of 3,000 tons. Moreover, new mines need 5-7 years to come into production, and there is simply no possibility of a significant increase in supply in the short term. The marginal production cost has risen to $1,500 per ounce, providing a strong support for the gold price. On the demand side, not only are global central banks buying gold in a frenzy, but the gold purchase volume is expected to exceed 10,000 tons in 2025. The private investment demand in Asian markets such as China and India is also surging. In 2024, the consumption of gold bars and coins in China increased by 46.02%. This supply-demand gap is difficult to fill in the short term and will inevitably push the gold price to rise.
Today's gold trading strategy
xauusd @ buy4050-4060
TP:4080-4100-4150
SL:4030

xauusd possible moveConsidering what l have mapped down, this is likely gold's next path
Analyse, execute, monitor
Disclaimer : Risk as per self responsible

There are shorting opportunities in gold prices today.There are shorting opportunities in gold prices today.
International gold prices are currently fluctuating around $4,012 per ounce, mainly influenced by both bullish and bearish factors.
On one hand, a stronger dollar and the Federal Reserve's hawkish stance are putting pressure on gold prices; on the other hand, long-term factors such as geopolitical risks and central bank gold purchases are providing support.
---------------------------------------- Key technical levels: Resistance levels: $4030-$4050, $4090-$4110.
A break above these resistance levels could unlock further upside potential.
Support levels: $3950-$3900, $3850-$3820.
A break below these support levels could trigger a larger pullback.
💡 Specific trading strategy:
Currently, gold prices are below the key resistance zone ($4030-$4050), and the short-term trend leans towards consolidation.
If gold prices fail to break through $4,050, consider establishing a small short position with a stop-loss order above $4,070 and a target price around $3,960.

XAU / USD 1 Hour ChartHello traders. Taking a look at the hourly chart, gold has broken out a bit for a push up. I am waiting to see if we can drop back towards the $4k area, to be sure it holds as support. Many times gold doesn't retest, it just moves, but for now I am waiting to see if we can come down to my area marked on the chart. This is just speculation and a trade idea. Let's see how things play out over the next hour or so. Big G gets a shout out. I am just looking for a potential scalp trade, but it is Monday, so I am in no hurry to force or rush a trade. Be well and trade the trend.

What's next for the yellow metal?We've had an incredible run from September until late October, and even when the pullback started it was a solid move. And, so what's up now? Well, as you see in the chart for the converse ICT or SMC traders, the stacked Weekly BISI (Buyside Imbalance Sellside Ineffiency) held solid support to keep price from pushing any lower. Based on the current Dealing Range, price closed within the Discount range. I'd like to see price make a push higher and possibly testing into 4150, and maybe it'll start to create a base there for another leg higher. I won't be so ambitious to expect another ATH just yet, it'll take some time for price build some soild ground first. I'm expecting another range bound trades again until 4200 can be broken to confirm buyside momentum still intact.
Good luck and safe trade.

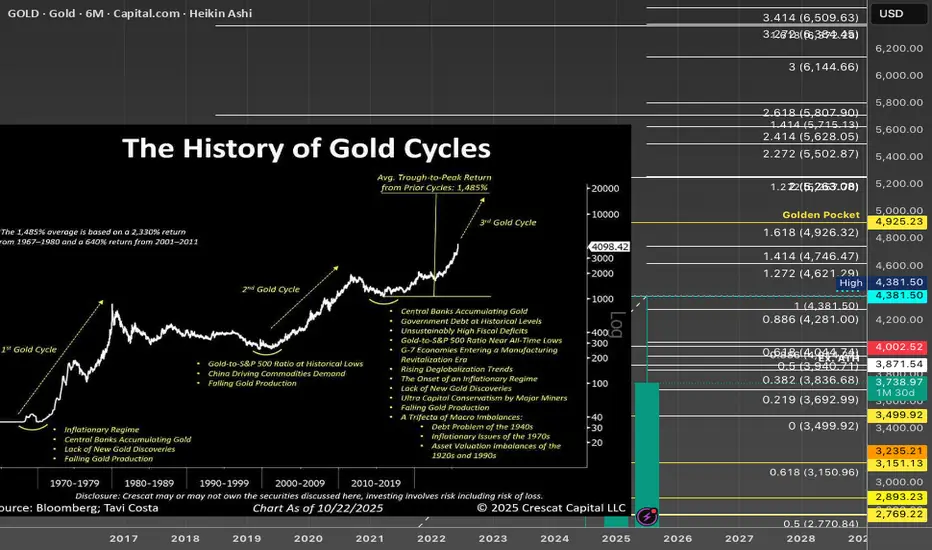
History of Gold Cycles Chart - Inspiration After doing the weekly rounds and reads I came across a post that had this great chart by Crescat Capital. The simple breakdown provides a clean overview from then until now, which for me makes who the Gold market my easier to digest and cut the noise.

XAUUSD 🎯 My Summary & View For Yellow metal
Bias: Bullish, provided support holds.
Strategy Suggestion:
Consider long entries on retests of support zones or after a confirmed breakout above resistance.
Place stop-losses just below the confirmed support to protect against sudden turnarounds.
Set profit targets at the next logical resistance / structure zone.
Watch-outs:
If price breaks below key support and closes there, the bullish thesis weakens.
Overbought conditions / exhaustion of momentum could lead to consolidation or a shallow correction even while trend remains up.
Keep an eye on macro events (Fed decisions, USD strength, geopolitical flare-ups) since gold is sensitive to those
⚠️ Risk Disclaimer
Trading financial instruments such as gold (XAUUSD), forex, cryptocurrencies, and other markets involves a high level of risk and may not be suitable for all investors. The information and setups provided are for educational and informational purposes only and do not constitute financial advice or investment recommendations.
Past performance is not indicative of future results. Market conditions can change rapidly, and there is always the potential for loss of capital. You should carefully consider your financial situation, trading experience, and risk tolerance before making any trading decisions.
Always use proper risk management, including setting stop-loss levels and managing position size. The author of this content is not responsible for any losses incurred from following analyses, trade ideas, or setups shared here.
By engaging in trading activities, you acknowledge and accept all risks associated with financial markets.

Gold facing pressure ahead of US - China meetingChina's purchase of its first US soybean cargo this year, ahead of a meeting with the US, signals expectations for a constructive dialogue and a positive outcome on the sidelines of the APEC summit.
Optimism over a potential trade breakthrough may continue to pressure gold prices.
However, the ongoing data blackout leaves the Fed cautious, heightening volatility in the near term.
XAUUSD failed to breach the EMA, but the higher swing low signaled diminishing bearish momentum. If XAUUSD holds above 3900, the price may retest the resistance at 4020.
Conversely, if XAUUSD closes above 4020, the price may retest the next resistance at 4150 and reverse the trend.
By Van Ha Trinh - Financial Market Strategist at Exness.

GOLD: Strong Bearish Sentiment! Short!
My dear friends,
Today we will analyse GOLD together☺️
The price is near a wide key level
and the pair is approaching a significant decision level of 4,000.57 Therefore, a strong bearish reaction here could determine the next move down.We will watch for a confirmation candle, and then target the next key level of 3,976.32.Recommend Stop-loss is beyond the current level.
❤️Sending you lots of Love and Hugs❤️

Oct 29, 2025 - XAUUSD GOLD Analysis and Potential Opportunity📊 Analysis:
Below 3971, the plan remains to sell rallies into resistance — bearish momentum is dominant.
If price breaks below 3908, it will confirm a stronger bearish continuation.
If price reclaims and holds above 3971, it may suggest that selling pressure is fading — in that case, I’ll cautiously look for short-term buy setups on pullbacks.
🔍 Key Levels to Watch:
• 4043–4050 – Resistance zone
• 4024 – Resistance
• 4010 – Key resistance
• 4000 – Psychological level
• 3984 – Resistance
• 3971 – Bull–bear pivot
• 3950–3953 – Support zone
• 3945 – Support
• 3934 – Support
• 3927 – Support
📈 Intraday Strategy:
SELL: If price breaks below 3971 → target 3965, with further downside toward 3960, 3955, 3950
BUY: If price holds above 3971 → target 3975, with further upside toward 3982, 3988, 3995

Gold Trading Strategy | October 28-29
✅ 4-Hour Chart Analysis
Gold remains within a clear downward channel. Since falling from the 4381 level, the price continues to trade below major moving averages (MA5, MA10, MA20), meaning the bearish trend structure is still intact.
Moving Averages:
MA5 and MA10 have formed a bearish crossover and continue to diverge downward, indicating that bearish momentum remains dominant.
MA20 sits above 4050, acting as a strong mid-term resistance.
If price fails to break above MA10 (around 3990), weak downward consolidation is likely to continue.
Bollinger Bands:
The lower band is expanding downward, and gold has remained near the band’s lower edge, signaling continuation of bearish pressure.
The middle band near 4050 remains a key resistance — failure to reclaim it will keep price under downside pressure.
✅ 1-Hour Chart Analysis
After reaching the 3886 low, gold has seen a technical rebound, but price is currently hovering only between MA5 and MA10, showing that upward momentum is limited.
Price is now testing the Bollinger Bands middle line (3960–3970) — a key short-term resistance zone.
If gold breaks and holds above this level, the rebound may extend toward MA20 (3985–3990).
If it fails to break above and pulls back, the rebound concludes and price may retest 3900 or even make a new low.
🔴 Resistance Levels: 3960–3970 / 3985–3990 / 4050
🟢 Support Levels: 3930–3925 / 3885–3890 / 3800
✅ Trading Strategy Reference:
🔰 If gold rebounds to 3985–3990 and shows rejection, consider scaling into short positions, targeting 3930-3925.
🔰 If gold drops to 3880–3890 and stabilizes, consider light-lot long positions, targeting 3930-3950.
✅ Summary
There is short-term rebound demand, but the upside remains limited.
As long as price fails to break above 3990-4000, the bearish structure remains intact.
If gold drops back below 3930, the downtrend is likely to resume with momentum.

XAUUSD 1H – EW Long SetupHi fellow traders,
On the 1H XAUUSD chart, I am applying Elliott Wave principles to outline a potential long setup. Price seems to have completed wave 4 and is reacting from the golden box area, suggesting that wave 5 may now start unfolding to the upside.
The invalidation level at 4004.72 represents my expected end of the correction, although the setup remains valid even if price moves slightly lower. My Stop Loss is set at 3940.00, which would confirm structural failure if reached. The Take Profit is positioned at 4437.36, targeting the projected completion of wave 5.
Good luck and trade safe!

ElDoradoFx PREMIUM – GOLD ANALYSIS (28/10/2025, LONDON SESSIONGold extended its bearish continuation during Asia, breaking below 3,940, confirming dominance of sellers. London opens with price sitting near 3,935–3,940, still within the bearish structure that began at 4,106.
Momentum is strongly negative, with EMAs (50/100/200) aligned downward and RSI below 40 across all intraday frames. The market remains inside a descending channel — each recovery is being sold aggressively.
⸻
2️⃣ Technical Breakdown
🔹 Daily (D1)
• Fourth consecutive bearish candle confirms strong downside momentum.
• RSI (46) still neutral but leaning bearish; MACD histogram fully red.
• Price approaching potential higher-timeframe support near 3,900–3,880.
Bias: Bearish correction still in play until 3,880 or D1 reversal candle appears.
🔸 H1
• Structure: clean lower highs (4,106 → 4,048 → 3,997) and lower lows (3,971 → 3,935).
• RSI (27) deeply oversold, signaling possible micro bounce but no reversal yet.
• 100/200 EMA above at 3,990–4,040 acting as strong resistance.
Bias: Bearish below 4,000, corrective pullback likely capped at 3,995–4,010.
🔹 M15
• Extended downtrend channel remains active.
• Every minor pullback rejected under 3,950–3,960.
• MACD shows no bullish divergence yet; sellers still in control.
Bias: Sell pullbacks near resistance levels.
🔹 M5
• Micro CHoCH confirmed lower highs.
• RSI near 30 with weak attempt to rebound.
• Short-term liquidity zone forming 3,930–3,940, potential area for retest before continuation.
Bias: Bearish to neutral; short rallies only if confirmed rejection on M5–M15.
⸻
3️⃣ Fibonacci Analysis (Golden Zone)
Last H1 swing: High 4,106 → Low 3,935
• 🔸 38.2% → 3,990
• 🔸 50% → 4,009
• 🔸 61.8% → 4,028
✅ Golden Zone = 3,990 – 4,028
This zone aligns with the H1 supply area and EMA confluence, making it the optimal retracement level to rejoin the bearish trend.
⸻
4️⃣ High-Probability Trade Scenarios
📉 SELL SCENARIO (High Probability)
• Entry: 3,990 – 4,028 (Golden Zone)
• Stop-Loss: 4,035 – 4,045
• Targets: 3,955 → 3,935 → 3,910 → 3,885
• Confluence: EMA cluster, Fib 61.8%, trendline resistance
• Bias: Strong short continuation if rejection occurs inside Golden Zone
⸻
⚡ BREAKDOWN SELL
• Trigger: Clean H1 candle close below 3,930
• Entry: 3,928 – 3,935 on retest
• Stop-Loss: Above 3,945
• Targets: 3,912 → 3,900 → 3,885
• Bias: Follows continuation of bearish momentum below weak low.
⸻
🟢 COUNTERTREND BUY (Low Probability)
• Trigger: Bullish BOS + strong engulfing candle above 3,960
• Entry: 3,960 – 3,965
• Stop-Loss: 3,940
• Targets: 3,985 → 3,995 → 4,009
• Bias: Only if London forms a liquidity sweep under 3,930 with strong reclaim.
⸻
5️⃣ Fundamental Watch
• No major Asia data; London expected to move with USD Index (DXY) flows.
• DXY above 106 favors continued gold weakness.
• Traders monitoring US GDP & PCE later this week, meaning liquidity could tighten today.
• Expect volatility spikes near London–NY overlap as large players position early.
⸻
6️⃣ Key Technical Levels
Type Price Levels
Resistance 3,960 / 3,975 / 3,990 / 4,009 / 4,028
Support 3,935 / 3,924 / 3,910 / 3,885 / 3,872
Golden Zone 3,990 – 4,028
Breakdown Trigger < 3,930
Bullish Reclaim Trigger > 3,965
⸻
7️⃣ Analyst Summary
The bearish structure remains dominant across all timeframes. Momentum favors continuation toward 3,910–3,885, with the best entry region at 3,990–4,028 Golden Zone.
If London opens with liquidity sweeps below 3,930, wait for a quick retracement to sell at premium pricing.
Only strong reclaim above 3,965 could trigger a short-term intraday recovery to 3,990–4,009 before sellers step in again.
⸻
8️⃣ Final Bias Summary
📉 Primary Bias: Bearish – Sell rallies into 3,990–4,028
📈 Secondary Bias: Bullish only above 3,965 (confirmed reclaim)
🎯 Targets: 3,955 → 3,935 → 3,910 → 3,885
✨ Golden Zone: 3,990 – 4,028
🛑 Invalidation: H1 close above 4,045
⸻
— ElDoradoFx PREMIUM 2.0 Team 🚀
⸻

Gold Price Analysis - Gold Breakout Levels 4200 vs 4040Gold is trading inside a tightening rising channel after forming a strong higher timeframe rejection from the ATH which pushed price into a corrective phase. Buyers have repeatedly defended the strong support zone near 4000-3980 creating a false breakout low followed by a controlled recovery showing that demand remains active.
However, each rally into the weak-high resistance at 4160-4200 has shown fading momentum meaning sellers are still protecting this zone aggressively. Until price breaks out with a clean close and retest above this resistance gold will remain in a neutral to slightly bullish consolidation phase driven by stop hunts and choppy movements inside the channel.
A successful breakout above 4200 can trigger a bullish continuation toward 4240 then 4320-4360 and possibly back to the ATH zone while a breakdown below 4040 rising support would shift the structure bearish again exposing the 3980 demand and potentially a deeper drop to 3900 if buyers fail there.
In simple terms buyers still control support, sellers still control resistance and the next big move will come once one of these critical levels breaks with strength.
✅ Option 1-Strong Bullish Bias
Gold is still respecting the rising channel and defending the strong support zone around 4000-3980. As long as price stays above the rising trendline bullish structure remains valid. A clean breakout above 4160-4200 will confirm continuation toward 4240 → 4320 → ATH retest. Buyers are still in the game, waiting for the breakout.
✅ Option 2-Neutral to Bullish
Gold is consolidating inside a rising channel after rejecting the ATH. Support remains strong around 4000-3980 while sellers continue to defend 4160-4200. A breakout on either side will define the next major move. Above 4200 bullish continuation toward 4240 and 4320+. Below 4040 deeper pullback toward 3980 and possibly 3900.
✅ Option 3-Neutral to Bearish
Gold is struggling to break above 4160-4200 showing seller strength at the top of the range. If price fails again and breaks below the rising channel near 4040 downside can accelerate toward 3980 and 3900 for liquidity. Bulls must hold support to avoid a deeper correction.
Gold remains trapped between 4040 support and 4200 resistance inside a rising wedge. Buyers holding strong at the bottom but sellers still defending the top. Break above 4200 bullish continuation toward 4320. Break below 4040 bearish move to 3980-3900. Still a range waiting for breakout confirmation.
Note
Please risk management in trading is a Key so use your money accordingly. If you like the idea then please like and boost. Thank you and Good Luck!

GOLD THE YELLOW METAL SELLOFF CONTINUES ON FOMC FEDERAL FUND RATE OUTLOOK.
All eyes are now on the Fed’s monetary policy verdict , as the US government shows no signs of reopening.
Market are almost fully pricing in two interest rate cuts this year, with a 25 basis points (bps) cut .
the key technicality surrounding gold trading is as follows
the 4hr EMA10,EMA20,EMA50,EMA100 are all above price supporting bearish take profit only the 4HR EMA200 IS below price acting as dynamic support on 4hr at 3945-3940 + ema 200 support for buy.
THIS WILL BE LAYER BY LAYER.
THE DOLLAR INDEX BROKEN OF 98.757 SUPPORT FLOOR INDICATING A POSSIBL EFFECT ON RATE CUT ,HOW EVER THIS PRICE ACTION PUT GOLD LONG POSITION ON CAUTIOUS MODE.
THE UNITED STATE 10 YEAR TREASURY BOND YIELD CLOSE IN MASSIVE SELLOFF TO CLOSE BELOW 4.0% MARK AT EXACTLY 3.987%
GOLD CORECTION IS PLAYING ON CAUTION AND the next demand floor will around 3767.90-3764-3760
finally the last layer by layer will be 3700-3706 my pay day zone ....at this level expect to see the hand of GOD.
NOTE;gold trading is very volatile but comes with liquidity ,pls manage your risk and i wish you good luck.
#GOLD #XAUUSD #DXY #US10Y

Gold Bullish Reversal Expected from D-FVG ZoneKey Observations and SMC Components:
D-FVG (Daily Fair Value Gap):
The most important element is the large shaded gray box at the bottom, labeled D-FVG. This indicates an Inefficiency or Fair Value Gap identified on the Daily timeframe, making it a powerful area of demand where institutional buying pressure is expected.
CRT-L and CRT-H:
CRT-L (Current Range Low/Bottom) is placed near the bottom of the D-FVG zone, marking a key support level.
CRT-H (Current Range Top/High) marks the high of the recent drop.
Current Price Action:
The price is currently at $3,974.61 and has been trending down. It is approaching the key support/demand zone (D-FVG).
Projected Move:
The curved line and green arrow indicate the anticipated price action: a continuation of the drop into the D-FVG zone, followed by a strong rejection and a reversal upwards (a rally).
The rally's TARGET is marked by a dotted line, sitting below the CRT-H level (around $4,020 - $4,030).
Trading Bias and Expectation
The overall bias is short-term bullish following the retracement. The analyst expects price to:
Retrace/Consolidate: Drop into the high-probability D-FVG demand zone (around $3,920 to $3,940).
Reverse and Rally: Find strong support in this zone, then reverse and move upwards to hit the intermediate TARGET.

Gold to $4500?You’re looking at a 4-hour chart of Gold (XAUUSD) with a combination of Fibonacci extensions, RSI, and MACD indicators.
1. Price action & Fibonacci levels
• Current price: around $4,008.
• The chart shows retracement and extension levels, with key Fibonacci zones marked (0.618, 1.618, 2.618, etc.).
• The price recently retraced to the 1.618 level (~$4,010) — a common Fibonacci support zone — and bounced slightly.
• There’s also a 2.618 extension at $3,865, suggesting that if $4,000 fails as support, the next downside target could be around $3,865.
2. MACD (top indicator)
• MACD Line (blue) is well below the Signal Line (orange) → strong bearish momentum.
• Histogram is negative (–7.643), confirming the bearish trend.
• However, the histogram bars are starting to shrink, which can often signal bearish exhaustion or a potential bullish reversal coming.
3. RSI (bottom indicator)
• RSI = 35.93, with the RSI-based MA at 39.91.
• This means Gold is nearing oversold territory (below 30) — it’s not extreme yet, but buyers might soon step in.
• If RSI turns up and crosses the MA, it could confirm the beginning of a short-term reversal.
4. Projected path (orange line on chart)
• The drawn orange curve shows a possible bounce scenario:
• Gold could dip slightly below $4,000 or test $3,865 (2.618 level),
• then begin a gradual recovery toward $4,380–$4,400.
• That’s in line with a Fibonacci retracement to 1.0–1.618 area — a common recovery zone after a sharp drop.
5. Summary
Indicator Current Bias Signal
Price Action Slightly Bearish Approaching support zone
Fibonacci Key support at $4,000, next at $3,865 Possible bounce
MACD Bearish but flattening Early reversal potential
RSI Near oversold Could trigger rebound soon
Quick Take:
Gold might dip slightly lower (possibly to $3,865), but technicals suggest a bullish reversal may follow in early November, targeting the $4,380–$4,400 area.

Gold kissed the wall.Gold touched both the top band of the rising wedge and the 0.618 Fib level on the 3M timeframe… and was rejected.
Is this just a correction, or the beginning of a historic reversal?
Time will tell, but the chart is already whispering.
TVC:GOLD | TVC:XAU 🔻

XAUUSD: Market analysis and strategy for October 27.Gold Technical Analysis
Daily Resistance: 4210, Support: 4000
4-Hour Resistance: 4140, Support: 4005
1-Hour Resistance: 4100, Support: 4015
After hitting a record high last week, gold prices have retreated, dropping over $300. Friday's close confirms the onset of a weekly downturn.
In terms of indicators, the RSI has begun to fall back below the 80 level, and on the daily chart, it has even broken through the 4050 bull-bear dividing line. The MACD fast and slow lines have formed a death cross, and the green momentum bar is declining with increasing volume. In short, it's clear that the broader cycle is quietly turning, or more accurately, the upward trend is pausing.
From the hourly chart, today's Asian session opened sharply lower. This is partly a reaction to weekend news, and partly due to the inherent weakness of the market, which requires adjustment. The subsequent rebound failed to even break the upward closing gap, and then began a rapid decline. This is the result of bearish dominance.
The 1-hour chart is currently in a bearish flag consolidation pattern. The 4000 level is likely to be retested or even broken, so today's strategy is to sell high and buy low.
SELL: near 4100
SELL: near 4140
BUY: near 4005
More Analysis →

GOLD aka XAUUSD is heading to the downside!!Last week XAUUSD (Gold) had a very bearish week! It ended its bullish streak of years and declined to the downside. It only recently broke a very strong support zone (the green trendline) and struggled to break above the resistance zone (red trendline). It should drop all the way down further all the way to the 3833 level.

Gold: Watch for a corrective pullback toward 4,230Price was in a strong bullish trend. However, momentum started to fade as price created a double top pattern, a classic signal of buyer exhaustion.
After the second top, sellers stepped in aggressively, breaking below the neckline, confirming a shift in market structure from bullish to bearish. This breakdown accelerated as trapped buyers began exiting their positions, fueling a sharp decline.
From here, a short-term bullish pullback may develop, buyers could push price back toward the 4,230, aligning with the 0.5–0.618 Fibonacci retracement zone.
