analysis for Gold (XAU/USD) based on your 15-minute chart:he chart shows a descending channel (marked by “TRADE LINE”) that recently broke to the upside, suggesting a possible short-term bullish reversal.
A strong resistance zone is visible near 4140–4160, where price has previously rejected multiple times.
The target zone below is marked around 4042.57, which aligns with prior swing support.
Key Levels
Resistance: 4140 – 4160
Support: 4080 – 4060
Target (Downside): 4042
Upside Break Zone: Above 4160 could lead toward 4180+
Analysis Summary
The price broke out of a short-term bearish channel, indicating potential for a bullish correction toward resistance (4140–4160).
However, this zone is critical resistance; rejection here may trigger a pullback back toward 4080 or even the target at 4042.
Momentum indicators suggest the move is reactive (short-term retracement), not yet a trend reversal.
⚙️ Trading Outlook
Bearish Bias: Below 4140 → potential retest toward 4060–4040.
Bullish Confirmation: Only above 4160 → continuation to 4180–4200. MIL:RACE MIL:LDO MIL:STLAM MIL:ENI MIL:STMMI MIL:STMMI MIL:ENEL MIL:MONC MIL:PRY MIL:TIT MIL:FCT MIL:AZM MIL:WBD
Trade ideas

Gold Testing 4,210 Support as Bulls Eye Another Leg HigherHey Traders, in today’s session we’re keeping a close watch on XAUUSD for a potential buying opportunity around the 4,210 zone. Gold continues to trade within a broader uptrend, and the current pullback appears to be a healthy correction toward a key support and resistance confluence at 4,210.
Market structure:
Momentum remains bullish, with price forming higher highs and higher lows. The ongoing correction could provide a trend-continuation entry if buyers step in near support.
Key level:
4,210 — a decisive zone where previous reactions have sparked renewed buying interest.
Outlook:
A sustained bid from this area could pave the way for another push toward 4,300 and beyond, keeping Gold aligned with its dominant bullish trajectory.
Trade safe,
Joe.

SELL ASSET GOLD {XAUUSD}🔴 SELL SIGNAL ACTIVE — XAUUSD (GOLD)
Bears are stepping in as price shows signs of exhaustion at key resistance levels.
This setup marks a high-probability short-term downside opportunity, ideal for traders who look to capitalize on momentum reversals and clean structural shifts.
✳️ Market Snapshot
Structure Shift: Price forms a lower high, signaling potential weakness ahead.
Momentum Turn: Sellers are reclaiming control after a failed bullish push.
Entry Zone: A defined area where downside acceleration is likely to begin.
Risk Control: Stop-loss levels remain tight (around 40–50 pips) to safeguard capital.
💰 Trading Outlook
Consider short positions near the highlighted resistance or confirmation candle.
Targets: Short-term take-profits at recent support or liquidity sweep zones.
Tip: Keep position sizing aligned with your risk plan — focus on accuracy, not aggression.
⚠️ Trader’s Note
This signal is intended for short-term momentum trading. Always apply your own analysis, follow strict risk management, and treat this as a trade idea, not financial advice.

Analysis and possible path of goldHi traders
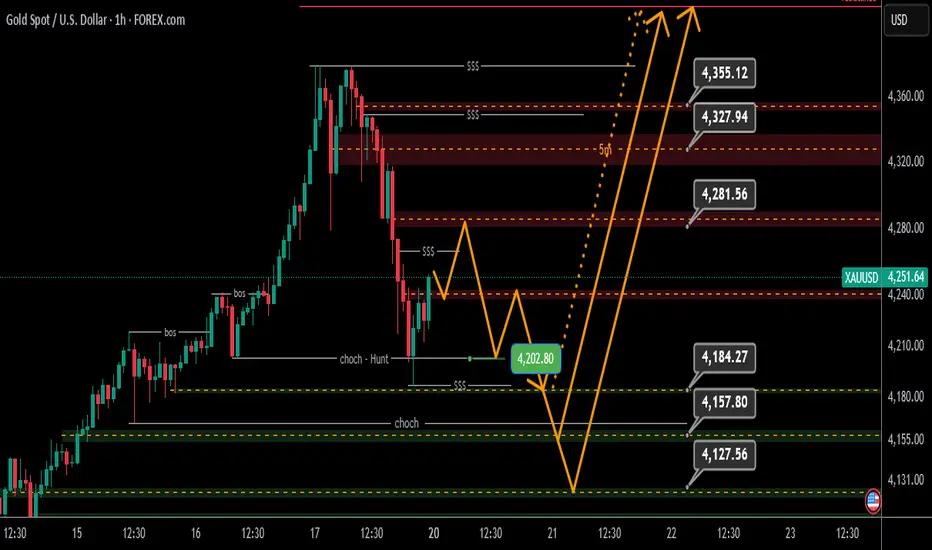
One-hour structure of gold:
The structure of the one-hour time frame and above is still the bullish structure and the movement that can be imagined this week. The liquidity points and three resistance / support are marked on the chart. They are the market reaction points that can be triggered to enter at these levels in the lower time.
The area of 4202 is the choch-hunt line that can act as a support pullback and even the main positive reaction can be formed from this area, but ideally the current bottom is collected once again and rises from one of the three supports below the bottom.
Have a good week

Latest Gold Price Analysis and Trading Strategy:
I. Fundamental Overview
Price Fluctuations
Gold experienced a significant correction, with spot gold falling 6.3% in a single day, marking its largest single-day drop since April 2013.
having rebounded after touching a low of $4005/oz during the Asian trading session.
Main Bearish Factors
Easing Geopolitical Tensions: European efforts to promote a ceasefire and peace talks, along with a thaw in China-US trade frictions, have reduced safe-haven demand.
Stronger US Dollar: The US Dollar Index (DXY) rose to near 98.97, putting pressure on dollar-denominated gold.
Technical Selling Pressure: Profit-taking intensified after the significant year-to-date gains, triggering a correction from technically overbought conditions.
Adjusted Institutional Views: Citibank turned bearish in the short term, setting a 1-3 month target price of $4000/oz.
Long-Term Supporting Factors
The core bullish drivers remain intact: expectations of Fed rate cuts, continued gold purchases by global central banks (e.g., China increased holdings for the 11th consecutive month), de-dollarization trends, and global debt concerns. The medium to long-term fundamental backdrop remains solid.
II. Today's Trading Strategy
Core Approach
Market volatility is high, and a top pattern is emerging. Adopt a cautious stance, favoring or range-trading strategies. Avoid chasing rallies or selling into sharp declines.
Key Levels
Resistance: $4150-$4160/oz (Conservative Range), $4192/oz (Strong Resistance).
Support: $4080/oz (Initial Support), $4000-$4010/oz (Key Psychological & Technical Support, coinciding with the 100-day Moving Average).
Specific Trading Recommendations
Short Opportunities:
If the price rallies to the $4150-$4160 range, consider initiating light short positions.
Set stop-loss above $4170/oz.
Take profit targets: $4080/oz initially, with a further extension towards $4000/oz if broken.
Long Opportunities:
If the price pulls back and stabilizes in the $4000-$4010 area, consider light long positions.
Set stop-loss below $3980/oz.
Take profit targets: $4080/oz initially, with a further extension towards $4150/oz if broken.
Breakout Scenarios:
If the price breaks decisively above $4190/oz, pause short strategies and monitor for directional confirmation.
Risk Warnings
Key Focus Events: Speeches from Fed officials, US economic data, and the ECB President's speech could trigger significant volatility.
Position Management: Allocate no more than 20% of total capital to a single trade. Implement stop-loss orders strictly to manage risks associated with high volatility.
Summary: Short-term technicals lean bearish, but potential for rebounds exists near key support levels. Adopt flexible range-trading tactics, enforce strict risk control, and await new fundamental catalysts.

Gold: First signs of a correction after a strong rallyHi traders and investors!
This analysis is based on the Initiative Analysis (IA) concept.
For the past nine weeks, gold has been flying upward — and now we’re starting to see signs of a pause in growth or even the beginning of a correction.
Friday’s candle showed very high volume, and this volume came from the seller side.
A similar, though smaller, volume was seen on August 8.
This could indicate that we may enter a correction or sideways phase.
The range of the most recent buyer initiative on the daily timeframe is quite wide.
Yesterday, the price came close to the 50% level of that initiative, but didn’t quite reach it.
The key levels to watch for potential buys are:
50% level of the buyer initiative — 4162,
upper boundary of the previous buyer initiative — 4059.
By the way, on the weekly timeframe, last week’s trading volume was the highest since March 2022.
All these signs point to a possible pause in growth.
Wishing you profitable trades!

Weekly Technical Analysis of the XAU/USD (Gold vs. Dollar)Weekly Technical Analysis of the XAU/USD (Gold vs. Dollar)
Weekly Scenarios
Bullish scenario: Gold holds the ~$4,000 zone and breaks through ~$4,200 → next target in the range of ~$4,500–4,700.
Consolidation: Price moves between ~$4,000 and ~$4,200, forming a base for the next impulse.
Bearish scenario: Break below ~$4,000 with volume and a change in structure → possible decline to ~$3,900 or lower.
✅ Conclusion
For the coming week, the technical picture for XAU/USD remains moderately bullish, but with a high degree of risk:
Holding support at ~$4,000 and breaking resistance at ~$4,200 could trigger a significant rally.
A break below ~$4,000 is a signal for caution and a potential correction. It's important for traders to react to volumes, breakout confirmations, and price behavior at designated levels.

Gold: Double Bottom or Five-Wave Decline?After rising to the MA60 area on the 4-hour chart, gold faced significant selling pressure, and the price has now pulled back to around 4050, which lies near the short-term support zone. Over time, the MA20 support on the daily chart has moved up to around 4055, while the MA30 currently sits near 3942.
On the 1-hour chart, the downtrend appears not yet complete, so pay attention to the next two closing candles. For now, key support levels to watch are 4014–4000, followed by 3978–3937.
If the price stabilizes around 4000, a double-bottom pattern could potentially form. However, if it falls further toward the MA30, a head-and-shoulders pattern may come into play. In case the rebound fails to break above resistance, be cautious of a five-wave decline, as that could trigger another sharp correction, with a high likelihood of filling the gap near 3887.
In terms of trading strategy, the focus should still be on finding buying opportunities.
For medium-term setups, you can hold positions patiently; for short-term intraday trades, pay close attention to the key supports mentioned above, and use the MA20/60 on the 30-minute chart as reference points for resistance.

GoldGold 🥇 | Comprehensive Technical Analysis - Setting a Significant Rejection Zone
Current Price: Around $4,353 | Timeframe: Daily - Weekly
Date: October 21, 2025
══════
📊 Overview On the Market:
Gold has completed an exceptional bullish cycle, reaching new all-time highs above 4,400, which I believe represents the local high for the current phase.
However, several technical factors now point to an imminent correction before any potential continuation.
══════
🔍 Key Technical Notes:
▪️ Price Zone:
The stock is currently trading in a bullish zone—an area where institutional investors historically tend to take profits and open short positions.
▪️ Market Sentiment:
Fear and Greed Index: 78/100 (Extreme Greed)
These extreme readings in bullish zones precede corrections in 85% of historical cases.
▪️ Structural Analysis:
- Overall Structure: Bullish (higher timeframes)
- Internal Structure: Showing signs of weakness and bearish divergence
- A potential Change in Personality (CHoCH) is forming on medium timeframes
▪️ Supply and Demand Zones:
Multiple untested resistance zones below, as well as unfilled fair value gaps that act as price magnets.
▪️ Multiple Timeframe Analysis:
Price is analyzed across multiple timeframes (4-hour, 1-day, 1-week, etc.) using advanced order flow techniques and proprietary market structure mapping tools—all of which point to a potential upcoming correction.
══════
🎯 Expected Scenario (High Probability):
Stage 1 - Initial Correction:
📍 Target 1: $3,777-$3,816
(Balance Zone)
📍 Target 2: $3,688-$3,749
(Discount Zone - Optimal Entry)
Stage 2 - Deeper Correction (Moderate Probability):
📍 Target 3: $3,465-$3,580
(Strong Institutional Demand - Buy Orders)
In addition to unfilled fair value gaps that act as price magnets.
Note: Additional Confirmation Required
After Reaching the Discount Zones:
The possibility of a continued uptrend exists, but is not currently highly likely. The situation will be reassessed upon reaching the demand zones.
══════
⚡ Why this analysis?
This analysis is based on:
✓ Advanced order flow analysis techniques
✓ Professional tools for mapping market structure
✓ Premium/Discount Zone Theory
✓ Detecting institutional order blocks
✓ Market sentiment analysis
✓ Liquidity level mapping
These are not traditional retail trading tools; they are institutional analysis techniques used by professional traders.
═════
📚 Previous Record:
Some may remember my previous analysis of gold in August 2023:
📌 Analysis for August 13 2023:
- Expectations: Rise from 1780
- Targets: 2500 → 2800 → Over 3800
- Result: ✅ 100% Success Rate
- Actual Movement: Reaching over 4400 (147% Profit)
- Update (April 2024): "Trade Closed at Target"
This analysis is based on the same institutional framework applied to this current situation. The methodology is effective because it tracks actual cash flow—not trader sentiment.
═════ ═════
⚠️ Risk Management (Mandatory):
Regardless of your confidence level, risk management is non-negotiable:
✓ Don't risk more than 1-2% of your capital on each trade.
✓ Always set a stop-loss before entering.
✓ Avoid excessive leverage.
✓ Maximize your profits. Steps
✓ Research yourself (DYOR)
══════════════════════════════════════ ═════
⚖️ Disclaimer:
This is educational technical analysis and does not constitute financial advice or an investment recommendation.
Trading carries a significant risk of capital loss.
Past performance does not guarantee future results.
Trade at your own risk.
Consult a licensed financial advisor before making any investment decisions.
══════
💬 Share your opinion with us:
What do you think of gold at these levels?
📊 If you found this analysis helpful, don't forget to like and follow it for more analysis.
🔔 Turn on notifications to receive updates as soon as this setting develops.
═════

Momentum Building for Gold Bulls | 4125 → 4270Hello Followers, I am going to share you my opinion on gold next move..
Gold has finally break the bullish rhythm and now currently gold is at working near a resistance area and it's level is 4152/4128. We have two different interfaces here first is if gold break resistance then it'll fly till the target around 4270 and second is if gold respect this resistance then it will fall and will reach the lower support around 4058/4030 and then it'll fly again and break resistance and teach 4270..
KEYPOINTS:
Entry-level 4125
2nd Target 4270
Support area 4058/4030
Resistance Area 4152/4128

XAU/USD | First LONG, then SHORT! (READ THE CAPTION)By analyzing the Gold (XAUUSD) chart on the 15-minute timeframe, we can see that gold hit all targets between $4,300 and $4,350 and even rallied to $4,380.99, marking a new all-time high (ATH)!
After that, gold started to correct below $4,300, briefly dipping to $4,258 before bouncing back above $4,285. I expect that if the price moves into the $4,300–$4,317 zone, we may see a negative reaction or rejection from this area.
If that scenario plays out, gold could drop toward $4,250 as its first key target.
Keep a close eye on these levels — and if you have questions about gold’s trend, feel free to leave a comment using the link below!
Please support me with your likes and comments to motivate me to share more analysis with you and share your opinion about the possible trend of this chart with me !
Best Regards , Arman Shaban

Gold is showing a clear Head & Shoulders structure forming on th
🔹 Price is currently testing the neckline zone around 4110 – 4120
🔹 A potential retest of this area could trigger the next big move
🔹 If rejection happens, we could see a drop toward the Weekly Support (4013)
🔹 A deeper bearish continuation may extend toward the Monthly Support (3877)
However — if bulls manage to break above the neckline, expect a sharp move back toward 4320–4350 resistance zone 🔥
🎯 Key Levels:
Neckline: 4110 – 4120
Weekly Support: 4013
Monthly Support: 3877
Resistance: 4320 – 4350
💬 Comment your bias below – Bullish or Bearish? 👇
#XAUUSD #GoldAnalysis #ForexTrading #TechnicalAnalysis #StressFreeTrading

GOLD REBOUNDS AS INVESTORS BUY THE DIP AFTER ETF SELL-OFFGOLD | Prices Rebound Despite ETF Outflows 💰
Gold prices recovered after an earlier dip triggered by the largest single-day ETF outflow in five months, signaling profit-taking and a technical correction.
Despite investor caution, the metal maintains bullish momentum while trading above 4101, supported by safe-haven demand amid uncertainty ahead of U.S.–China trade talks.
Technically, as long as gold trades above 4101, upside targets remain 4124 → 4163 → 4189.
A clean 1H close below 4075 would shift momentum bearish, opening room toward 4053 and 4011.
Pivot Line: 4101
Resistance: 4124 – 4163 – 4190
Support: 4075 – 4053 – 4011

Gold on Support levels / #6,100.80 Medium-term TargetTechnical analysis: This week's huge red Daily candlestick pattern is an indication of increased tension and war / conflict escalation negativity as geopolitical tensions arise which invalidated Buyers intent and comforted Short-term Gold’s Sellers early on. Gold was once again on High demand as Investors used the metal as an traditional safe-haven asset where capital strongly flew into Gold, pushing the Price-action way above the #13-Month High’s however due Profit taking of most Buyers (Long-term Investors) Gold dipped on Friday's session traditional Profit taking and was testing #4,000.80 benchmark and as (by my personal opinion) DX skyrocketed and engaged Short-term Buy-off rally where Selling pressure from DX de-escalated Gold towards June #1 High’s again (currently even Lower) and currently it is the question where market will be headed next. Gold was on hard Resistance levels and current consolidation levels (historical regression analysis) points that when Trading for Long on those levels, strong downside direction comes in form of #100 to 200 point + decline. Besides this, nothing else Supports the downwards argument (except current High Impact factor) since all Charts turned critically Bearish on Short-term. #4,000.80 mark is now new / old Support and by my calculation chances for breaking it again without new news are Technically really impossible (too far fetched and without catalyst to take the Price-action towards those / current High’s).
My position: However, in each market situation, Trader has to adapt. Therefore, do not take strong bets on the market, Buy and Sell current Intra-day timeframe with aggressive Scalps (#3 to #5-points) and close your order, calling it for the week. Expect new instructions with my Monday-session commentary. Also my #6,100.80 benchmark is posing as my new Medium-term Target.

The Ultimate GOLD || Intraday Trading Plan (10/23/2025)Welcome to Trade with Decrypters!
DETAILED AND COMPLETE ANALYSIS ( 5 TRADE SETUPS )
Central Bank Buying
Central banks added net 19t in August led by Kazakhstan (14t), Bulgaria and El Salvador, Q3 on pace for 1,000t+ annually up 41% from historical norms. BRICS drivers like China (300t+ YTD) and India's $100B reserves fuel de-dollarization and inflation hedges; Poland reaffirms targets amid risks. Silver links to EV/solar boom (+70% China demand). Outlook: Unfazed 1,000t buys lift prices into 2026.
ETF Inflows & Sentiment
Gold ETFs hit $472B AUM in Q3 (+23% q/q) with $64B YTD inflows, September $17B record led by North America/Europe; Asia minor outflows. Safe-haven rush amid trade wars, minor profit-taking post $4k peak. RSI 75 overbought, $3,900 support holds. Silver +$2B YTD on industry bets. Forecast: Gold $4,200 test, silver $50+.
Macro & Geopolitical Events
Fed Oct cut vs. 2.9% inflation/shutdown-delayed jobs—labor firmer but risks grow.
Trump's China tariffs fuel wars; BRICS stalls de-dollarization but boosts gold; Ukraine/Mideast hikes energy/inflation. Drives 50%+ YTD metals gains; tariffs add 1–2% CPI.
Silver Deficit
Fifth straight deficit at 118M oz in 2025 (down 21% YoY), demand stable 1.20B oz vs supply +3% to 1.05B oz, industrial record 680M+ oz from solar/EVs. Renewables offset jewelry drops
Futures & Options Flow
CME gold OI ~528k contracts, steady amid volumes; CVOL moderate, call/put skew bullish for rate-cut squeezes
Fundamentals & Forecast
Gold +51% to $4,062, silver +43% to $48—via 1,000t+ CB buys, inflation, cuts, 7% GDP deficits. De-dollarization/geo-risks dominate. Projection: Gold $4,400 Q4, silver $57 mid-2026

Gold Sell IdeaGold is still strongly bearish on the daily timeframe, though there is a slight pullback. Dialing back to the 6hr timeframe, the Aroon (1) gave a sell signal and the RSI (3) dipped below 50. On the 2hr timeframe, a Supertrend (2, 1.2) has also fully formed. SL at high of recent pullback and RR is 1:2. Gl

ANALYSIS FOR THE WEEK Gold retraced down on Friday to create a higher low and tested a major zone around 4190 area, if it closed below 4190 it would have triggered more sells but it didn't and got rejected thereby closing above 4200 and this is a sign of bullish resumption and as a trader with fair understanding of the market the next thing to look for is a buy and the first best place to buy is at 4235-30 and hold it but if you want to really manage your trade, i suggest you close at 4335-40 and if it closes above 4365 then you target a buy again at 4365-60 area and hold for ever,
price could be rejected at 4340 or anywhere within the upper rectangular block and sell to close below 4190 for it to sell more for some days, so to prevent losing gained profits you can close at 4340 in order to be at the safer side incase the market decides to change to long term sells, if you have the courage to hold, then you can hold because the trend is bullish overall and i will update it too, if it decides to change direction i will signal it early before it becomes late.
Clue: if Monday closes with a bullish candle especially above 4365 then we are buying from Tuesday going, but if it closes bearish on Monday (D1) then we will definitely sell from Tuesday going especially if it closes below 4190.
2

Gold Retest of a Daily Demand and Inverse H&S on M15 TFPrice has pulled back to a daily demand zone and there is an entry confirmation pattern on the M15 TF.
As long as the demand zone holds, the bulls will take over. Your position size should be determined by your entry and SL.
Good Luck folks.

GOLD Bearish Bias!
HI,Traders !
#GOLD made a bearish
Breakout of the key
Horizontal level of 4189.93
Which is now a resistance
AndAfter retesting that area we
will be expecting
A further move down !
Comment and subscribe to help us grow !

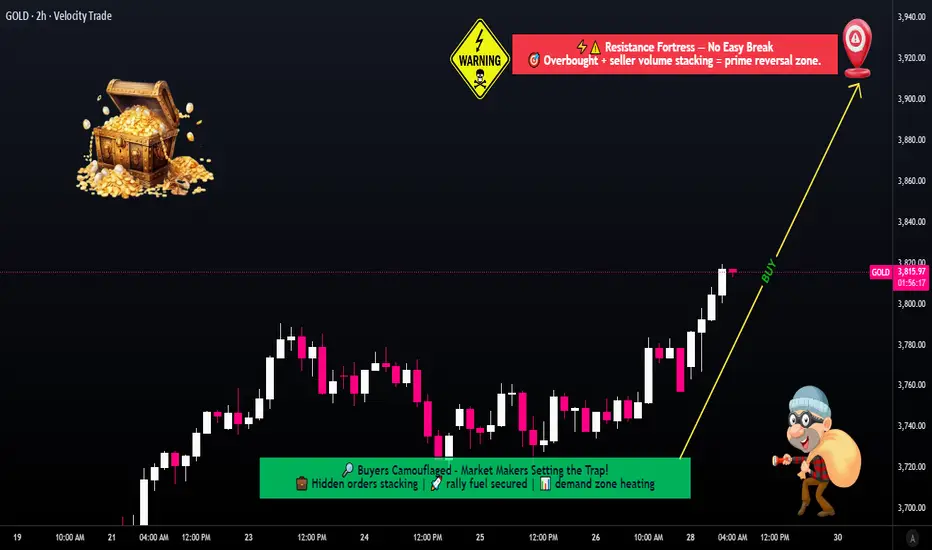
XAU/USD Metals Outlook: Bullish Path with Layered Buy Entry Plan🔥 XAU/USD: Thief’s Gold Heist Strategy Map (Swing/Day Trade) 💰
🎯 Asset: XAU/USD (Gold vs. U.S. Dollar) — The Shiny Metal’s Wealth Hunt!📈
Market: Metals Market
🏆 Strategy Vibe: Bullish Bandit Plan with a Thief-Style Layering Twist! 😎
🕵️♂️ The Thief’s Bullish Plan: Steal the Gold!
We’re diving into the XAU/USD market with a bullish swing/day trade setup using a slick Thief Layering Strategy. This involves stacking multiple buy limit orders to catch the price at key levels. No boring single entries here — we’re building a multi-layered trap to snag those pips! 🪤
📊 Key Setup Details
🎯 Entry Levels:
Deploy the Thief Layering Strategy with multiple buy limit orders at:
💰 3760
💰 3780
💰 3800
Pro Tip: Feel free to add more layers based on your risk appetite! Stack those limits like a master thief planning a heist. 😏
🛑 Stop Loss:
Thief’s SL set at 3720.
Note: Dear Ladies & Gentlemen (Thief OG’s), this SL is my take — you’re the boss of your trades! Set your stop loss based on your risk tolerance. Trade smart, steal smarter! 💡
🎉 Take Profit Target:
Aim for the Electric Shop High Voltage Trap at 3920. This zone screams strong resistance, overbought signals, and a potential trap for the unprepared. Escape with your profits before the market zaps you! ⚡️
Note: Thief OG’s, this TP is my suggestion. Grab your profits at your own pace and risk level — make it rain when you’re ready! 💸
🔗 Related Pairs to Watch (Dollar-Based Correlations)
Keep an eye on these USD-based pairs for market synergy and correlation:
FX:USDJPY : A stronger USD could pressure gold prices, so watch for inverse moves. If USD/JPY spikes, XAU/USD might dip. 📉
OANDA:USDCHF : Another safe-haven pair. If CHF strengthens, it could signal risk-off vibes impacting gold. 👀
TVC:DXY (U.S. Dollar Index): Gold often moves inversely to the dollar. A rising DXY could cap XAU/USD’s upside — stay sharp! 🧠
OANDA:XAGUSD (Silver): Gold’s shiny cousin often follows XAU/USD’s lead. Check for confirmation in silver’s price action. ✨
Why Watch These? Correlations help you spot market sentiment. If USD strengthens across pairs, gold’s bullish run might face resistance. Use these as your Thief’s Radar to time your entries! 🕵️♀️
🔑 Key Points of the Thief Strategy
Layering Entries: Multiple buy limits spread risk and increase chances of catching a favorable entry. Think of it as setting multiple traps for the price! 🪤
Risk Management: The suggested SL at 3720 keeps losses tight, but adjust based on your account size and risk tolerance.
Resistance Watch: The 3920 zone is a high-voltage trap with overbought signals. Secure profits early to avoid getting caught in a reversal. ⚡️
Market Context: Gold thrives in uncertainty, so keep an eye on global events, Fed news, or inflation data that could spark volatility. 📡
⚠️ Disclaimer
This is a Thief-Style Trading Strategy crafted for fun and educational purposes. Trading involves risks, and past performance doesn’t guarantee future results. Always conduct your own analysis and trade at your own risk. Stay sneaky, stay safe! 😎
✨ If you find value in my analysis, a 👍 and 🚀 boost is much appreciated — it helps me share more setups with the community!
#️⃣ #XAUUSD #GoldTrading #ThiefStrategy #SwingTrading #DayTrading #BullishSetup #ForexTrading #TradingView
XAU/USD Technical Setup ‖ Bullish Momentum or Smart Trap?🏆 XAU/USD: The Golden Heist Blueprint | Swing & Scalp Strategy 💰
📊 Market Overview
Asset: XAU/USD (Gold vs U.S. Dollar)
Market: Precious Metals
Strategy Type: Dual Setup - Swing Trading (Bullish) & Day Trading/Scalping (Bearish)
Risk Level: High Volatility Zone ⚠️
🎯 The Master Plan
🚀 Bullish Scenario: "To The Moon" Setup
Breakout Level: $4,400.00
Action: Direct long entry on confirmed breakout above resistance
Logic: Clean break = institutional momentum shift
🔻 Bearish Scenario: Scalping/Day Trade Setup
Breakdown Level: $4,050.00
Action: Short positions on confirmed break below support
⚠️ Trap Alert: Any pullback above $4,050.00 post-breakdown = potential smart money trap. Watch for false breakouts!
🛡️ Risk Management Zone
Stop Loss (Pullback Buy Plan): $3,950.00
⚠️ Disclaimer: This SL is based on my analysis for the bullish pullback scenario. You're the captain of your own ship! Adjust stops according to your risk tolerance, account size, and trading style. Never risk more than you can afford to lose.
🎖️ Profit Targets
Buy Side Target: $4,600.00
Exit Strategy Notes:
Strong resistance confluence at this level
Overbought conditions likely
Potential trap zone for late entries
Recommendation: Scale out profits gradually rather than waiting for the full target
Sell Side Target: $4,050.00
Exit Strategy Notes:
Major support level - expect bounces
High probability of liquidity grab at this zone
Consider partial profit taking before reaching full target
Recommendation: Trail stops as price moves in your favor
⚠️ Disclaimer: These targets are MY analysis, not financial advice. Take profits when YOUR strategy signals, not mine. Trail stops, scale out, or exit based on YOUR plan. Your money, your rules! 💪
🔗 Related Markets to Watch
Correlated Assets:
DXY (U.S. Dollar Index): Inverse correlation - Dollar strength = Gold weakness
GC (Gold Futures): Direct correlation - Institutional positioning indicator
XAUEUR (Gold vs Euro): Alternative safe-haven flow gauge
US10Y (10-Year Treasury Yield): Inverse correlation - Rising yields pressure Gold
BTCUSD (Bitcoin): Risk-on/risk-off sentiment indicator
Key Fundamental Drivers:
Fed monetary policy & interest rate decisions
Inflation data (CPI/PCE reports)
Geopolitical tensions (safe-haven demand)
Real yields & opportunity cost
🔑 Key Technical Points
✅ Breakout Confirmation: Wait for candle close above/below key levels
✅ Volume Analysis: High volume breakouts = higher probability
✅ Smart Money Traps: Watch for failed breakouts and liquidity grabs
✅ Risk-Reward Ratio: Calculate before entry - minimum 1:2 recommended
✅ Market Structure: Respect higher timeframe trends
🎭 Trading Psychology Reminder
This strategy has a playful "heist" theme for entertainment, but make no mistake — treat your capital with serious respect. The market doesn't care about our plans. Adapt, manage risk, and preserve capital above all else.
Remember:
No setup is guaranteed
Always use stop losses
Never risk your rent money
Emotions are the enemy
The market pays patient traders
✨ If you find value in my analysis, a 👍 and 🚀 boost is much appreciated — it helps me share more setups with the community!
#XAUUSD #Gold #GoldTrading #ForexTrading #SwingTrading #DayTrading #Scalping #TechnicalAnalysis #PreciousMetals #TradingStrategy #RiskManagement #Forex #GoldAnalysis #TradingIdeas #MarketAnalysis #PriceAction #Breakout #SupportAndResistance #TradingView #ForexSignals
Happy trading, and may the pips be ever in your favor! 🎯💎

XAU LONGSLast post moving fast here….
$4236 flat and 34 entries!!!
Going with stops at $4200 flat, ZERO Allowance!!!
Refer to previous posts for handles and currently working with $4281 into 85 for breach.
Let’s see! 🏦
