Gold 1H – Can Gold Hold Above 4247 as Powell Takes the Stage?XAUUSD – Intraday Trading Plan | by Ryan_TitanTrader
📈 Market Context
Gold holds firm near $4,230, with traders cautiously awaiting U.S. Retail Sales data and Fed Chair Powell’s remarks later today.
After a series of softer inflation reports, market sentiment has tilted mildly dovish — yet the U.S. dollar remains steady as investors hesitate to price in early rate cuts.
The Fed’s tone today will be critical: a hawkish Powell could trigger short-term profit-taking on gold, while any dovish signals may reignite safe-haven bids.
Expect choppy intraday movement with liquidity sweeps around key zones before a confirmed directional move emerges.
🔎 Technical Analysis (1H / SMC Style)
• The structure remains bullish, confirmed by previous Breaks of Structure (BOS) and a Change of Character (ChoCH) earlier in the week.
• Price is now approaching a premium supply zone at 4247–4249, where potential short-term sell reactions could appear before retracement.
• Below, the discount demand zone at 4184–4186 aligns with prior BOS support and acts as a high-probability reaccumulation area.
• If price revisits the buy zone and forms bullish confirmation on M15, continuation toward new highs around 4260+ is favored.
🔴 Sell Setup: 4247 – 4249
SL: 4255 – 4257
TP targets: 4210 → 4195
🟢 Buy Setup: 4184 – 4186
SL: 4174
TP targets: 4210 → 4245 → 4260+
⚠️ Risk Management Tips
• Wait for M15 BOS/ChoCH confirmation before executing either setup.
• Watch for volatility spikes around Powell’s speech and U.S. Retail Sales release — spreads may widen.
• Consider partial profits at intra-day liquidity points and trail stops once structure confirms.
✅ Summary
XAUUSD maintains its bullish structure but may face a liquidity sweep above 4247–4249 before a deeper retracement into 4184–4186.
Institutional activity could drive accumulation near the discount zone if macro data supports dovish sentiment.
The intraday bias remains “Buy the Dip”, with tactical sells possible at premium resistance for short-term scalps.
Trade ideas

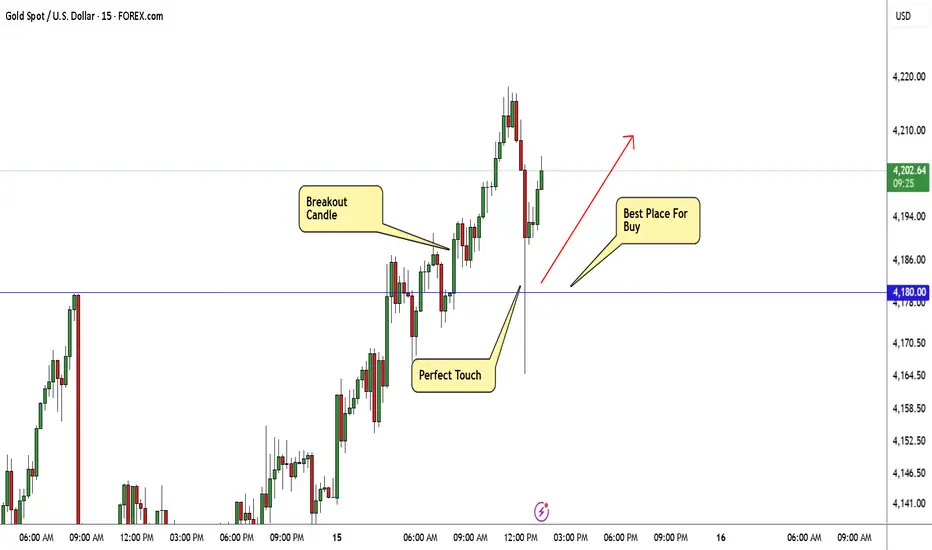
GOLD Breakout Done , Long Setup Valid To Get 300 Pips !Here is My 15 Min Gold Chart , and here is my opinion , the price going up very hard without any correction so we should move with it and we have a 4H Candle closure above our Res 4180.00 And Perfect Breakout and this give us a very good confirmation , so we have a good confirmation now to can buy after the price go back to retest the broken area 4180.00 One more time and we have already a great touch that take all stop losses before going up so i think the second touch will be better and will give us a good chance to enter with good stop loss , and we can be targeting 100 to 300 pips . if we have a daily closure below this area this mean this idea will not be valid anymore .
Reasons To Enter :
1- Perfect Touch For The Area .
2- Clear Bullish Price Action .
3- Bigger T.F Giving Good Bullish P.A .
4- The Price Take The Last High .
5- Perfect 4H Closure .
XAUUSD – Bullish Trend Remains DominantHello everyone,
Gold has made an impressive breakout, doubling in value over the past two years, and is now approaching the 4,400 USD/ounce level. However, this also raises concerns about the potential formation of a speculative bubble, which could lead to a market collapse similar to previous gold investment frenzies.
Nevertheless, the current uptrend is still supported by strong macroeconomic factors. Expectations for continued US rate cuts and the demand for gold as a safe-haven asset amid political instability in the US continue to push gold prices higher.
Additionally, on October 20th, gold surged due to the instability created by the US government shutdown, prompting investors to turn to gold as a value-preserving asset while awaiting US-China trade negotiations and upcoming inflation data from the US.
Technical Analysis
XAUUSD is moving strongly within an ascending channel, currently trading around 4,345 USD, near the previous highs.
The key support is at 4,240 USD – if the price adjusts back to this level and holds, the uptrend will likely continue.
Short-term targets: 4,430 USD (TP1) and 4,500 USD (TP2).
RSI indicates strong bullish momentum with no signs of reversal.
Conclusion
With favorable macroeconomic conditions and strong technical trends, gold maintains its bullish trajectory. Minor pullbacks may provide buying opportunities with a target at the 4,500 USD region.

Gold Double Top Forming – Correction Ahead?When an asset hits an All-Time High(ATH) , technical analysis can get a bit tricky because there’s no historical resistance above and the usual technical rules might have less impact. However, right now it seems like some technical principles are still visible on gold’s chart, at least on the 1-hour timeframe , and I’d like to share that with you.
At the moment, Gold has broken below the lower line of its ascending channel, the Support zone($4,320 – $4,279) , and the neckline of a Double Top Pattern . This could indicate the start of a short-term correction. Given how strong gold’s momentum has been in recent weeks, this correction might not last too long since gold remains very attractive globally.
From an Elliott Wave perspective , the formation of a double top pattern might signal the end of an impulsive wave and the beginning of a corrective phase .
I expect that in the next few hours, Gold could at least drop to the Double Top Pattern’s target around $4,183 . If Gold breaks the Support zone($4,193 – $4,156) , we could see a deeper correction .
Second target:$4,143
Stop Loss(SL): $4,385(Worst)
Please respect each other's ideas and express them politely if you agree or disagree.
Gold Analyze (XAUUSD), 1-hour time frame.
Be sure to follow the updated ideas.
Do not forget to put a Stop loss for your positions (For every position you want to open).
Please follow your strategy; this is just my idea, and I will gladly see your ideas in this post.
Please do not forget the ✅ ' like ' ✅ button 🙏😊 & Share it with your friends; thanks, and Trade safe.


Gold Price consolidation to downside side What's should Next ?Gold prices have reached a new record high as investors continue to bet on the U.S. Federal Reserve maintaining its path toward lower interest rates. Ongoing geopolitical tensions between China and the U.S. are also supporting gold’s safe-haven demand.
Technical Outlook:
The price recently tested a new high zone near 4,380, which formed after a downside correction If the price fails to break above 4,365, we could see a short-term selling pattern develop In that case, a potential retracement could target the 4,308 – 4,280 area.
However, a confirmed break and close above 4,365 could invalidate the short-term bearish setup and suggest further upside momentum. With the upcoming U.S. session and major economic events ahead, traders should expect increased volatility and one-sided movement once direction Formed
You may find more details in the chart.
Trade wisely best of Luck.
Ps; Support with like and comments for better analysis Thanks For Supporting.

Gold Have Chance to Growth a New zone 4225 to 4260 ?Gold prices surged to new all-time highs today, breaking above the $4,200 resistance before retracing slightly toward support. As seen before, the pullback attracted fresh buying interest, suggesting that bullish momentum remains intact.
Market sentiment continues to be supported by rising trade tensions — reports indicate that Trump is considering a ban on Chinese vegetable oil imports, while China is said to be preparing reciprocal port fees. These developments have increased safe-haven demand for gold.
Additionally, with the Federal Reserve maintaining its dovish stance, the overall macro backdrop remains supportive for further upside in gold prices.
A false breakout pattern appears to be forming, indicating a potential technical pullback before the next leg higher. The broader trend remains bullish, with no strong fundamental reasons for a deep correction at this stage. so from the current situation we could expect next target zone would be 4225 to 4260,
You may find more details in the chart.
Trade wisely best of Luck Buddies,
Ps; Support with like and comments for better analysis Thanks for Supporting.

Gold 1H – Bearish Reaction After Consecutive Gains🟡 XAUUSD – Intraday Trading Plan | by Ryan_TitanTrader
📈 Market Context
After several sessions of steady gains, gold is showing signs of exhaustion as U.S. Treasury yields stabilize and traders reassess the Federal Reserve’s next move.
The market’s focus today is on U.S. housing data and Fed officials’ remarks, which could shape expectations for the December policy outlook.
• A hawkish tone from policymakers may strengthen the dollar and pressure gold lower.
• Conversely, softer remarks could briefly trigger buying around key discount zones, but the overall tone remains corrective after the recent rally.
Market liquidity is concentrated near the $4,230 area — where price may tap into unmitigated supply before continuing its bearish leg.
🔎 Technical Analysis (1H / SMC Style)
• Structure: The overall bias has shifted bearish following consecutive ChoCH and BOS formations.
• Premium Zone: The 4,230–4,228 area aligns with an H1 order block and previous liquidity pool — a prime zone for short re-entry.
• Liquidity Sweep: The recent upside push toward 4,230 may sweep late buyers before the next bearish leg unfolds.
• Discount Zone: Short-term liquidity may rest around 4,080–4,100, which aligns with previous sell-side imbalance (SSI) and acts as an intraday reaction zone.
🔴 Sell Setup
• Entry: 4,230 – 4,228
• Stop-Loss: 4,240
• Take-Profit Targets: 4,100 → 4,080 → 4,050+
🟢 Buy Scalp Setup (Short-Term Countermove)
• Entry: 4,081 – 4,083
• Stop-Loss: 4,074
• Take-Profit Targets: 4,100 → 4,115
(Only valid if liquidity sweep confirms reaction within discount zone)
⚠️ Risk Management Notes
• Confirm M15 BOS/ChoCH before entry — avoid blind orders during news.
• Reduce position size for scalp entries; primary directional bias remains bearish.
• Lock partial profits near first liquidity targets and trail stops as structure confirms continuation.
✅ Summary
Gold faces near-term correction pressure after multiple bullish sessions.
The 4,230–4,228 zone offers a clean premium OB entry for continuation shorts, while reactive buyers may scalp intraday from 4,081 if liquidity sweeps occur.
Stay adaptive — today’s sentiment is short-term bearish within a larger range-bound structure.
FOLLOW RYAN_TITANTRADER for daily SMC setups ⚡

XAUUSD Long: Path to 4280 After Successful RetestHello, traders! The price auction for XAUUSD has been in a powerful and sustained bullish phase, with the market structure being clearly defined by a major ascending trend line. This uptrend has demonstrated significant strength, breaking through multiple key resistance levels such as 3820 and 4055, confirming that buyers are in full control of the market.
Currently, the auction has entered an acceleration phase. The price has broken out above its long-term ascending trend line, a significant event that suggests the bullish momentum is increasing. The market is now in a clear expansion phase, trading in new high territory after leaving the prior structure behind.
My scenario for the development of events is a classic breakout and retest of this major trend line. I believe the price will make a corrective pullback to test the broken trend line from above, confirming it as new support. In my opinion, a successful bounce from this line would validate the acceleration and trigger the next impulsive wave higher. The take-profit is therefore set at 4280. Manage your risk!

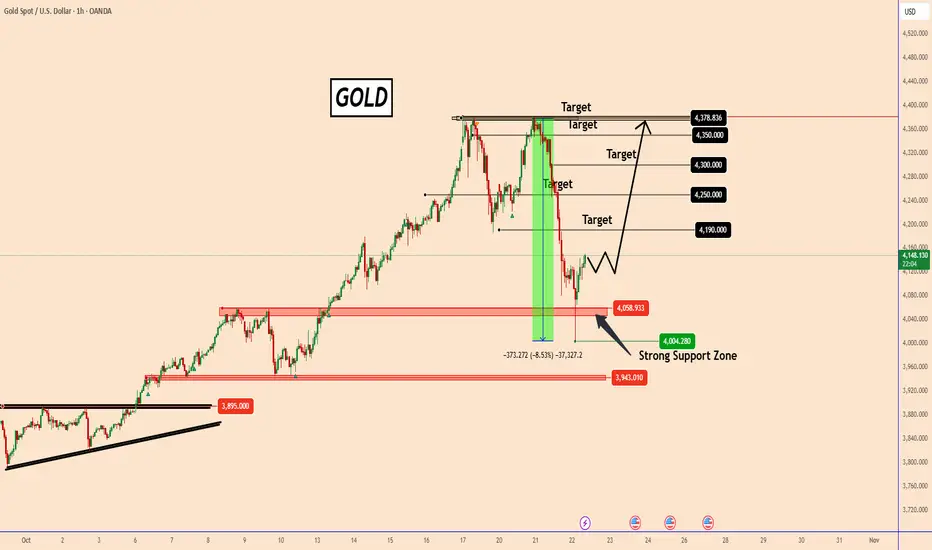
Gold Pulls Back on Profit-Taking, Bulls Defend the $4000 LevelGold Pulls Back on Profit-Taking, Bulls Defend the $4000 Level
Yesterday, gold faced a quick sell-off, likely triggered by the profit-taking of large institutions (manipulators), and corrected by almost 8.6%.
Considering that this move was created without news, it is a clear sign of manipulation. We cannot consider overbought conditions, as they have been in this state for 2 years.
The lower low was created near 4000, where the price found the bulls well-positioned near that psychological price zone.
Gold remains bullish and could rise again as shown in the chart.
It will break the 4000 level only if a larger manipulation unfolds again today or during the next week.
The price should rise again with targets at 4190; 4250; 4300 and 4350.
You may find more details in the chart!
Thank you and Good Luck!
❤️PS: Please support with a like or comment if you find this analysis useful for your trading day❤️
GOLD (XAU/USD): Bullish Move After Liquidity GrabIt appears that a significant bearish trap may have formed following a test of a strong horizontal support on an intraday chart.
Furthermore, a strong bullish confirmation, a bullish change of character, is evident on the hourly chart.
I anticipate that the price may potentially increase to the 4200 level.

XAUUSD: Rally can Reach new ATH - $4520 pointsHello everyone, here is my breakdown of the current Gold setup.
Market Analysis
Gold has been in a very strong and complex uptrend. We saw the price break out of an initial range and then establish a major Trend Line that has guided it higher, breaking through key levels like Support 2 at 3670 and Support 1 at 4020.
Currently, the most significant event is that the price has broken out above its main Trend Line. After this powerful move, the market has entered a natural corrective phase and is pulling back towards this broken line for a classic retest. This is a critical area to watch.
My Scenario & Strategy
I'm looking for the price to complete its correction down to this main ascending trend line. The key signal for me would be a confirmed and strong bounce from this dynamic support, which would tell me the pullback is over and the primary trend is ready to accelerate.
Therefore, the strategy is to watch for this bounce. A successful defense of the trend line would validate the long scenario. My new target for the next impulsive wave higher is 4520, which would represent a new ATH.
That's the setup I'm tracking. Thank you for your attention, and always manage your risk.

XAUUSD - Recovery Ahead of the Weekend👋Hello everyone, what do you think about OANDA:XAUUSD ?
Last week continued to be a victorious one for the Bulls. The metal successfully broke through the $4,000 level, setting a new record. By Thursday, a slight pullback occurred, but overall, the trend remained positive, and momentum returned by Friday.
Accordingly, the gold market saw a slight increase ahead of the weekend after the latest data showed that U.S. consumer sentiment remained stable. Specifically, the preliminary October consumer confidence index reached 55 points, higher than the 54.2 points forecast by experts, but still slightly below September’s 55.1 points.
However, this was seen as virtually unchanged compared to September. As soon as the data was released, gold prices started to rise gently.
Technical Outlook: For now, gold seems to be holding strong. The BOS structures continue to repeat, and typical indicators like the EMA 34 and 89 are still signaling positive momentum. The next target for the bulls is to reclaim the resistance area at 4059, followed by closing above the strong resistance at $4,100/ounce.
What about you? 💬Do you think XAUUSD will reverse or continue to rise? Share your thoughts in the comments!

Hellena | GOLD (4H): SHORT to support area of 4040.Gold is actively rising and I believe that before the impulse ends we should see the correction that many are expecting.
As of today, I see the completion of the higher order wave “3” and the approaching start of the correction in wave “4”. It makes no sense to put any distant plans in the correction and I think that the support area of 4040 looks quite attractive.
Fundamental context
Gold continues its rally and recently broke new highs, fueled by expectations of U.S. rate cuts, global uncertainty, and safe-haven demand. Central banks are still actively increasing their gold reserves — this structural demand adds support even if price pullbacks occur.
Supply growth is modest — mining output is constrained, and recycling of gold is not enough, which limits the downward pressure on prices.
Given this backdrop, the chance of a correction rises as momentum stretches — but the underlying fundamentals remain favorable for further upside once the correction completes.
Manage your capital correctly and competently! Only enter trades based on reliable patterns!

Gold Consolidation a Next Growth OpportunityGold prices are currently consolidating after recent volatility. On Friday, the market broke its local structure, slightly shifting overall sentiment and prompting traders to focus on the current consolidation zone.
On Tuesday, gold prices rose as easing U.S.–China trade tensions and reduced concerns over banking sector credit risks supported risk appetite. However, this improved sentiment also limited gold’s upside as some safe-haven demand faded. Despite signs that the rally may be overextended, investors continue to show buying interest in gold.
Recently, gold experienced a breakout followed by a sharp pullback, reaching support near 4244. The price has since rebounded and is currently trading around 4270. If the price continues to test and break above the immediate resistance, there is a strong potential for upward movement towards 4318–4358. Conversely, failure to sustain above 4248 and a close below this level could trigger further downside pressure, potentially pushing the price towards 4200 or lower correctio.
You may find more details in the chart.
Trade wisely best of luck Buddies.
Ps; Support with like and comments for better analysis Thanks for Supporting.

Gold prices plummeted, analysis for next week!Gold market analysis for next Monday:
Gold finally experienced a sharp pullback. Yesterday, gold hit a high of 4379, then fluctuated back and forth, rising to a low of 4278 before rebounding to the intraday high. This is a typical extreme move driven by a short-term sell-off at high levels. This week, there seemed to be a series of one-way plunges of more than 80 points, followed by a rebound to offset the decline. While the Asian session rebounded, the US market presented a different picture! After the Asian session's correction, there was a V-shaped rebound, followed by a one-way decline after a high. The US market continued its decline, with a relatively wide range. The low reached 4186, a maximum difference of 193 points from the high of 4379. The 1-hour chart saw a second upward move, but pressure was applied at 4379, forming a double top. A sharp sell-off in the US market lowered the price to 4186. The daily chart recorded a large, real-body bearish candlestick. While a single candlestick pattern alone is insufficient to signal a reversal, the rapid pace of the previous rally suggests a technical correction is needed. The weekly chart support is far from support, so a short position at 4379 is still a viable option.
I saw a significant bearish trend on the daily chart, with a single bearish candlestick covering a bullish candlestick. The 4-hour chart also saw three large bearish candlesticks, resulting in a $170 drop. This indicates the presence of upward pressure, and this week's bullish rally has also led to a technical correction. Gold's pullback in the US market did not lead to a rebound, but instead broke down and fell. Short-term resistance has formed at 4280. If gold rebounds and finds pressure at 4280, short-term short positions are warranted. Gold may begin to adjust.
Yesterday, we repeatedly emphasized the importance of the 4280 area for gold. If it falls below this level, a direct short position could target the 4200-4180 area. Indeed, gold plummeted. This is the rhythm. Next Monday, consider shorting gold at the neckline resistance level of 4275-80. Overall, our short-term trading strategy for gold next Monday is to prioritize shorting on rallies, with a secondary focus on long positions on pullbacks. Focus on resistance at 4275-4280 in the upper short term, and support at 4180-4090 on the lower side. Be sure to keep up with the market. Specific price levels will be determined by real-time intraday data. Welcome to discuss real-time market trends.
Next Monday's gold trading strategy:
Selling strategy:
Short (sell) 20% of your position in batches when gold rebounds near 4275-4280, targeting the 4230-4200 range. A break below targets the 4180 level.
Buying strategy:
Buy (buy) 20% of your position in batches when gold pulls back near 4175-4180, targeting the 4230-4250 range. A break below targets the 4275 level.

XAU/USD (Gold 4H timeframe)... XAU/USD (Gold 4H timeframe) — here’s what’s visible and how it breaks down technically:
Price: Around 4065 USD currently.
Trendline: A major uptrend line has been broken clearly.
Ichimoku Cloud: Price has fallen below the Kumo, confirming bearish momentum.
Support Zone: Between 4120–4160 USD, already broken and retested.
Measured Move (Target Projection): my chart’s extension line points toward a target around 3840–3860 USD.
📉 Target Breakdown:
Immediate support: 4000 USD (psychological round number).
Main target: 3840 USD (as marked on My chart — aligns with previous structure support).
Extended bearish target: If momentum continues, 3740–3760 USD zone may come next.
⚠ Notes:
If gold reclaims above 4160–4180, bearish bias weakens.
Below 4060 = bears in full control.
Below 4000 = confirmation toward your target zone (≈3840 USD).
✅ Final Target: $3,840 – $3,860 USD
Would you like me to give you stop-loss and re-entry zones too (for sell setup)?

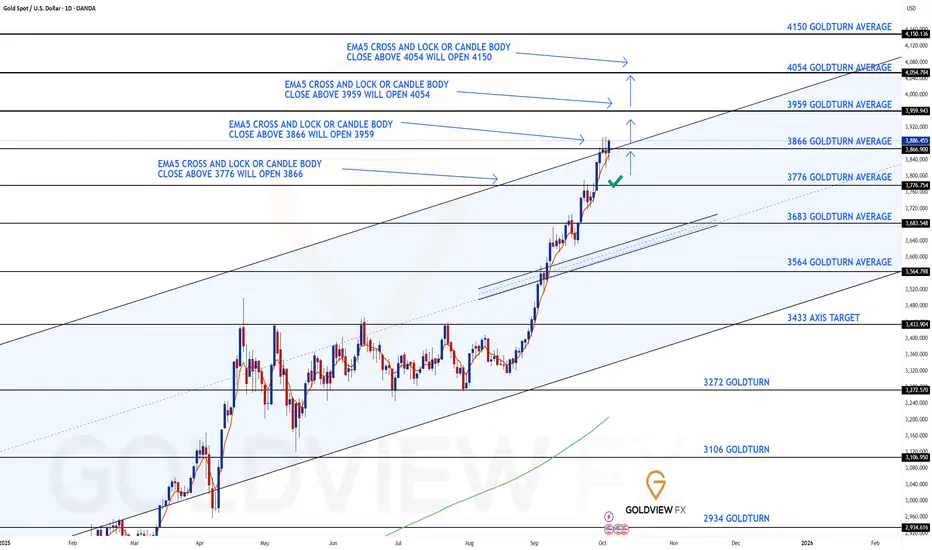
GOLD DAILY CHART ROUTE MAP UPDATEDaily Chart Update – Goldturn Channel Analysis
Hey Traders,
After successfully completing our previous Daily chart projection, we’re excited to share our latest Goldturn Channel update and Daily chart idea, our proprietary method of identifying structural turning points within Golds ascending channel formation.
Price action has now reached the upper boundary of the Goldturn channel, following a precise move to the 3866 target, triggered by the body close above 3776. With a new body close above 3866, we now have the 3959 gap open.
The 3866 channel top area remains a critical inflection point:
A confirmed EMA5 cross and lock above the channel top would strengthen the bullish breakout structure.
Conversely, an EMA5 rejection or close back below this level may indicate a fake out or short-term exhaustion.
On the downside, 3766 now acts as the nearest dynamic support, while 3683 aligns with the channel midline and remains a key structural pivot should deeper correction unfold.
As always, we will keep you all updated with regular updates throughout the week and how we manage the active ideas and setups. Thank you all for your likes, comments and follows, we really appreciate it!
Mr Gold
GoldViewFX
Why Did Gold Plunge Yesterday – Key Factors ExplainedHello everyone, the gold market just experienced a dramatic session, with the front-month futures contract falling over 5.39% in a single day, marking the deepest drop since June 2013. This sharp correction follows an extended period of rapid gains, forcing many traders to reassess the short-term trend.
Main reasons behind the sharp drop
Correction after strong growth: Gold has surged over 128% from its 2011 baseline, but the lack of intermittent pullbacks created expectations for a significant retracement. When the correction occurred, it happened quickly and steeply, just as many veteran traders anticipated.
Divergence with silver: Although silver fell 7.2%, its decline was “modest” compared to gold. Gold’s parabolic rise contrasted with silver’s steadier gains, reinforcing the likelihood that gold would continue adjusting while silver maintained a sustainable upward trajectory.
Historical surge dynamics: From lows around 2,500 USD/oz, gold soared past 4,200 USD with hardly any meaningful consolidation. A long-term surge without pullbacks almost inevitably leads to sharp reversals, clearly illustrated by yesterday’s drop.
With the Double Top pattern fully formed and the neckline broken, I expect gold could fall to the strong support zone around 4,000 USD or lower if the decline continues. Current resistance stands at 4,200 USD, a level difficult for gold to reclaim in the short term. The market is confirming a downtrend, so traders should monitor the support zones closely to identify optimal entry points.
Do you think this is a buying opportunity at lower gold prices or just a temporary dip? Share your thoughts below!

How to Short Gold as a Stock Trader and Profit on the DropGold is at historically high levels due to several key factors
Geopolitical Tensions: Trade disputes, regional conflicts, and global uncertainty are pushing investors toward safe-haven assets like gold
Monetary Policy Expectations: Anticipated interest rate cuts reduce the opportunity cost of holding gold, making it more attractive compared to bonds or cash
Weakening U.S. Dollar: A softer dollar makes gold cheaper for international buyers, boosting demand
Central Bank and Institutional Demand: Many central banks are increasing gold reserves, and institutional investors are allocating more to gold as a hedge against economic instability
Market Sentiment and Speculation: Bullish sentiment and speculative positioning are adding upward pressure on prices
If these factors start to ease, such as trade tensions reducing (highly likely with the next Trump Tweet), interest rates staying the same or even rising (less likely), or the dollar strengthening (likely), gold could start to pull back and given how aggressive its run has been, it could be a significant pull back.
For investors looking to profit from declines, inverse gold ETFs provide a way to benefit when prices fall, offering a strategic tool for hedging or directional trading.
They are a MUCH riskier type of trade - especially leverage ETFs so please do your research beforehand and definitely do not invest any money you can't do without if it all goes horribly wrong and Gold does indeed continue to head up past $5k.
Crazy times - hence probably why Gold is doing so well.
Buyer / bear - beware :)

(Gold 2H – XAU/USD):(Gold 2H – XAU/USD):
✅ Breakdown confirmed: Price has clearly broken below the ascending trendline and retested it (marked by the red circle).
✅ Support zone: Price is sitting just below the previous support box (~4,250–4,230).
✅ Ichimoku Cloud: Next visible support lies inside the Kumo (blue shaded area).
🎯 Target Levels (Downside)
1. First target: 4,180 – 4,170 → top of the Ichimoku cloud.
2. Main target: 4,130 – 4,110 → the “Target Point” you have marked (bottom of the cloud and horizontal support).
3. Extended target (if momentum continues): 4,070 – 4,050 → next structural support zone.
📈 Summary
Entry: After the retest near 4,250.
TP1: 4,180
TP2: 4,130
SL: Above 4,270 (trendline retest).
So, my main target zone = 4,130 ±20 (as drawn on my chart).

Gold Spot (XAU/USD) 1-hour timeframe ...Gold Spot (XAU/USD) 1-hour timeframe I'm using the Ichimoku Cloud setup with Fibonacci or horizontal resistance levels marked.
Here’s the analysis breakdown:
Current price: around $4,261
Ichimoku cloud: price is retesting the cloud top, showing potential for bullish continuation if it holds above the cloud.
My drawn levels and arrows indicate a pullback to around $4,250–$4,260, followed by a bounce toward the upside.
🎯 Target Point (based on my chart and Fibonacci zones)
The blue arrow and upper red arrow point toward:
Target zone: around $4,360 – $4,380 USD
🔍 Summary
Element Level (Approx.)
Current Price $4,261
Support / Cloud Base $4,240 – $4,250
Resistance / Target $4,360 – $4,380
Stop-loss (suggested) Below $4,230 (below the cloud and recent low)
This suggests a potential bullish move of about $100–$120 from current levels if the price confirms above the cloud and breaks $4,300 resistance.

THE KOG REPORT - UpdateEnd of day update from us here at KOG:
Yesterday we shared the hot spots together with the levels which as you can see worked well paired with the red box holding price down to play the range.
Now, with buyers starting to lose faith and start hedging longs from above, we need some more confidence in the up move in our opinion. For that reason, we will say that the baseline here sits are 4030 and above that level we may be looking at the 4070-74 level initially. We need to form a swing here to at least meet the voids.
Price: 4089
RED BOXES:
Break above 4095 for 4110, 4125 and 4140 in extension of the move
Break below 4082 for 4064✅, 4050✅ and 4020✅ in extension of the move
As always, trade safe.
KOG
