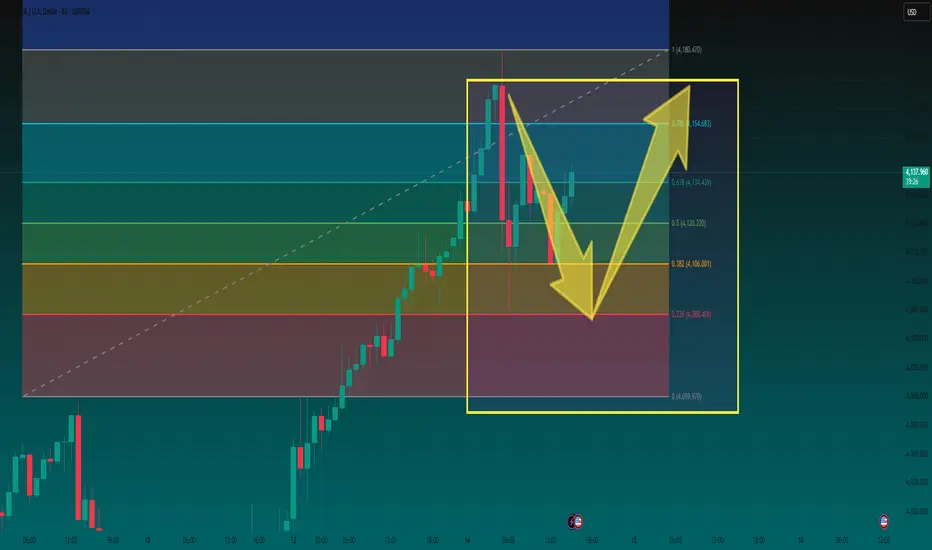
GOLD (XAUUSD): New ATH & Next Resistances
As I predicted, Gold updated the ATH this morning.
The next strong resistances that I see are:
Resistance 1: 4098 - 4103 area
Resistance 2: 4148 - 4153 area
Get ready for more growth.
❤️Please, support my work with like, thank you!❤️
I am part of Trade Nation's Influencer program and receive a monthly fee for using their TradingView charts in my analysis.
Trade ideas

Gold/USD: Bullish Climb to $4100?OANDA:XAUUSD is showing a bullish setup on the 1-hour chart , with an entry zone between $3,963-$3,985 near a key support level.
First target at $4,075 marks initial resistance, while the second at $4,100 offers a deeper upside potential. Set a stop loss on a close below $3,940 to manage risk effectively. 🌟
A break above $3,985 with strong volume could confirm this move, driven by safe-haven demand and USD dynamics. Watch economic data trends! 💡
📝 Trade Plan:
✅ Entry Zone: $3,963 – $3,985 (support area)
❌ Stop Loss: Daily close below $3,940
🎯 Targets:
TP1: $4,075 (initial resistance)
TP2: $4,100 (extended target)
Ready for this rally? Drop your thoughts below! 👇

XAUUSD BUY 4023On the 4-hour chart, XAUUSD is trading above the upward trend line, indicating a clear bullish trend. Currently, support around 4023 is worth watching. A pullback to this level could be considered as a buying opportunity. Above this level, watch for the 4100 mark, with resistance around 4150 expected upon a breakout.

gold h4 parallel channelgold price are going up in a parallel channel on h4 time frame since their first rate cut
gold now trading on psychological level $4000
upper and lower trend line of channel are big dynamic support and resistance level

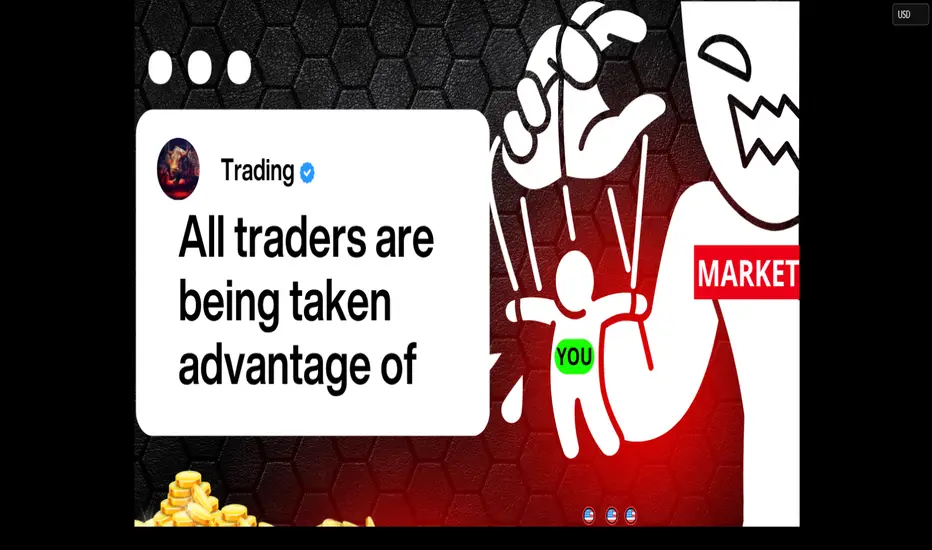
Who Is Really Controlling the Market?👋Hello everyone, it’s great to see you again in today’s conversation.
Today, we’ll dive into a very interesting topic: “❓Who is really controlling this market? Are you just a juicy prey, a pawn following the path laid out by the big institutions?”
To answer this question, we need to look deeper. The market in general, and XAUUSD specifically, is like an immense ocean with many currents flowing in different directions.
At the top of the chain, we see that trends are most influenced by economic factors, global political events, wars, and so on. Can you imagine how much influence central banks and large investment funds have? Their decisions can create massive waves, shaking the entire global financial market. You know why we only trade until Friday, right? Because most of these major institutions are closed on Saturdays and Sundays. For example, when the Fed decides to hike interest rates, or when big funds buy millions of ounces of gold, immediately, gold prices will either surge or plummet.
(To gain a better understanding of how it works, take a look at my previous post )
However, big institutions cannot always control the market as they wish. Surely, you've seen sudden reversals or significant price fluctuations within just one day. And this is where the role of you and other traders comes into play.
Let’s think about it. In today’s modern financial market, where information spreads at the speed of light, you – a retail trader – can influence significant price movements if you know how to seize the right moment and turn it into your profit.
Think about the times when you’ve seen gold prices spike due to certain news, like a Fed decision or a political crisis. That wasn’t the result of a big institution, but rather the market’s response. And when you and thousands of other traders act in the same direction, you’re creating waves – even if they’re small – but they are enough to shift the market's flow in the short term. The market is a psychological reaction, where emotions, expectations, and fear drive the actions of all participants.
Yet, we cannot deny that the influence of central banks and global market fluctuations is immense and overwhelming. At times, our actions may just be a reaction to FOMO , inadvertently turning ourselves into prey without realizing it. The only way out is to equip yourself with the knowledge and experience necessary to navigate the market. If not, from the moment you step into trading, you’re essentially a pawn being controlled.
The market is a vast ocean. Central banks and large investment funds are like islands within it, but each one of us is an essential part of that ocean. Even if you’re just a grain of salt, many grains of salt together make the ocean salty. We are all connected, no matter where we are or what platform we use. TradingView, for example, is one place where we can all link up.
Trust in your own value, take action, learn, and share your insights so that both the trading community and TradingView itself can continue to grow.
I wish you happy trading. Don’t forget to support me by liking this post!🚀
Gold - Just buy the all time high!🔱Gold ( TVC:GOLD ) will rally even higher:
🔎Analysis summary:
Gold remains totally bullish. And after the recent all time high breakout rally of about +15%, traders are willing to accept much higher prices. Following the significant long term rising channel formation, Gold will rally another +25% before we will see a retracement.
📝Levels to watch:
$4.000, $4.500
SwingTraderPhil
SwingTrading.Simplified. | Investing.Simplified. | #LONGTERMVISION

XAU/USD Technical Analysis — October 14, 2025Gold continues to trade within a clearly defined ascending channel, showing strong bullish momentum. Recent price action shows signs of short-term consolidation following a sharp rally, as market participants await further catalysts to define direction.
Rate Cut Expectations: Markets are pricing in potential Fed rate cuts in late 2025, which weakens USD and supports gold.
Geopolitical Tensions: Ongoing global uncertainties continue to fuel safe-haven flows.
Central Bank Demand: Persistent buying by global central banks provides structural support.
Technical Momentum: The ascending channel reinforces bullish structure, with higher lows and higher highs.
As long as XAU/USD holds above the consolidation zone and remains within the ascending channel, the bullish trend remains intact. A breakout above the immediate resistance near 4,160 could open the door to further upside toward 4,414 and possibly the October max target of 4,650.

THE KOG REPORT - UpdateEnd of day update from us here at KOG:
That didn't go to badly! We wanted price to attempt that low, give us the push up and although we had highlighted a little higher, the red box did not break and our hot spot gave a lovely RIP from the level. We then broke the 4030 level at the bias and completed all the bias level targets.
I would love to say we caught the top, but is this the top?
For now, we have support at the 3950 level and below that 3930. If we get a continuation downside, we will be looking below for a potential long, otherwise, upside into 3990 levels is important for the break. I would like to see more downside here at least to target the daily mean which is well overdue.
Price: 4039
RED BOXES:
Break above 4047 for 4050✅, 4055✅, 4061, 4075 and 4085 in extension of the move
Break below 4030 for 4020✅, 4010✅, 4006✅, 3997✅, 3980✅ and 3977✅ in extension of the move
As always, trade safe.
KOG

GOLDGold has tapped our target level 4020, now we will be looking for sells this week as long as Gold respects the top.
Disclosure: We are part of Trade Nation's Influencer program and receive a monthly fee for using their TradingView charts in our analysis.


GOLD (XAU/USD) – Buy Signal Alert💰 GOLD (XAU/USD) – Buy Signal Alert
📈 Buy Entry: 4202
🎯 Targets: 4225 – 4240 – 4253 (Final Target)
🛡️ Stop Loss: 4185 (Adjust based on your risk level)
Analysis:
Gold is showing renewed bullish momentum from the 4202 support zone. If buyers hold above this level, we expect an upward move toward the 4253 resistance area. Watch for volume confirmation and candle strength before entering the trade to ensure breakout validation.

XAUUSD M30 | Bullish riseGold (XAU/USD) is reacting off the buy entry at 4,000.37, which is a pullback support and could potentially rise from this level to the upside.
Stop loss is at 3,950.65, which is a multi-swing low support.
Take profit is at 4,056.76, which is a multi swing high resistance.
High Risk Investment Warning
Trading Forex/CFDs on margin carries a high level of risk and may not be suitable for all investors. Leverage can work against you.
Stratos Markets Limited (tradu.com ):
CFDs are complex instruments and come with a high risk of losing money rapidly due to leverage. 65% of retail investor accounts lose money when trading CFDs with this provider. You should consider whether you understand how CFDs work and whether you can afford to take the high risk of losing your money.
Stratos Europe Ltd (tradu.com ):
CFDs are complex instruments and come with a high risk of losing money rapidly due to leverage. 66% of retail investor accounts lose money when trading CFDs with this provider. You should consider whether you understand how CFDs work and whether you can afford to take the high risk of losing your money.
Stratos Global LLC (tradu.com ):
Losses can exceed deposits.
Please be advised that the information presented on TradingView is provided to Tradu (‘Company’, ‘we’) by a third-party provider (‘TFA Global Pte Ltd’). Please be reminded that you are solely responsible for the trading decisions on your account. There is a very high degree of risk involved in trading. Any information and/or content is intended entirely for research, educational and informational purposes only and does not constitute investment or consultation advice or investment strategy. The information is not tailored to the investment needs of any specific person and therefore does not involve a consideration of any of the investment objectives, financial situation or needs of any viewer that may receive it. Kindly also note that past performance is not a reliable indicator of future results. Actual results may differ materially from those anticipated in forward-looking or past performance statements. We assume no liability as to the accuracy or completeness of any of the information and/or content provided herein and the Company cannot be held responsible for any omission, mistake nor for any loss or damage including without limitation to any loss of profit which may arise from reliance on any information supplied by TFA Global Pte Ltd.
The speaker(s) is neither an employee, agent nor representative of Tradu and is therefore acting independently. The opinions given are their own, constitute general market commentary, and do not constitute the opinion or advice of Tradu or any form of personal or investment advice. Tradu neither endorses nor guarantees offerings of third-party speakers, nor is Tradu responsible for the content, veracity or opinions of third-party speakers, presenters or participants.

XAUUSD BUY - TARGET 4250Looking from the chart XAUUSD is on its way to new high. The chart is still continuing in a bullish trend, breaking out of the flag and hoping to reach its new high. I am targeting the 4250 range as take profit.

SELL GOLDIn todays session we are monitoring GOLD for selling ooportunity. Entry at 4200 stops above 4220 and target at 4130. Use proper risk management.

sell orderThere is a change of character in the trend, and price will react to tap the origin that cause the change of character and continue to the down side

XAUUSD analysis – 1H FVG and OB SetupsThe overall structure remains bullish, with price creating higher highs and higher lows.
Currently, we are in a retracement phase, and the two highlighted demand zones at 3968 and 3927 represent potential areas for continuation entries.
Our plan:
Wait for confirmation signals on lower timeframes (3M–15M) — such as BOS + OB + FVG alignment — before entering long positions.
The first zone (3968) aligns with a short-term OB that could trigger early buy reactions, while the second zone (3927) is a deeper liquidity sweep area with higher probability if price decides to extend its correction.
As long as price stays above 3927, the bullish narrative remains valid.
We’ll reassess only if that level breaks cleanly with strong bearish displacement.
📊 ProfitaminFX | Gold, BTC & EUR/USD
📚 Daily setups & educational trades

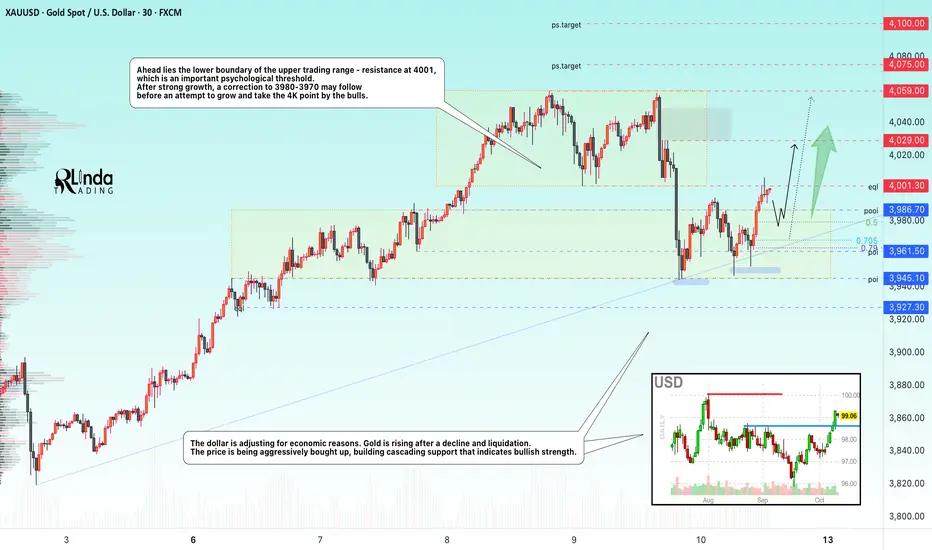
GOLD → Retest 4000. Pullback before a breakout and rise to 4100?FX:XAUUSD , after a sharp sell-off and testing of the 3950 support zone, is aiming to return to the $4000 level on Friday, preparing for its eighth consecutive week in positive territory.
The Senate adjourned for the weekend until Tuesday, postponing a decision on the shutdown. John Williams supported further rate cuts, Mary Daly confirmed her readiness for cuts, despite the fact that Powell did not say anything particularly interesting about policy on Thursday.
The upward trend in gold remains unchanged. The potential for growth to new highs remains, provided the shutdown continues and the Fed maintains its soft policy. The $4000 level remains a key psychological support.
Resistance levels: 4000, 4059, 4075
Support levels: 3986, 3980, 3968
The 4000 zone may prove to be strong resistance, so expect a battle (consolidation or trading range in this zone), during which the price may form a pullback to 3980-3970 before returning to 4K for a breakout attempt.
Best regards, R. Linda!
XAU/USD | Gold Recovers After Sharp Selloff (READ THE CAPTION)By analyzing the Gold (XAUUSD) chart on the 30-minute timeframe, we can see that yesterday, following the announcement of peace between Hamas and Israel, gold experienced a sharp drop — falling from $4029 to $3943, which means a decline of over 850 pips (and about 1140 pips from the $4058 level!).
After reaching the demand zone between $3941 and $3951, buyers stepped in, pushing the price back up to around $4022. Following this strong rebound, gold has started a short-term correction back toward the $4000 level.
Now, the key question is whether the price can hold above $3994 — if it does, we could see another bullish move.
The next upside targets are $4006, $4016, and $4028.
Please support me with your likes and comments to motivate me to share more analysis with you and share your opinion about the possible trend of this chart with me !
Best Regards , Arman Shaban

Gold → How to operate at nightToday, we highlighted the risks in gold’s upward movement. We also guided everyone to enter short positions on gold at high levels based on the intraday trend, and all these positions yielded solid profits. Currently, gold is trading within the 4,090–4,180 range. It has tested the lower end twice but failed to break below the 4,090 support level—this indicates strong buying interest (support) at lower prices, and the sharp drop during the Asian session was likely just profit-taking by funds that entered at high levels.
Keep an eye on Fed Chair Powell’s speech in 10 minutes. As mentioned earlier, if Powell echoes the current rhetoric in favor of rate cuts, the bullish momentum will continue, and gold will keep hitting new highs. Conversely, if Powell expresses further resistance to rate cuts—causing market expectations for a Fed rate cut to plummet—gold will test the 4,090 support again. A break below this level may trigger a wave of profit-taking sell-offs, and gold’s bull market will come to a complete end.
Trading Strategy
Enter a light short position on gold around the 4,180 level, with a 3-point stop-loss. PS: Stop-losses are a must for news-driven markets; without them, you could easily get trapped if the price breaks out sharply. On the downside, focus on the 4,090 support. If this level is broken, continue to enter short positions on any rebound.
For specific trading decisions, please follow my real-time updates. I post my trading ideas and strategies daily. If you lack a plan or clear direction for gold trading and struggle to achieve consistent, stable profits, you can refer to and follow my updates as a reference and guide to help you avoid mistakes.
Gold: Scaling Back at 4090 - Awaiting Key Dip-Buying EntryFederal Reserve Chair Powell is scheduled to speak at 16:20 GMT on Wednesday, addressing the National Association for Business Economics on the Economic Outlook and Monetary Policy.
This speech comes at a time of heightened global market volatility, driven by renewed trade tensions and sharp corrections in digital asset markets. Powell’s remarks may shape expectations around the pace of rate cuts and broader monetary policy, influencing whether the current downward trend in crypto deepens or stabilizes.
Gold pushed to extreme highs during the Asian and European sessions, reinforcing our stance: it’s wise to remain bullish but avoid chasing the rally. Instead, wait for pullbacks to establish long positions.
With the retracement we’re now observing, the timing to enter long positions appears opportune.
4090 serves as the key intraday support and trend-defending level
4060 acts as the broader swing bullish/bearish divider
After a day of observation, we can now align with the overall uptrend by using these two levels as references.
Execute repeated long positions near 4090, with an initial target of 10–15 points for partial closing. Let remaining positions run toward further highs.
This approach allows you to build long exposure from a solid base — avoiding the risk of buying at extreme highs or getting whipsawed in volatile intermediate price zones.
🟡 Trading Strategy
Enter long on dips toward 4090
Add on retests near 4060 if reached
Partial take profit at +10/15 points
Let runners advance toward new highs
Gold 30Min Bearish Detected ( 4030 Reversal )Gold 30Min Bearish Detected ( 4030 Reversal )
👌 Bearish Reversal - 4033 SCENARIO:
➕ Price rejected upper cluster zone sharply
➕ POC flipped into resistance with heavy delta pressure
➕ Liquidity taken above prior highs
➕ Volume decreasing on push-up (distribution signs)
➕ Session structure favoring downside continuation
➕ Sell limit positioned near upper cluster edge – waiting for confirmation wick or retest.
The logic remains the same: Volume + POC + Delta Control = Precision Entry.
XAUUSD Bullish Retest: Continuation Swing Buy OpportunityGold continues to trade in a bullish structure, forming higher highs after a clean rebound from the support zone. A short-term pullback provides a potential swing buy opportunity targeting higher resistance levels as buyers remain active above intraday support.
Key Levels:
Buy Entry: 3970
Take Profit: 4000
Stop Loss: 3950
Reasoning:
Technically: Price action shows a sustained uptrend, supported by rising structure and consistent bullish candles. The 1H chart confirms momentum continuation after successfully retesting previous resistance turned support (a classic technical principle). The current consolidation above 3950 indicates accumulation before the next expected upward move.
Fundamentally : The underlying factors continue to support Gold. Weaker U.S. dollar sentiment and stable Treasury yields enhance Gold's appeal as a safe-haven asset. This demand is expected to sustain the uptrend as investors look for safety ahead of key U.S. data releases.
Disclaimer:
This analysis is for educational purposes only and not financial advice. Always manage risk and follow your own trading plan before executing any trade. Like this means it's demo for you understanding.

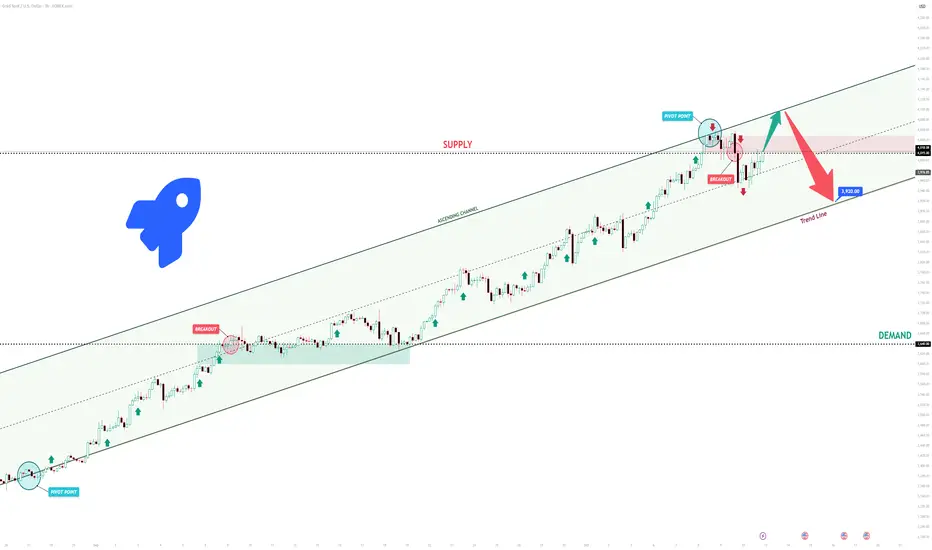
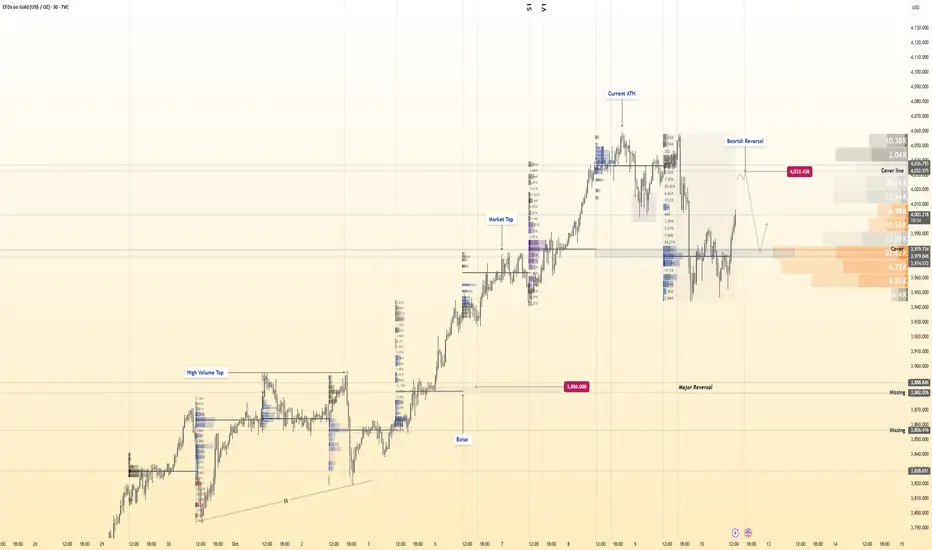
XAUUSD Short: Correction to 3920 Expected from the HighsHello, traders! The price auction for XAUUSD has been dominated by a strong bullish trend, which has been clearly defined by a large ascending channel. The market has consistently made higher highs and higher lows, breaking through key resistance levels like 3640 and showing that the buyer initiative has been in firm control of the trend.
Currently, the auction has reached a major point of contention at the 4015 supply level. The price is consolidating here, right below the upper resistance line of the ascending channel, after a failed initial attempt to break higher. This area represents a significant test for the continuation of the uptrend.
My scenario for the development of events is a 'blow-off top' followed by a correction. I believe the price will make one final push, breaking the 4015 level to touch the channel's upper resistance line. In my opinion, this move will be exhaustive, and a sharp reversal will occur from that line. The take-profit is therefore set at 3920, targeting a retest of the nearby trend line. Manage your risk!