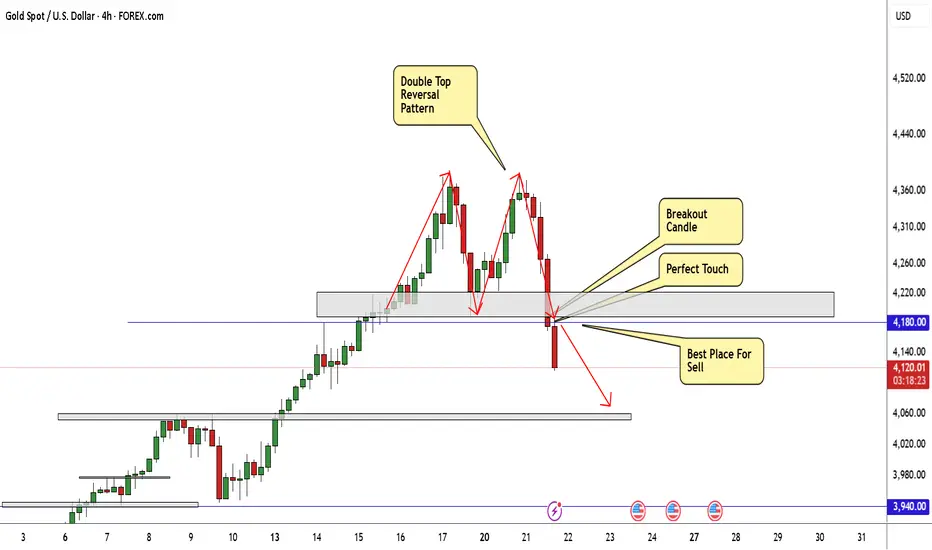
GOLD Finally Made Reversal Pattern , Short Setup To Get 400 PipsHere is my 4H Chart On GOLD , And finally the chart made a reversal pattern The price creating a very clear reversal pattern ( double top) and the price made a very good bearish price action now from good res area so we can enter a sell trade after the price back to retest the neckline to can use a small stop loss and targeting 200 to 400 pips , this is a good bearish movement after this massive movement to upside without any correction , so we will sell this pair for the next weeks .
Trade ideas
GOLD Bearish Bias!
HI,Traders !
#GOLD made a bearish
Breakout of the key
Horizontal level of 4189.93
Which is now a resistance
AndAfter retesting that area we
will be expecting
A further move down !
Comment and subscribe to help us grow !

Risk-Off Sentiment Strengthens, Gold Holds Bullish StructureHello everyone,
Rising US–China tensions are fuelling market volatility, as both sides continue imposing retaliatory tariffs and export restrictions. This escalation has shaken global equities and driven investors back to safe-haven assets like gold. Remarks from Fed Chair Jerome Powell at NABE further boosted expectations for monetary easing, as he hinted at two rate cuts of 25 basis points each within the year. The prospect of lower rates reduces the opportunity cost of holding gold, reinforcing its bullish momentum.
During the previous session, gold spiked sharply from 4,090 to 4,180 before slight profit-taking brought it down to around 4,161 — yet it still closed higher than the day before, confirming buyer dominance.
On the 1H chart, the uptrend structure remains intact and orderly. Each bullish impulse creates a Fair Value Gap (FVG) that’s later partially filled — a typical pattern of a strong trending market.
Overall, the macro narrative continues to favour a “risk-off” sentiment, aligning with the prevailing bullish structure. A modest pullback to the 4,150–4,158 zone could offer an opportunity for momentum to rebuild toward 4,185–4,190, and if this resistance breaks, a move toward 4,200–4,220 could quickly follow.

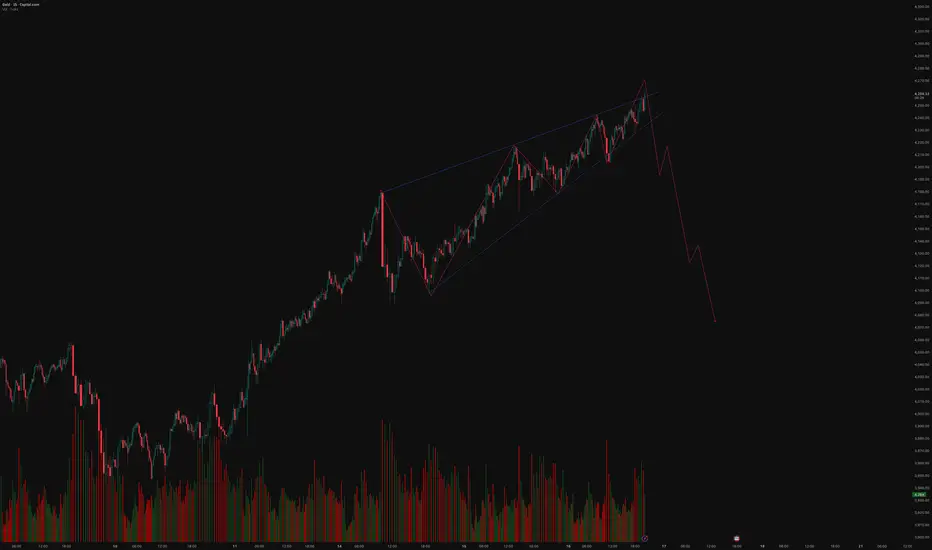
Technical Analysis – Rising Wedge Breakdown ProbabilityAnalysis
Pattern: A rising wedge has formed with converging trendlines — higher highs and higher lows narrowing into the apex.
Volume: Noticeable volume contraction during the formation, which often precedes a breakdown.
Current Position: Price appears to have made an upward breakout attempt, which may turn out to be a false breakout, a common precursor to a sharp downside move.
Projection: Once the lower trendline breaks decisively, a fast and impulsive decline toward lower support zones is probable — as shown by the projected path in red.
Summary
The structure suggests bearish momentum building up beneath the surface, with the recent false breakout likely to trap late buyers.
If confirmed with a close below the wedge support, this pattern could trigger a strong downside wave, potentially retracing the entire wedge formation.
Disclaimer
This analysis is for educational and technical discussion purposes only.
It does not constitute investment advice or a trading recommendation.
Please conduct your own research or consult a certified financial advisor before taking any trading positions.
XAUUSD Long: Price continues to trade inside ascending channelHello, traders! I want share with you my opinion about XAUUSD. On the 2H timeframe, gold continues to trade inside an ascending channel, showing a steady bullish structure after the recent breakout and minor pullback.
Currently, the price corrected to the Demand Zone (around $4,200), which also aligns with the lower boundary of the ascending channel. This confluence created a strong support area, from which price has already shown signs of recovery.
My scenario is a continuation of the bullish movement. I expect the price can continue grow and reach $4,340. Manage your risk!

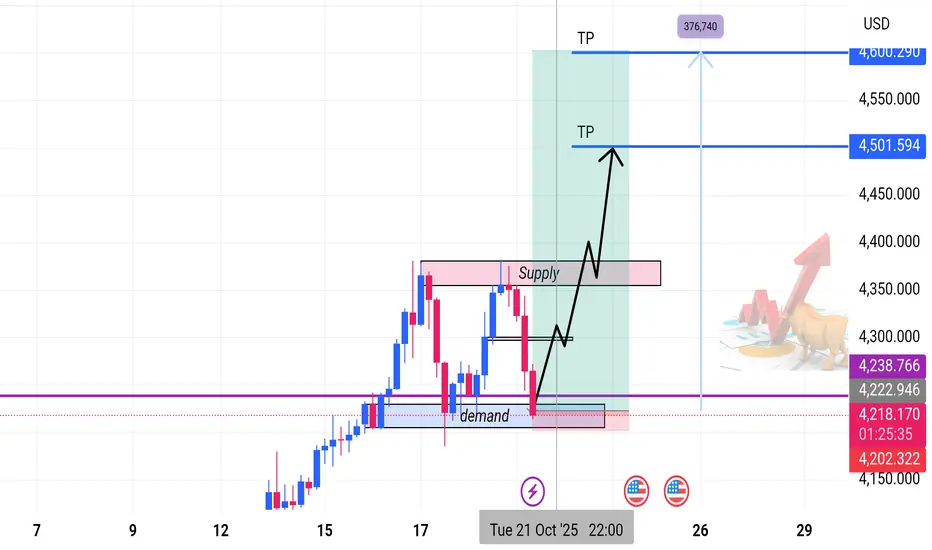
Bullish Continuation from Demand Zone | 4H SetupOverview:
Gold is maintaining a strong bullish structure on the 4-hour timeframe, forming consistent higher highs and higher lows.
Recently, price tapped into a key Demand Zone, showing a clear rejection and early signs of buyer re-entry — signaling a potential continuation of the uptrend.
Technical Outlook
• Trend: Bullish market structure intact.
• Current Price: ~4,230.34
• Demand Zone (Buy Zone): Price has bounced from a major demand area — indicating renewed buying pressure.
• Reversal Confirmation: Rejection wicks and bullish candles confirm demand reaction.
• Supply Zone (Resistance): Overhead supply remains the key obstacle. A break and close above it could trigger a strong rally toward the next resistance.
Trade Setup
Parameter Level (Approx.) Description
Entry (Buy Zone) 4,230.34 Reaction from demand zone
Take Profit 1 (TP1) 4,501.59 Conservative target
Take Profit 2 (TP2) 4,576.74 Extended target
Stop Loss (SL) ~4,200.00 Below demand zone
Market Outlook
As long as the demand zone holds, the bullish structure remains valid.
A confirmed break above the supply zone could invite strong momentum toward higher targets.
Failure to hold the demand base may trigger a corrective move lower — hence, risk management remains crucial.
Bias: 🟢 Bullish
Timeframe: 4H
Strategy: Supply & Demand | Market Structure | Price Action
Gold Long PredictionArpad Nadassy gold long prediction
I predict a large pullback to the daily demand at around 3000 and that will be our perfect chance to go lond again.

XAUUSD: As you were! Liquidity sweep at 4204, which then continued into internal range liquidity in the form of the waiting daily FVG. Currently holding support with a higher low made 4215. If price can hold this short-term lower high, I expect gold to gradually return to previous highs and reach for external liquidity.
- Bullish if price holds 4215 level.

GOLD → Ready for continued growth. Target 4100 - 4125FX:XAUUSD remains above $4,000, starting the week with a record high amid the escalating trade war between the US and China. Traders bought up all of last week's decline.
Key drivers: Trump's new tariffs: Introduction of 100% tariffs on all Chinese goods and export controls on software from November 1. China is not sitting idly by: Restrictions on exports of rare earth metals and technologies.
The ongoing shutdown and trade uncertainty are weakening the dollar.
US inflation data (CPI on October 24) will be the first key release after the shutdown.
Speeches by Fed officials may adjust rate expectations.
Gold remains in an uptrend, but momentum will depend on the progress of trade negotiations. A breakout to new highs is likely if tensions remain high.
Resistance levels: 4078, 4100, 4110
Support levels: 4059
A breakout of 4078 and a close above the key level could trigger a continuation of the growth to 4100. An additional scenario could be a correction to 4059 before further growth to 4100-4125.
Best regards, R. Linda!

GOLD M30 | Bullish Reversal in ProgressThe price is reacting off the buy entry at 4,266.82, which is a pullback support that lines up with the 61.8% Fibonacci retracement and could rise from this level to the take profit.
Stop loss is at 4,223.78, whichis a pullback support that lines up with the 78.6% Fibonacci retracement.
Take profit is at 4,323.15, whichis a pullback resistance that is slightly below the 61.8% Fibonacci retracement.
High Risk Investment Warning
Trading Forex/CFDs on margin carries a high level of risk and may not be suitable for all investors. Leverage can work against you.
Stratos Markets Limited (tradu.com ):
CFDs are complex instruments and come with a high risk of losing money rapidly due to leverage. 65% of retail investor accounts lose money when trading CFDs with this provider. You should consider whether you understand how CFDs work and whether you can afford to take the high risk of losing your money.
Stratos Europe Ltd (tradu.com ):
CFDs are complex instruments and come with a high risk of losing money rapidly due to leverage. 66% of retail investor accounts lose money when trading CFDs with this provider. You should consider whether you understand how CFDs work and whether you can afford to take the high risk of losing your money.
Stratos Global LLC (tradu.com ):
Losses can exceed deposits.
Please be advised that the information presented on TradingView is provided to Tradu (‘Company’, ‘we’) by a third-party provider (‘TFA Global Pte Ltd’). Please be reminded that you are solely responsible for the trading decisions on your account. There is a very high degree of risk involved in trading. Any information and/or content is intended entirely for research, educational and informational purposes only and does not constitute investment or consultation advice or investment strategy. The information is not tailored to the investment needs of any specific person and therefore does not involve a consideration of any of the investment objectives, financial situation or needs of any viewer that may receive it. Kindly also note that past performance is not a reliable indicator of future results. Actual results may differ materially from those anticipated in forward-looking or past performance statements. We assume no liability as to the accuracy or completeness of any of the information and/or content provided herein and the Company cannot be held responsible for any omission, mistake nor for any loss or damage including without limitation to any loss of profit which may arise from reliance on any information supplied by TFA Global Pte Ltd.
The speaker(s) is neither an employee, agent nor representative of Tradu and is therefore acting independently. The opinions given are their own, constitute general market commentary, and do not constitute the opinion or advice of Tradu or any form of personal or investment advice. Tradu neither endorses nor guarantees offerings of third-party speakers, nor is Tradu responsible for the content, veracity or opinions of third-party speakers, presenters or participants.

XAUUSDGold shows a bearish setup forming under a descending trendline. Price has approached a supply zone near 4,289 USD, aligning with trendline resistance, suggesting potential rejection. The chart indicates a short (sell) position targeting the demand zone around 4,166 USD, with a stop loss placed above the resistance near 4,318 USD. The analysis implies a possible lower high formation and continuation of the downtrend toward previous support levels.
"Thank you for your support! If you found this idea valuable or learned something new, please consider liking and leaving a comment. I’d really appreciate hearing your feedback and thoughts."

GAMMA SQUEEZE: Why Gold Prices will hit 5 000 + USDBottom line
If 1% of Treasuries ($278B) rotates into gold, $5,000/oz is not only plausible—it sits inside the low end of what flow math + today’s market microstructure can deliver. The path (and whether we print $8k+ spikes) hinges on how much of that flow shows up as short-dated calls—because that is what turns steady demand into a self-feeding gamma loop.
________________________________________
Executive summary
• A 1% rotation out of U.S. Treasuries is roughly $278B of new gold demand (using SIFMA’s latest estimate that Treasuries outstanding ≈ $27.8T).
• At today’s context (gold ~$3.53k/oz on Sep 2–5, 2025), $278B buys ~79.4M oz ≈ 2,471 tonnes; at $5k/oz it buys ~55.6M oz ≈ 1,729 tonnes. For scale, annual mine supply ≈ 3,661 t and total above-ground stocks ≈ 216,265 t (bars/coins+ETFs ≈ 48,634 t).
• That flow is huge relative to both quarterly demand value (Q2’25 ≈ $132B) and typical daily trading turnover (~$290B/day across OTC, futures & ETFs). Even spread out, it materially tilts the tape; if concentrated and routed via options, it can produce dealer hedging feedback—i.e., a gamma squeeze.
• Price targets (framework, not prophecy):
o Conservative flow-only: +40–60% → $4,900–$5,600/oz
o Base case (flow + some options reflexivity): +70–110% → $6,000–$7,500/oz
o Squeeze/overshoot window (short-dated calls heavy): episodic spikes >$8,000/oz possible, but hard to sustain without continued flow.
These bands come from scaling prior ETF-driven episodes (notably ~877 t ETF inflow in 2020 alongside a ~+36% price run) and sizing against current market depth, while layering a realistic options-hedging multiplier (details below).
________________________________________
1) What a “gamma squeeze” in gold means (and why it can happen)
Definition (in one line): When call buying concentrates near-dated, near-the-money strikes, dealers short gamma must buy futures as price rises (and sell if it falls) to keep neutral—this feedback accelerates upside (“gamma squeeze”).
Why it’s plausible in gold right now:
• The listed derivatives stack is large. As of Fri, Sep 5, 2025, CME’s daily bulletin shows COMEX gold options open interest ~0.80M contracts (calls ~0.49–0.69M; puts ~0.30–0.38M depending on line item), each on 100 oz—i.e., option OI notionally ties to ~2,400–2,800 t of gold. That is the powder keg a call-wave can act on.
• Implied vol is moderate (GVZ ~18 for 30-day GLD options), so vega is “affordable,” gamma is punchy in the front end.
• CME’s CVOL framework and open-interest tools confirm where strikes/expiries cluster; when OI stacks close to spot and near expiry, market-wide gamma becomes most sensitive.
Back-of-envelope hedging math (illustrative):
For a 30-day, at-the-money option with σ≈18%, the Black-Scholes gamma is about
Γ≈ϕ(0)SσT≈0.399S⋅0.18⋅30/365\Gamma \approx \frac{\phi(0)}{S\sigma\sqrt{T}} \approx \frac{0.399}{S\cdot 0.18 \cdot \sqrt{30/365}}.
At S=$3,500/oz, that’s ~0.0022 per $. A +1% move (+$35) bumps delta by ~0.077 per option. If just 150k near-ATM front-tenor calls are held by customers (dealers short gamma), hedge buying ≈ 150,000 × 100 oz × 0.077 ≈ 1.16M oz ≈ 36 t—per 1% price pop. That’s only a slice of total OI; a broader crowding raises this number. Compare with ~2,500 t/day of global turnover and you can see how concentrated dealer hedging can move price intraday.
________________________________________
2) Sizing a 1% Treasury → gold rotation
Treasury base: latest SIFMA comment put U.S. Treasuries outstanding ≈ $27.8T (Q1’25). 1% → $278B.
Gold the rotation would buy:
• At $3,500/oz: $278B → ~79.4M oz → ~2,471 t
• At $5,000/oz: $278B → ~55.6M oz → ~1,729 t
For scale:
• Annual mine supply (2024): ~3,661 t; total supply (incl. recycling): ~4,974 t. A $278B buy ticket equals 47–67% of a year’s mine output (depending on price), or ~35–50% of total annual supply.
• ETF precedent: In 2020, ~877 t net ETF inflow (~$48B) coincided with a ~+36% move from Jan→Aug 2020. Today’s $278B is ~5–6× that dollar size (and ~2–3× the tonnes, depending on price), hinting at large flow-driven upside even before any options reflexivity.
• Turnover lens: WGC puts average daily trading across OTC/futures/ETFs at roughly $290B/day recently. A $278B program is ~one day’s global turnover. Pushed quickly (or skewed to options), that’s impactful; stretched over months, the price impact softens but still accumulates.
Futures-only lens (capacity check):
At $3,500/oz, one COMEX GC contract notionally = $350k (100 oz). $278B equals ~794k GC contracts. Current futures OI is ~0.49M contracts, so this exceeds all COMEX OI—you cannot push that much via futures quickly without major repricing. Even at $5,000/oz (~$500k/contract), it’s ~556k contracts, still comparable to the entire OI.
________________________________________
3) Price-target framework (with the math that gets you there)
Think of the price in layers: (A) base flow impact + (B) options-gamma reflexivity + (C) second-round effects (short-covering, momentum, FX, central banks).
A) Flow-only impact (calibrated to 2020)
• 2020 anchor: 877 t ETF inflow ↔ ~+36% price. Using a simple proportionality, 1,729–2,471 t (your $278B) maps to ~+71% to +101%.
• Apply to spot ≈ $3,532/oz (early Sep 2025):
o +71% → ~$6,050/oz
o +101% → ~$7,100/oz
Caveat: 2020 had unique macro tailwinds, so I treat this as upper-middle of base range.
B) Options reflexivity / gamma squeeze overlay
If 20–30% of the $278B rotation expresses via short-dated calls (common for levered macro expressions), dealer hedging can amplify flow impact:
• From the OI math earlier, a mere 1% up-move can demand ~20–40 t of dealer hedge buying if near-ATM OI is thick. A 3–5% multi-day grind can easily cascade into 100–200 t of incremental buying from hedgers alone. That’s non-trivial vs. mine supply pace, and it pulls forward upside.
• Result: add another +10–20% to the flow-only levels during a squeeze while it lasts.
C) Second-round effects
• Central banks: still persistent net buyers (>1,000 t/yr pace in recent years), tending to fade dips rather than rallies—a structural bid.
• FX & rates: the GVZ ~18 regime means bursts of vol aren’t “expensive”; a weakening USD or policy shocks can tilt the target higher.
Putting it together—scenario bands
Scenario Assumptions Implied move Target
Conservative $278B spread over 6–9 months, mostly physical/ETFs; limited options +40–60% $4,900–$5,600
Base case 50–70% to physical/ETFs, 30–50% to futures/options; moderate dealer short-gamma +70–110% $6,000–$7,500
Squeeze / overshoot Short-dated call concentration, dealers persistently short gamma; flow bunches in weeks +120–>150% (episodic) >$8,000 (brief spikes)
$5,000 target is well within the conservative band if any meaningful fraction of the $278B pushes through quickly, even without a full-blown gamma loop.
________________________________________
4) Why the market could mechanically gap higher
• Market size vs. flow: Q2’25 total demand value = $132B. Dropping $278B into this ecosystem is a 2× quarterly shock.
• Trading capacity: $278B ≈ one full day of global turnover; price impact is convex when the risk-absorption (dealers, miners, recyclers) cannot scale linearly day-by-day.
• Derivatives gearing: With ~0.8M options contracts OI outstanding and futures OI ~0.49M, even a partial shift into calls forces hedge-buys on the way up, the hallmark of a squeeze.
________________________________________
5) Key risks / reality checks
• Time profile of the rotation matters. A slow, programmatic shift spreads impact; a front-loaded move can overshoot then mean-revert as gamma decays.
• Elasticity is asymmetric. Jewelry/fabrication falls at high prices (demand destruction), recycling rises, both cushioning extremes. That moderates how long >$7k can persist without continued flow.
• Volatility regimes change. If GVZ spikes to high-20s/30s, option premia jump, slowing new call demand; conversely, put demand can flip net gamma long for dealers, dampening squeezes.
________________________________________
References (most load-bearing)
• Treasury base: SIFMA—Treasuries outstanding $27.8T (Feb 2025).
• Gold supply & stocks: WGC—Above-ground stock 216,265 t (end-2024); bars/coins+ETFs 48,634 t; mine supply 2024 ≈ 3,661 t.
• Trading turnover: WGC—gold trading ≈ $290B/day.
• ETF precedent: WGC—2020 ETF inflows 877 t (~$47.9B) alongside major price rise.
• Current price context: Reuters—record highs $3,532/oz set in early Sep 2025. (
• Options/hedging plumbing: CME daily bulletin (Sep 5, 2025) showing gold options OI ~0.8M contracts; CME CVOL/tools; Cboe GVZ ~18 as 30-day IV.
________________________________________

my idea for short position on xauusd.Hi, There is my idea for short position on xauusd.
Entry: sell zon
Stop: red line

When will gold continue to rise? 4300?⭐️GOLDEN INFORMATION:
Gold (XAU/USD) advances toward $4,210 during Thursday’s Asian session, hovering near a fresh record high as Fed rate-cut expectations and renewed trade tensions lift safe-haven demand. Traders now await comments from Fed officials, including Michael Barr, Stephen Miran, Christopher Waller, and Michelle Bowman, for policy cues. Earlier this week, Fed Chair Jerome Powell warned that slowing job growth poses a risk to the US economy, reinforcing prospects for two more rate cuts this year—supportive of the non-yielding yellow metal.
⭐️Personal comments NOVA:
The buying power shows no signs of stopping, breaking 4217 and continuing to increase in price. The whole market is very excited and focusing on investing in gold as the safest asset.
⭐️SET UP GOLD PRICE:
🔥SELL GOLD zone: 4275 - 4277 SL 4282
TP1: $4265
TP2: $4250
TP3: $4240
🔥BUY GOLD zone: $4154-$4152 SL $4147
TP1: $4165
TP2: $4180
TP3: $4190
⭐️Technical analysis:
Based on technical indicators EMA 34, EMA89 and support resistance areas to set up a reasonable BUY order.
⭐️NOTE:
Note: Nova wishes traders to manage their capital well
- take the number of lots that match your capital
- Takeprofit equal to 4-6% of capital account
- Stoplose equal to 2-3% of capital account

XAU/USD: Consolidating Above Breakout Zone with Bullish MomentumXAU/USD maintains its bullish structure inside the ascending channel, forming a new A-B-C pattern following a clean breakout above the compression zone. Price is currently consolidating above the 4200 level, establishing a potential base for the next impulsive leg.
A sustained move above 4200 could open the way for a rally toward 4290, retesting the resistance zone. With higher highs and channel integrity in place, momentum remains strong, supporting the continuation of the broader uptrend.

Gold Performance Recap for the week📝This week, the price of Gold first rose and then fell. The specific trend is as follows:
Monday: Gold broke through the 4059 mark in the Asian trading session, setting a new historical record
Tuesday- Wednesday: The price continued to rise.
Thursday: Gold reached a maximum of 4298.64.
Friday: First, the price surged after the opening, reaching a high of 4379.44, followed by a sharp decline, touching a low of 4186.17. As of now, the price of Gold is 4247.02, continuing to fall compared to the previous day's closing price.
💎The driving factors are as follows:
💡Upward factors in the early stage
1-Impact of Federal Reserve's loose policy expectations: The Federal Reserve launched a new round of interest - rate - cutting cycle in September. The market anticipates that there may be two consecutive interest - rate cuts in October and December. The expected decline in both nominal and real interest rates has increased the attractiveness of holding non - interest - bearing assets such as gold.
2-Surge in geopolitical risks and safe - haven demand: Factors such as the escalation of the China-US trade war and the US's containment of China's chip sector have intensified market panic, and funds have accelerated their inflow into gold as a safe haven.
3-Drive from global central banks’ gold purchase demand: According to data from the World Gold Council, global central banks’ gold reserves increased by 166 tons in the second quarter of 2025. The People’s Bank of China has increased its gold holdings for 11 consecutive months, which has strengthened market confidence in gold.
💡Downward factors in the later stage:
1-Technical level: The 4280 - 4330 area is a key monthly - level resistance zone. On Friday, Gold broke through the important support level of 4280, triggering a large number of stop-loss orders for long positions. Program based trading triggered SL selling, forming a vicious cycle of "breakdown - SL - further decline".
2-Change in risk appetite: On Friday, US President Trump made moderate remarks on trade issues. Market safe-haven sentiment cooled rapidly, leading to a sharp sell-off of gold.

Gold last push up? 18/Oct/25XAUUSD will its recently scary exciting 1500++ (pips/meter) roller coaster ride end soon? Probably is the beginning?! That Roller Coaster just moving into standby position at 4125 "meter" height before climbing slowly to the Height of 4430 And finally "rolling down"!!??

THE KOG REPORT - UpdateEnd of day update from us here at KOG:
Although we got a bit of a stretch early session, we managed to get the low and bar the wick we weren't too far off the anticipated movement. Today however, very aggressive on Gold! We had a few decent setups and one extremely clean move that we're in now aiming for a little higher, protected and managed.
We're now above the bias level 4147 with the first two target levels completed but we want to see how we close the daily today. Support here stands at 4140 while resistance at extension level is 4185. We'll stick with the potential path but will say, caution on longs at the moment! They will want more longs up here and if there is a turn, it will be sudden and leave you stuck above.
As always, trade safe.
KOG

Watch for opportunities around 4218-4220!
Technically, the daily K-line chart shows a stair-step upward trend, with rising lows and rising highs. As long as this rhythm is maintained, the overall trend is bullish, with a northbound trendline. The medium-term bull-bear watershed is 4145. Above this level, the bullish trend remains unchanged, focusing on the swing and mid-line. As the market moves upward, we should actively support the rise above the short-term watershed of 4200. If this level is broken, the price will likely continue to fall southward in the short term. If 4200 is broken, the lows of 4180-60 will likely be retested. From a spatial perspective, if a retracement retests these two levels, the short-term trend is basically confirmed. A rebound below 4200 will support a short-term decline until 4145! Regarding the potential for gains in the Asian session, 4218 was broken, initially retracing back to 10 points before bottoming out and rebounding to a new high of 4235. Looking at the potential, a pullback to 4218-4220 would be the initial uptrend. A second opportunity would be to watch for 4205-4203.
Thus, overall, a short-term buy signal on a rebound is recommended (watch for pressure signals at 4200 for a continued short-term decline). Long positions above 4218-4220 represent the initial uptrend. A second opportunity would be to watch for 4205-4203. For upward shorting opportunities, watch for 4248-4250, with a 10-15 point pullback. Today's Asian session target of 4215-4217 is rapidly approaching, with a target of 40. My strength is undeniable!

It's time for gold to take a break. It's "Time"e for gold to take a break. It won't be easy for gold to break through 4296.

Has the gold price peaked? Not yet! Buy on dips to 4500Good afternoon, bros. On Friday, the gold market experienced a rare sharp intraday fluctuation. Many traders who blindly chased rising and falling prices suffered heavy losses that day. However, I believe that those who followed Allen's trading rhythm and executed order transactions throughout the process will all reap great rewards.
As for Friday's market, although there has been a significant correction, we cannot blindly believe that gold has peaked in the short term. After all, the fundamentals do not present conditions conducive to a sharp drop in gold prices. The worsening geopolitical situation over the weekend, coupled with the ongoing US government shutdown and trade tensions, as well as expectations that the Federal Reserve will support two interest rate cuts this year, are all providing some support for the gold market. Therefore, the medium- and long-term bullish pattern has not been effectively changed, and the short-term pullback can be regarded as a technical correction.
Combining the hourly and 4H charts, gold retreated to a low of around 4186 on Friday night and then rebounded again, indicating that there is still strong support from below in the short term and the market bulls still have a certain rebound potential. On Monday, we need to pay attention to the short-term resistance range of 4280-4300 above. If it cannot be broken through directly and effectively, gold may maintain a wide range of fluctuations after the opening, and then return to the bull market rhythm after digesting the short-term selling pressure. The support below can still continue to focus on 4200-4180. As long as this support range is not broken, our bullish attitude remains unchanged. If it falls back to the support range first, we can still consider arranging long orders in batches with light positions.
For more real-time signals, please follow my updates. Thank you for your likes and support. Thank you to all users who read my strategy!
OANDA:XAUUSD

Gold Key Levels (4000-4400$)These are the Gold key levels which I’ll be using for trading.
Here’s how I trade these levels:
- Close above a level → Buy setup
When a candle closes clearly above a level, it confirms bullish momentum and I look to enter long immediately after the close.
- Close below a level → Sell setup
A confirmed candle close below support signals bearish strength, and I enter short right after the close.
- Rejection from a level → Opposite trade
If price shows a strong rejection from a level, I trade in the opposite direction - rejection from resistance = sell setup, rejection from support = buy setup.
These levels works well for both day trading (using 1H candles) and scalping (using 15M or lower timeframes). It keeps trading simple, just reactions to market behaviour.

XAUUSD(GOLD): +1000 Pips Possible Sell Setup! Comment Your ViewsDear Traders,
We may see sell dropping to 4000$ region or further down as we think price has reached the exhaustion point; it is likely that price drop rapidly and move up sharply. If you like the idea then comment and like.
Good luck
Team Setupsfx_
