XAUUSD Case Study | Head & Shoulders to Inverted RecoveryDate: 18th October 2025
By: Yogiraj Trading Academy 🌕
🧭 Market Overview
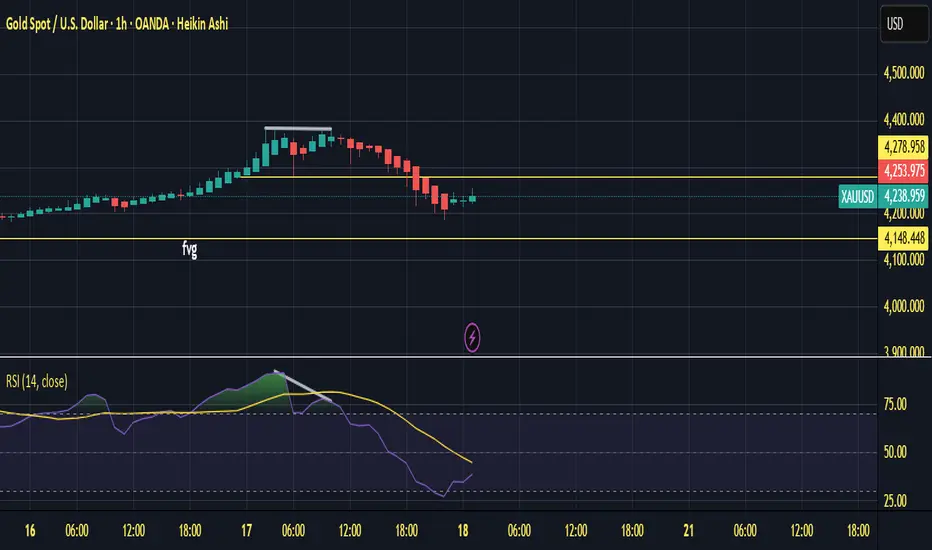
In the recent price action of XAUUSD (Gold Spot), the market formed a perfect Head & Shoulders pattern on the top, leading to a breakdown and a strong correction phase. The move validated our earlier resistance zones and respected every marked level with precision — a clear reflection of technical structure working in harmony with psychology.
⚔️ Phase 1 – Distribution (Head & Shoulders Breakdown)
The Head & Shoulders pattern signaled exhaustion near the 4,321–4,380 zone, followed by a decisive neckline break confirming the bearish structure. Once the neckline was breached, the market continued to slide downward with clean momentum, fulfilling the measured move target zones.
🌅 Phase 2 – Accumulation (Inverted Head & Shoulders)
Post the sharp decline, the market found strong buying interest near 4,185–4,200, forming an Inverted Head & Shoulders pattern — a mirror image of the previous top structure. This hinted at potential trend reversal or continuation of the larger bullish trend once confirmation levels are reclaimed.
📈 Key Levels to Watch
Breakout Zone: 4,323 & 4,380
→ Sustained breakout above these levels will confirm trend continuation.
Immediate Support: 4,225 / 4,185
→ Loss of these levels could weaken reversal momentum.
Upside Target Zone: 4,444+
🧘 Trading Psychology Insight
Notice how both emotion and structure played their roles — panic selling near the neckline, followed by accumulation when fear was at its peak.
Markets reward discipline, patience, and conviction — exactly what Yogiraj Trading Academy stands for.
Always remember:
“Charts tell stories — only a calm mind can read them clearly.”
⚠️ Disclaimer
This is a case study for educational purposes.
Trade at your own risk with proper risk management and confirmation from higher timeframes.
🚩 Yogiraj Trading Academy
Where Knowledge Meets Dharma — Transforming Trading from Chaos to Consciousness
#YogirajTradingAcademy #XAUUSD #GoldAnalysis #TechnicalAnalysis #HeadAndShoulders #TradingPsychology #Discipline #PriceAction
Trade ideas

Gold (XAUUSD) Technical AnalysisGold chart analysis:
After a relatively heavy drop on Friday, Gold is currently showing a time-based correction.
In my view, Gold may find a lower point around 4,176 – 4,154.
If it accumulates liquidity in this support zone, a new high could be expected again.
For now, I will wait for this area to consider a long position.
Analysis based on the NDS method, following the style of Professor Iraj Jafarian.
⚠️ Disclaimer: This is my personal analysis and not financial advice. Trade responsibly.

GOLD (XAUUSD) Buying dips within a macro bull runAfter a historic breakout to new highs, Gold is undergoing a healthy correction — not a reversal.
The Demand Zone (4200–4230) remains a key liquidity pocket where smart money is likely to reload longs before the next impulse.
💡 Macro Reason for Buying Dips
• Global Rate-Cut Expectations: Traders are pricing in aggressive Fed cuts over the coming months — lowering yields and boosting gold’s appeal.
• Safe-Haven Demand: Ongoing U.S.–China tensions and geopolitical uncertainty keep gold in strong institutional demand.
• Central Bank Accumulation: Central banks continue record-level gold purchases, reinforcing macro demand floors.
• USD Weakness: A softer dollar environment supports further appreciation in bullion.
Together, these macro drivers align with technical structure, suggesting pullbacks are opportunities to join the larger trend — not fight it.
📊 Trading Plan
• ✅ Monitor 4200–4230 for bullish confirmation
• ✅ Buy dips only after structure shift / rejection from demand
• ⚠️ Manage risk tightly — volatility remains elevated
• ❌ Invalidation if 4H closes below 4200
⸻
🎯 Targets
• TP1 → 4400
• TP2 → 4480
• Extended → 4500+
Bias: Bullish continuation (while above 4200)
View: Macro-driven accumulation phase within ongoing uptrend

XAU Bang!!!You can say this is done….
Do what you will with the last information presented….
Thank You NY 🙏🏽
Thank to everyone who took a loss to pay me.
🤝🏾
I love yous all!!!! Watch the handles….
Stay Sharp! 🔪
Always!!!
BIG JOOP!!!!

XAUUSD Weekly expectations Long/Shirt ?! 🧩 Market Overview
Gold is currently trading around $4,253 , after a strong drop of about -1.6% .
Price is moving inside a rising (uptrend) channel, but the recent red candle shows selling pressure.
⚙️ Key Zones
Resistance: $4,378 → Recent high where price was rejected
Support: $4,036 → Previous low / major demand zone
Buffer Zone: $4,200 → Important area to watch for bounce or breakdown
SSL (Sell-Side Liquidity): Below $4,200 → Possible stop-hunt area
📊 Possible Scenarios
🟢 Bullish :
If price bounces from the $4,200 buffer zone, it may continue higher towards $4,300–$4,378.
🔴 Bearish :
If price breaks and closes below $4,200 , it may fall toward $4,100–$4,036 .
My View
Gold is now near a decision zone.
I’ll wait to see if buyers defend $4,200 or if sellers break it down.
No rush — patience brings better entries.
💬 Disclaimer
This is not financial advice. It’s an educational analysis based on technical structure and liquidity levels.

Gold (XAU/USD) continues to show strong bullish momentumHey traders! 👋
Gold (XAU/USD) continues to show strong bullish momentum after a clear break of structure (BOS) and a solid rejection from the bullish order block (OB). Price is currently approaching a key resistance zone, the same level that previously marked the all-time high (ATH).
If this resistance gets broken with a strong close above, we could see another impulsive leg upward. However, if price reacts bearishly, a possible retracement back to the bullish OB may offer a great buying opportunity.
Stay patient and let the market show its hand before entering. 🧠💰
#GoldAnalysis #XAUUSD #SmartMoneyConcepts #PriceAction #EliteForexInstitute

$XAU LongNom nom nom 🤤…
1100+pip floating on a Monday!!!!
Taking some off the table @ $4359 because we will be coming back into $4381 where I will be looking into scaling in 🏦
$4318 still remains the beast of these waters and we are definitely looking good for full targets on $4484 once a decent retrace can be settled.
Key points this week is CPI moving along on Friday, so we may catch a retrace and just range for the remainder….
Anything pricing over $4281 by that point WILL deliver the cash & this sad soul @scrom_indicator will be able to have a hot meal & not have to eat cold oats anymore….🥣💵
LFG to the Real Traders out there formulating their own ideas and providing value in the market….
Luv All….
🫶🏽 🥄

Gold Rebounds From Demand zone- Bulls Eye 4500$ Target Technical Analysis (1H Chart)
Structure:
Gold remains in a strong ascending channel, with price consistently respecting both the upper and lower trendlines.
The lower black trendline (marked by blue arrows) has acted as a dynamic support multiple times.
The upper black line is serving as a trendline resistance, with potential rejection zones near $4,550–$4,560.
Current Pattern:
Inside the main channel, a smaller parallel structure (rising wedge/inner channel) is forming — showing potential accumulation or continuation within the trend.
This usually precedes a breakout move toward the upper zone of the larger channel.
Key Levels:
Support: $4,200 – $4,220 (Major support zone)**
Current Support Zone: Around $4,250 (near trendline confluence and previous rejections)
Resistance: $4,455 – $4,560 (target zone / channel top)**
Technical Bias:
✅ Bullish above $4,200 support
❌ Bearish breakdown below $4,200 may open room to $4,100–$4,050
💹 Price Action View
Triple rejection from the midline shows short-term liquidity grabs before continuation.
Each rejection was followed by higher lows, showing buyers’ defense (sign of demand zone creation).
The blue arrows represent areas where price tapped liquidity and rebalanced inefficiencies — typical of smart money retracements before continuation.
Next expected move:
Price may:
Tap once more near $4,250 (liquidity sweep of recent lows)
Then rally toward $4,450–$4,550
🧭 SMC (Smart Money Concept)
Liquidity & Demand Zones:
Liquidity below $4,250 (equal lows)
Demand Zone: $4,200–$4,240 → ideal institutional entry
Imbalance/FVG: Between $4,300–$4,360, which price may fill before next push
Market Structure:
Higher Highs & Higher Lows intact (bullish structure)
Internal BOS (Break of Structure) on minor pullbacks confirms healthy trend
Expectation: Re accumulation phase → move to premium zone (above $4,500)
SMC Setup Idea:
Wait for liquidity sweep at $4,250
Entry: On bullish BOS on lower TF (M15–M30)
TP1: $4,400
TP2: $4,550
SL: Below $4,200

Continuation of downtrendI believe we will see a continuation of a downtrend to 3800-3500 before we consolidate for another higher run.
FOMC soon and signs show inflation is higher than expected - additional rate cuts may not happen. Market priced in 25bps so it will be a sell the news

Xauusd good for usGold is showing a notable correction in the last 24 hours. The price dropped from the 4,370 peak, breaking below the EMA 50 (yellow line) and the middle Bollinger Band – signaling that the short-term uptrend is losing momentum.
RSI (7) is hovering around 35–40, approaching the oversold zone. Meanwhile, the volume bars show a clear increase during the red candles, indicating that this move is not just a pause, but a short-term profit-taking phase.
Support is located near 4,200, while 4,260–4,280 now acts as a strong resistance zone.
If RSI dips below 30, we could see an extension toward the 4,100–4,050 area.
However, if buyers step in and price closes above 4,260 again, a new attempt toward 4,350 is likely.
From a broader perspective, the structure remains positive.
The 4,100–4,050 range could become a new medium-term accumulation zone for patient investors.
📊 Summary:
• Short-term correction pressure continues.
• Below 4,200, eyes on 4,100.
• Above 4,260, the recovery could extend to 4,350.
Gold may look calm for now, but this calmness often precedes major moves.
In the next update, we will explore how this setup connects with DXY strength and US yields.

GOLD FREE SIGNAL|LONG|
✅XAUUSD Price has reached the key demand zone where institutional buyers are likely accumulating. The market structure suggests a potential rebound toward 4,160$, with momentum favoring a bullish continuation after this reaction zone holds. Time Frame 2H.
—————————
Entry: 4,115$
Stop Loss: 4,079$
Take Profit: 4,160$
Time Frame: 2H
—————————
LONG🚀
✅Like and subscribe to never miss a new idea!✅

Golden Times!Gold's vertical move the past month accelerated the past week to form a reversal on Friday. Profit taking and overbought conditions pulled the precious metals back from record daily highs.
Expect some more pullback, perhaps towards $4100 ish...there is more left in this tank, there has been no blow off candle as yet, suggesting more upside is coming.
Silver too has had a great run, breaking $50 has taken the precious metals into the media attention phase, stock markets look to have one more finishing move up to conclude their multi year bull run, thereafter we expect at least a major correction or the end of the bull market.
Precious metals are your safest long term bet, corrections or pullbacks are normal in grand cycle patterns...the biggest moves in PM's are still way off...just hold through the coming chaos.
Appreciate a thumbs up...God Bless you all!

Double top perfectly predicts gold plunge, future market layout#XAUUSD OANDA:XAUUSD
Previously, the rise in gold prices continued to break historical records, and today's drop of gold by nearly $300 also broke the recent historical record. The intraday trend has established an M-shaped structure, and the bears have taken the dominant position in the market.
The short-term decline has stagnated slightly, and the current gold price is consolidating around 4110. Both bulls and bears have certain opportunities in the short term. Pay attention to the short-term pressure of 4160-4170 on the upside. If it rebounds here, you can consider shorting gold with a light position based on this range as resistance. If gold directly retreats below, first pay attention to the 4085 support. If it breaks, look at the 4060-4050 support. If it retreats to this range, you can try to go long on gold with a light position and bring SL. If 4060-4050 is lost, the final support point will be the 4000 integer mark.

Gold Bearish Bias for the Day📅 Tuesday, Oct 21, 2025
🕓 4H Timeframe
1️⃣ Market Context
After a strong impulsive bullish run, GOLD is currently consolidating near a heavy supply zone ($4340–$4370).
Price has failed to make a new higher high and is now showing early signs of exhaustion — potential short-term distribution in progress.
2️⃣ Bias: Bearish (Intraday/Short-Term)
Expecting a retracement or corrective leg back into the previous demand zone ($4200–$4230).
This could form a clean short-term sell opportunity before the next major bullish continuation resumes.
3️⃣ Trade Plan
Entry Zone: 4340–4360 (Short/Sell entries from premium supply zone)
Stop Loss: Above 4375 (above previous swing high / invalidation)
Targets:
TP1 → 4290
TP2 → 4250
TP3 → 4205 (final demand zone retest)
RRR: 1:3+ potential depending on entry precision
4️⃣ Confirmation Triggers
✅ Bearish engulfing or rejection wick from supply zone
✅ BOS (Break of short-term structure) on lower TF (1H/15M)
✅ Volume drop on retest = ideal entry signal
5️⃣ Intraday Summary
If GOLD holds below 4360 — bias stays bearish.
Only a clean 4H close above 4375 will flip structure bullish again.
Until then, focus on shorting premium areas toward discount levels below $4250.
💬 Conclusion:
"Sell the premium, buy the discount" — today GOLD looks ripe for a controlled bearish correction before the next leg up. Stay patient, wait for confirmation, and don’t chase longs inside supply.

SMART MONEY CONCEPT (SMC)🚀 Technical Analysis – XAU/USD (15m, SMC)
The market swept sell-side liquidity 💧, triggering SL before showing a potential Change of Character (ChoCh) 🔄.
The key area is the 1H Order Block (4,052) 📍, where we expect a rejection ✅ after the fake out.
✨ Setup:
• 📌 Entry: 4,052
• 🛑 SL: 3,984
• 🎯 TP: 4,270
• 📈 R/R: 1:3
💡 This move follows the institutional narrative: Accumulation → Fake Out → Mitigation → Bullish Distribution.
🔥 Motivational message:
“Remember trader: institutions hunt liquidity before revealing the true move. Stay patient, trust your setup, and let the market work for you.
GOOD LUCK TRADERS… 🔥 🙌

XAU/USD🪙Gold dropped over 6% on October 21 due to profit-taking and a stronger dollar, but this pullback is healthy after a 60% rally in 2025. At $4,050, the market is likely executing a liquidity grab before resuming its bullish trend toward new highs.🪙
---
📈 Gold Trade Idea – Liquidity Grab Before New Highs📈
Gold experienced a sharp correction on October 21, falling over 6% from its all-time high of $4,382 to around $4,100, marking its largest single-day drop since 2013. This move was driven by profit-taking after an extraordinary rally, alongside a stronger US dollar, improved risk sentiment, and optimism over US-China trade talks.
Despite the volatility, this pullback is not a trend reversal—it’s a healthy correction following a 60% surge in gold prices this year, fueled by economic uncertainty, central bank accumulation, and expectations of interest rate cuts.
Currently, gold is trading around $4,050, a key zone where I anticipate a liquidity grab. This level likely holds clustered stop-losses from late buyers and short-term traders. Once this liquidity is absorbed, I expect gold to resume its bullish momentum, targeting new highs above $4,400.
### 🔍 Why Gold Is Still Bullish:
- Macro uncertainty remains elevated, keeping demand for safe-haven assets strong.
- Central banks continue to accumulate gold, supporting long-term demand.
- Rate cut expectations from the Fed and other central banks reduce opportunity cost for holding gold.
- Technical structure shows a classic retracement after a parabolic move—ideal for continuation setups.
This correction is a textbook example of market mechanics: after a euphoric rally, the market shakes out weak hands before continuing higher. I’m watching for confirmation of support around $4,050 and signs of absorption before entering long.

Simple XAUUSD Strategy That Just Made 100 Pips!Gold played out beautifully today with a clear 100-pip move to the downside. After testing resistance near 4240, price showed rejection with strong bearish candles, confirming exhaustion from buyers and giving a clear sell signal.
The structure shifted from higher lows to lower highs, signaling the start of a short-term correction. Once price broke below the intraday support zone, momentum carried it smoothly down toward 4145 — completing a perfect swing move.
No complex indicators were needed. Just clean market structure, rejection candle confirmation, and patience for entry. The dollar strength added extra pressure on gold, aligning with the technical view.
Key takeaway: follow structure, not emotion. A simple rejection and structure break can deliver more than any over-complicated setup. Consistency comes from clarity.
Trade closed around 4145 with a solid 100-pip gain. Now watching the 4140–4130 zone for possible reaction or bounce setup before the next move.
#XAUUSD #Gold #PriceAction #Breakout #SmartMoney #TechnicalAnalysis #DayTrading #Scalping #TradingView

GOLD BUY FROM 4,300 LIMIT ORDERUsing the 5min chart analysis on gold price builds an inside bar candle after a long volume created after the inducement am going to set a buy limit order at 4,300 buying till new high is created.....
LETS KNOW YOUR THOUGHTS ON THIS............

XAU updatedWell well well!!!!
London Active. Looking textbook right here and should be sweeping asias low for starters.
Open was so close to high and had every excuse to take but chose to roll in the end….
Same from last post, come close to stoppages, had to allow and like isaid, no closures were made above 70z!!!
I’ll be reducing stops here on to 70 from here, it’s tagged up enough and I believe the next interaction is for a break out. The same handle is at play! $4318x
Needs a settle and if so, we should see our targets met… 245-40…
Pending structure and closures I’ll be in the spot for layering longs.
Be meticulous, protect your self, cover your stop loss, reduce or full roll them 🤷.
Bless all!
Have a great weekend…🤝🏾😎

double top pattern double top pattern
Moreover its showing divergence on RSI as well
Bearish pattern on a way
Simple short to buy into Just a simple short to 4000, from this bear flag, which is a good psychological level then a continued push up.
Still in a clear bull run on 4H,D,W etc
Abit new so any bigger thought/idea would be appreciated ☺️

XAU/USD Bullish Reversal from Buy Zone – Targeting $4,392t: Gold Spot / USD (XAU/USD)
Timeframe: 30-minute
Current Price: $4,253.975
Trend: Recently broke below an ascending channel but bounced from a support zone.
🔍 Key Features on the Chart:
Ascending Channel (Yellow lines)
Price was previously moving inside a well-defined ascending channel.
It broke below the channel, suggesting a possible trend shift or correction.
Buy Zone (Purple Box ~ $4,200 - $4,220)
A demand zone where buyers stepped in.
Price bounced strongly from this zone, indicating support is respected.
Projected Price Path (Blue Zigzag Arrow)
Indicates a possible bullish wave structure (higher highs and higher lows).
Suggests a continuation of the uptrend after the correction.
Target Level: $4,392.539 (Blue Line)
A projected resistance or take-profit zone.
Price is expected to reach this level based on the bullish scenario.
🧠 Interpretation:
Bullish Bias: The chart suggests that the correction might be over after finding support in the "Buy Zone".
Entry Zone: Around $4,200–$4,220 appears to be a strong buy area.
Target: $4,392.539 (approx. +140 points from current level).
Risk Consideration: If price drops below the buy zone significantly, the bullish bias may be invalidated.
✅ Summary of Strategy:
Potential Buy: From current levels or on pullback toward the $4,220–$4,200 zone.
Stop-Loss: Below the buy zone (e.g., under $4,180 or based on your risk tolerance).
Target: Around $4,392.
If you'd like, I can help you:
Calculate potential risk/reward.
Convert this into a trading plan.
Monitor updates (with live data).

FOR APRIL 2026 2960.
2536
2271
expected gold price in 2026
if the economy cools down, the price may reach this level
predicting the exact price of gold in 2026 is challenging, but we can make an educated forecast based on historical trends and how gold typically reacts to an economic cooldown.
