XAUUSD H1 Structure Shift SellGOLD (XAUUSD) H1 Timeframe SELL Analysis
After a strong bullish rally, Gold showed a major reversal where the price tested the 4000 level and then gave an aggressive bullish push. During this bullish wave:
1. Break of Structure (BOS) Confirmation
Price first gave a BOS, and with bullish continuation it respected the bullish trendline twice.
2. Break of Structure
Price tested the bullish trendline again and afterward the market moved inside a Small Bullish Channel (ascending channel), where a higher-high and higher-low structure was maintained.
3. Trend Weakness After the Last BOS
After breaking above the channel, the market formed a lower high, showing that bullish momentum was weakening.
From this point, a Bearish Trendline was created, which is now rejecting the price.
4. Current Market Behaviour (Most Important)
Price retested the Bearish Trendline
Failed to break it rejection occurred
Price is currently trading around 4194
Market structure is now showing a clear bearish shift
As long as the price stays below the bearish trendline, further downside continuation is expected
SELL Trade Setup
Sell Entry
4192 – 4194 zone
Stop Loss 4213
Take Profit Levels
TP1 4170
TP2 4145
TP3 4110
Final Summary
After the bullish rally, Gold gave a reversal, BOS was confirmed, the bullish channel broke down, and now the bearish trendline is strongly rejecting price. A sell setup is active from 4190 targeting 4170, 4145, and 4110, with a stop loss at 4213.
Trade ideas

GOLDMost traders use candlestick charts or bar charts (HLOC). Candles show the “open, high, low, close” of each time-block and give a quick sense of price movement & volatility.
Orobel
+2
IG
+2
Long-term charts (monthly or yearly) help you see broad trends; short-term (minutes, hours) show volatility — potential trading opportunities.
Orobel
+1
Because gold is priced in USD, dollar strength affects gold price: when USD weakens, gold tends to rise (and vice versa).

Gold (XAU/USD) Breakout Setup: Demand Zone Retest and Upside TarOverall Structure
The chart shows Gold Spot (XAU/USD) on the 30-minute timeframe, and it highlights:
A descending channel (blue parallel trendlines).
A support zone (yellow box).
A stop-loss zone (red area).
A long (buy) projection toward a high target point around 4,265.
1. Descending Channel
The price has been moving inside a clearly defined downward-sloping channel.
Currently, the price is:
Testing the upper boundary of the channel.
Showing signs of attempting a breakout.
This suggests momentum may be shifting.
2. Strong Support Zone (Yellow Box)
The highlighted yellow zone around 4177 – 4160 acts as:
A demand zone where buyers previously stepped in.
The chart suggests a potential retest of this area before a bullish push.
The projected price action line (blue sketch) shows:
Dip → retest support → breakout → rally.
3. Stop-Loss Zone (Red Area)
Under the yellow support sits a stop-loss / invalidation zone around:
4160.107 (marked explicitly)
This implies that if price drops below this level, the bullish scenario becomes invalid.
4. Bullish Target
The projected target is drawn high above the current price:
4265.369 – 4265.645
This is a large upward move, suggesting:
A breakout from the channel
A continuation to a new high
The vertical grey rectangle indicates the expected profit zone of the trade.
5. Trade Logic Implied by the Chart
Bullish thesis:
Step 1: Price dips back into 4177 → 4160 zone
Step 2: Buyers defend the zone
Step 3: Breakout above descending channel
Step 4: Rally toward 4265 target
This is a classic pullback-to-support before breakout structure.
Risk:
Break below 4160 invalidates the buy idea.
6. What This Chart Suggests
In summary:
Bullish signals:
A descending channel that often breaks upward after weakening momentum.
Strong demand zone highlighted.
Clear projection showing expected reversal and breakout.
Bearish risk:
If support fails, downside continuation is likely

XAUUSD bullish XAUUSD bullish should be Bullish Week upcoming. Weekly candle Open Low high close.
Weekly profile x-Day low swept before DOL hit.

XAUUSD – LANA TRACKS MEDIUM-TERM WAVE 5 TOWARDS ATH REGION 4360 XAUUSD – LANA TRACKS MEDIUM-TERM WAVE 5 TOWARDS ATH REGION 4360
1. Fundamental Analysis
In the geopolitical context, President Putin continues to reiterate the conditions for a ceasefire between Russia and Ukraine. The possibility of a peace agreement remains open, but the tough statements indicate that the conflict risk cannot end soon. This keeps gold as a medium-term safe-haven asset.
On the other hand, in the US, Mr. Trump continues to emphasize the view that the stock market will continue to reach new highs and even mentions the possibility of abolishing most income taxes, replacing them with revenue from tariffs. These statements foster a "risk appetite" sentiment on stocks and the USD, creating a certain tug-of-war with gold in the short term.
In summary, Lana sees gold in the next 1–2 weeks still leaning towards a medium-term uptrend, but it is easy to see fluctuations as the market continuously re-evaluates geopolitical risks and policy expectations from the US.
2. Technical Analysis
The D1 frame is showing the Elliott wave 5 structure in the medium-term uptrend phase. Wave (4) has completed at an important support area, accompanied by a market structure shift (MSS) signal reversing upwards, paving the way for wave (5).
Using Fibonacci extension, the theoretical target for wave (5) can reach the 2.618 region around 4360, which is also a strong psychological resistance and near the ATH area – a region very prone to large profit-taking by buyers.
Along the way, the 4246 mark is an important resistance area:
If the price decisively breaks and closes the D1 candle above 4246, the uptrend will be more strongly confirmed, indicating that buyers are willing to push the price to new highs.
The downtrend line has been breached, then the price returned to test and bounced up, showing that buying power is regaining the advantage. The price retracing around the trendline & the 4133–4139 area will be an opportunity for Lana to find a buying point in line with wave 5 with a better R:R ratio.
3. Price Areas to Watch
Important resistance / medium-term profit-taking area:
4240 – 4246: intermediate resistance, needs to be broken to strengthen the uptrend.
4360: Fibonacci 2.618 region & potential ATH area of wave 5.
Support / potential buying area:
4133 – 4139: price area near the trendline, where Lana prioritizes watching for buying if a correction appears.
4124: technical stop-loss mark, below this area the short-term wave structure may weaken.
4. Trading Scenario
Buy 4133 – 4139
SL: 4124
TP: 4240 – 4280 – 4350
👉 Follow Lana on TradingView to read the earliest gold analyses. 💛

Gold Eyes $4,000Gold has been in a strong uptrend since its breakout from the accumulation range in December 2023, a move I anticipated and shared with traders (check the link below for my chart call). The recent 50 basis point rate cut by the Federal Reserve has injected fresh momentum into gold’s rally, setting the stage for a potential surge towards $2,700 to $3,000 USD in the coming months as part of a new market buy program.
However, the long-term picture remains even more bullish, with Fibonacci extension projections suggesting that gold could eventually test $4,000 USD. That said, we must bear in mind that gold’s history suggests periods of reaccumulation between major breakouts, which could last for a few years depending on market sentiment and the overall economic outlook.
Fed’s Rate Cut and the Market Buy Program
The Federal Reserve’s recent 50 basis point rate cut has created the perfect environment for further gains in gold. With interest rates dropping, the opportunity cost of holding non-yielding assets like gold decreases. At the same time, a weaker U.S. dollar, resulting from the rate cut, makes gold more attractive to foreign buyers, further boosting demand.
This shift in monetary policy is likely to lead to a market buy program, where investors increase their gold holdings as a hedge against inflation, currency devaluation, and economic uncertainty. With these factors in play, gold looks set to climb higher in the near term.
Target Range: $2,700 to $3,000 USD for Reaccumulation
In the short to medium term, I’m projecting gold to reach $2,700 to $3,000 USD, where we may see a reaccumulation phase. Here’s why:
Historical Patterns of Accumulation and Reaccumulation: Gold has a history of moving through accumulation and reaccumulation phases before breaking out to new highs. For example, the original accumulation phase for gold lasted about six years, and following that, there was a 3.6-year reaccumulation phase before the next major move upward. Once gold reaches $2,700 to $3,000 USD, I expect a similar reaccumulation phase that could last for a few years before the next breakout.
Fibonacci Extension Projections: Based on Fibonacci extensions, there is a strong case for gold reaching $4,000 USD in the longer term. These extensions are often used to identify potential future price targets in trending markets, and the current trend in gold is setting up for a move towards this key level. However, as mentioned, we could see a reaccumulation around the $3,000 USD mark before gold pushes higher.
Why Gold Consolidates Before Major Breakouts
Gold’s past price movements have demonstrated that the metal typically undergoes periods of consolidation (reaccumulation) before making its next big move. These phases allow the market to absorb supply, shake out weak hands, and build a stronger foundation for the next leg up.
At $3,000 USD, gold could enter another one of these phases, consolidating for a few years before breaking out towards $4,000 USD. The length of this consolidation will depend on various factors, including global economic conditions, inflation trends, and how central banks adjust their monetary policies.
Outlook: $4,000 USD in the Long Term
While the immediate focus is on gold’s move to $2,700 to $3,000 USD, the longer-term projection points toward $4,000 USD. This price target is based on Fibonacci extension levels, which have been reliable indicators in trending markets like gold. Achieving this level will depend on how the macroeconomic landscape unfolds over the next few years.
Factors such as continued dollar weakness, inflation concerns, and geopolitical risks will play key roles in driving demand for gold. However, given the history of accumulation and reaccumulation phases, it’s reasonable to expect a period of consolidation at $3,000 USD before gold embarks on its next major upward move.
Factors to Watch Moving Forward
Market Sentiment: Investor sentiment towards risk assets and safe-haven investments like gold will heavily influence the price trajectory. Increased uncertainty or global economic instability will likely accelerate demand for gold.
Fed’s Future Policies: Any further rate cuts or signs of dovish monetary policies could fuel more demand for gold, pushing prices higher.
Inflation Trends: Persistent inflationary pressures would enhance gold’s appeal as a hedge, further driving up demand and shortening the reaccumulation phase at $3,000 USD.
Conclusion
Gold’s breakout in December 2023 marked the beginning of a powerful uptrend, and the Fed’s recent rate cut has only added fuel to the fire. I’m projecting that gold will hit $2,700 to $3,000 USD in the near term, where we may see a reaccumulation phase lasting a few years. However, based on Fibonacci extension projections, gold could eventually reach $4,000 USD in the longer term.
Keep a close eye on market sentiment and macroeconomic developments, as these will be critical in determining how quickly gold moves through its next phases.
— Lord MEDZ
Disclaimer:
This article is for informational purposes only and should not be construed as financial advice. The opinions expressed are solely those of the author, Lord MEDZ, and do not guarantee any specific outcome. Investing in gold or any financial instrument involves risks, and readers should consult with a financial advisor before making any investment decisions.

Gold at a Crossroads( OANDA:XAUUSD XAUUSD) trading inside a descending channel, respecting both the upper and lower trendlines. Price is currently reacting from the upper boundary of the channel, suggesting potential short-term bearish pressure.
1. Price Structure
The market is forming lower highs inside a well-defined downward sloping channel, indicating a controlled corrective structure.
Price recently tested the upper trendline and rejected it, showing sellers defending this zone.
🟡 2. Key Resistance Area (Cluster Zone: 4210–4240)
At the top, there is a strong Fibonacci extension cluster:
1.414 (4212)
1.618 (4240)
This creates a heavy resistance zone, highlighted on your chart as a "Cluster".
If price ever breaks above the descending channel, this area becomes the major upside target, and also a strong potential reversal zone.
🟠 3. Support Zone (4120–4135)
The highlighted rectangle around 4120–4135 represents:
Prior demand zone
Confluence with internal Fibonacci levels
The midpoint area of the channel
This zone is critical.
A break below could open the way toward 4088 / 4068 (your blue levels).
🔵 4. Fibonacci Confluences
Multiple Fibonacci levels align with the current structure:
1.13 (4174) and 1.272 (4193) → Mid-range resistances inside the channel
0.786 (4128) → Matches the support box
0.618 (4105) and 0.5 (4086) → Targets if the market continues downward
These Fibonacci overlaps confirm the importance of the 4120–4135 zone as a turning point.
📉 5. Expected Scenarios
Bearish Scenario (More Likely Short-Term)
Because price rejected the channel top:
Expected drop toward 4128 → 4120 support zone
If broken, continuation toward 4088 → 4068
This matches your hand-drawn orange projection
Bullish Scenario
For bulls to take control:
Price must break the descending channel
Sustain above 4174 → 4193
Target the 4210–4240 cluster
This would be the beginning of a larger bullish structure.
🎯 6. Summary
Gold is currently bearish within a downward channel.
4120–4135 is the key support to watch; its reaction determines the next move.
If it holds → price may bounce inside the channel.
If it breaks → downside continuation toward 4088 → 4068.
If price breaks upward → 4200+ becomes the target zone.

XAUUSD-Bullish Channel Bounce SetupGold currently moves inside an ascending channel. Price is holding above the 4,150 support zone. If this support holds, we may see a bullish bounce toward the upper channel levels 4190

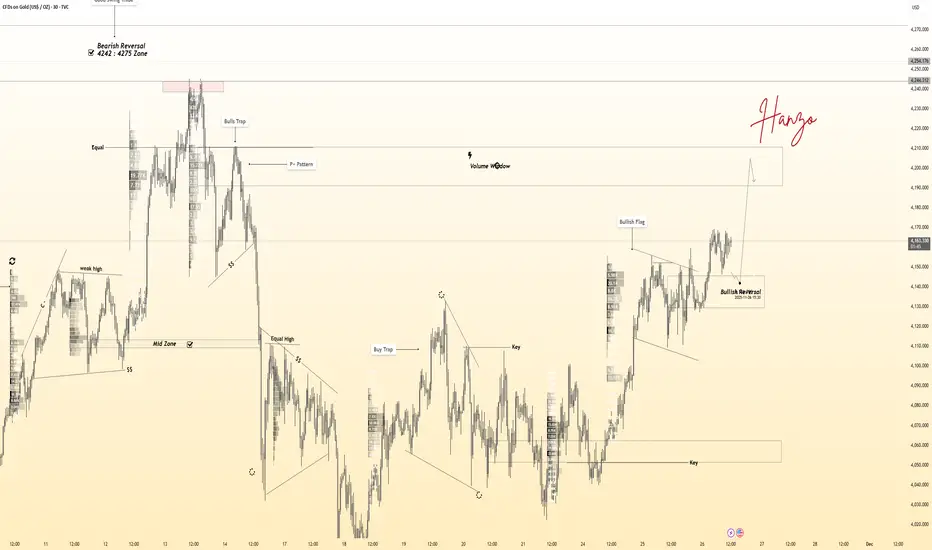
Gold 30-Min — Volume Buy Reversal Triggered⚡Base : Hanzo Trading Alpha Algorithm
The algorithm calculates volatility displacement vs liquidity recovery, identifying where probability meets imbalance.
It trades only where precision, volume, and manipulation intersect —only logic.
Technical Reasons
/ Direction — LONG / Reversal 4147 Area
☄️Bullish momentum confirmed through strong candle body.
☄️Structure shifted with higher-low near key demand base.
☄️Volume expanding confirms order-flow alignment upward.
☄️Buyers reclaimed imbalance with sustained clean break.
☄️Algorithm detects rising momentum under low liquidity.
⚙️ Hanzo Alpha Trading Protocol
The Alpha Candle defines the day’s real control zone — the first battle of momentum.
From this origin, the Volume Window reveals where the next precision strike begins.
⚙️ Hanzo Volume Window / Map
Window tracked from 10:30 — mapping true market behavior.
POC alignment exposes institutional bias and breakout potential zones.
⚙️ Hanzo Delta Window / Pulse
Delta window monitors real buying vs. selling power behind each move.
Tracks volume aggression to expose who controls the candle — buyers or sellers.
When Delta aligns with Volume Map, momentum becomes undeniable.
GOLD Bullish ContinuationGOLD Trading Idea (Based on Up Channel Structure)
Market Structure:
Gold is currently moving inside a clear Up Channel, showing strong bullish momentum. Price has recently bounced from the Demand Zone, confirming buyer interest.
Idea:
If the price pulls back slightly toward the lower boundary of the channel, it may offer a good buying opportunity. As long as the price stays inside the channel, the bullish trend remains valid.
Entry Zone:
👉 Look for buy entries near the demand zone / channel support.
Target:
🎯 Upside target is near the 4,220 – 4,240 zone (as shown on your chart).
Risk Management:
🛑 Place stop-loss below the demand zone to protect against a bearish breakout.
Summary:
Gold is bullish, respecting the up channel. A pullback to channel support could provide a high-probability buy setup toward the upper resistance area.

XAUUSD - Liquidity Storytelling Through Structure.🔶 Welcome to Liquidity Atlas — The Footprint Journal of XAUUSD
Gold continues to operate inside a liquidity-defined environment with a very clear distribution of resting pools and inefficiencies.
After the BOS, price expanded into a new range and began building repeated swing highs — each one reinforcing sell-side liquidity engineering and creating a clean cluster of liquidity labeled as SSS on the chart.
Below, one major point stands out:
a deep discount liquidity pool sitting around the blue zone, an area where price previously delivered impulsively and left inefficiencies unbalanced.
Markets rarely ignore untouched inefficiency for long — imbalance is the algorithm’s unfinished business.
Above price, we also hold a SIBI zone coupled with a previous swing high point.
The LH marks an area of premium where earlier rejection occurred, but inefficiency remains open — meaning there is unfilled narrative above, even while discount liquidity sits untouched beneath.
This creates a two-sided story, where liquidity exists both above and below, and the next sweep reveals intention.
This is not about predicting direction — it’s about understanding flow:
• BOS established a directional shift.
• SSS zones reflect engineered liquidity.
• The lower blue region remains a draw if displaced.
• SIBI overhead remains unmitigated inefficiency.
Whichever side gets liquidated first may reveal the algorithmic path — whether rebalancing inefficiency below or tapping into unmitigated premium inefficiency above.
The narrative is already in the structure. Price is simply writing the next chapter.
— Liquidity Atlas | Reading Imbalance, Not Guessing.

XAUUSD – 4H Outlook | Key Levels, Plans & Intraday BiasRecent candles indicate bull exhaustion at the descending trendline, with wicks rejecting higher prices. Momentum is slowing, and the chart suggests a potential short-term pullback into the support box before choosing direction.
Price is reacting to a cluster of key levels between:
4143–4130 zone (orange +blue support block)
4170 trend line resistance
4209 / 4231 resistance zone (upper yellow levels)
4268 major resistance (top of channel)
Bearish factors
Repeated rejection at descending red trendline.
Breakdown from minor rising sub-structure.
Price struggling to maintain above 4170–4180.
Bullish factors
Larger trend still inside a long-term ascending channel.
Strong support at 4130–4143 (multiple bounces).
High-timeframe buyers likely active below 4120.
✅ [ b]Plan A — Bearish Retracement to Buy Lower (Preferred Based on Current Price Action)
Idea: Price breaks below 4143–4130 to sweep liquidity, taps lower channel support, then reverses back upward.
Triggers:
Break below 4130 (blue zone)
Wick rejection or bullish reversal pattern at 4100–4080
Touch of channel support (green path in chart)
Targets:
TP1: 4130–4143 retest
TP2: 4170–4180
TP3: 4209 / 4231 (major mid-range resistance)
Invalidation:
A 4H close below 4080 signals deeper downside toward 4043.
✅ Plan B — Support Hold and Breakout Continuation (Bullish Scenario)
Idea: The purple support zone holds cleanly, price forms higher lows, breaks above the descending trendline, and resumes the uptrend.
Triggers:
Strong bounce from 4143–4130
Break and 4H close above 4175–4180
Clear breakout above the red downward trendline (purple projected path)
Targets:
TP1: 4209
TP2: 4231
TP3: 4268 (channel top / major resistance)
Invalidation:
A clean 4H close below 4130 shifts bias back to Plan A.

XAUUSD - Sell Trade Idea - 27.11.2025 Currently the market is consolidating around 4173-4160 zone, making a double top at 4173 and 4171 respectively. At the moment, will try to ''ice'' all the sell side of the market by coming close to the 4173, and then ''ice'' all the buy side of the market thinking that the level 4137 -4143 will serve as a good resistance.
Expecting at 08:00 EST , for the market to move downward. breakiung the 4137 level.

XAUUSD – 4H Chart AnalysisTesting the Upper Boundary of the Descending Channel
XAUUSD continues to move within a medium-term descending channel , and price is now testing the upper boundary of this structure — a level that has repeatedly acted as resistance in recent weeks.
In the short term, the market is forming a narrow rising wedge , a pattern that often appears as a weakening corrective move within broader downtrends. Previous occurrences of this pattern on this chart have also led to pullbacks after touching the channel’s upper boundary.
As long as the channel resistance holds , the first area of interest on the downside is the 3880–3920 support zone, which represents a key structural floor in the current movement.
A break below this zone could open the path toward the midline of the channel and potentially lower levels.
The bullish scenario becomes valid only if price can achieve a clean breakout above the channel , supported by strong momentum and confirmed closes.

XAUUSD SMC Buy Setup – Demand Zone Reaction from 4140🟩 SMC BUY Idea on XAUUSD (4140 Buy Plan)
Price swept sell-side liquidity below 4140 and tapped a clean SMC Demand + Rejection Block. A bullish displacement candle and BOS confirm upside intention.
Buy Zone: 4140 – 4138
SMC Reasons:
Sell-side liquidity sweep
Demand zone mitigation
Bullish BOS
FVG above acting as magnet
Price holding above short-term structure
TP1: 4175 (internal liquidity)
TP2: 4185 (external liquidity + supply zone)
Invalidation: Clean break below 4130
This is an educational SMC analysis, not financial advice.

GOLD NEXT WEEK !Gold can move to hunt resistance zone and then go down !
if break the gray zone this chart invalid.
lets make money with that..

GOLD (XAU/USD) : Strong Bullish ConfirmationGOLD is going to continue rising in an uptrend
that the pair established.
A completion of a consolidation and the formation of a new local Higher High
indicate a highly probable bullish continuation soon.
Next resistance - 4180 - 4200

Gold Reaches Exhaustion Zone — Sell Momentum LoadingGold Reaches Exhaustion Zone — Sell Momentum Loading
Gold is showing signs of upside exhaustion, with price repeatedly failing to gain momentum as it approaches the mid-range premium zone near the 4,245 area. The recent structure reflects a market transitioning from short-term recovery into renewed weakness, with each bullish attempt losing strength faster than the previous one.
Order flow remains dominated by distribution behaviour, and the chart signals a potential liquidity sweep followed by a bearish continuation. The projected rejection zone suggests that buyers are running into an area of heavy supply, where institutional activity has previously triggered aggressive downside extensions. Volume distribution across the range also highlights diminishing demand at higher prices, reinforcing the likelihood of a downward rotation.
As the market continues to respect its broader range ceiling, the probability increases for price to revisit deeper value regions. With momentum fading and the current leg showing hesitation, gold is positioned for a potential sell-side move toward lower mean-reversion levels.

XAUUSD: Bearish Drop to 3885?OANDA:XAUUSD is eyeing a bearish reversal on the daily chart , with price testing resistance near ATH levels after recent rebounds from support, converging with cumulative sell liquidation and a potential entry zone that could spark downside momentum if sellers defend the highs. This setup suggests a pullback opportunity amid the ongoing uptrend, targeting lower support levels with strong risk-reward exceeding 1:3.
Entry between 4280–4340 for a short position (entry from current levels with proper risk management is recommended if price reaches the zone). Target at 3885 . Set a stop loss at a close above 4400 , yielding a risk-reward ratio of more than 1:3 . Monitor for confirmation via a bearish candle close below entry with rising volume, leveraging gold's volatility near peaks.🌟
Fundamentally , gold prices are hovering around $4,207–$4,222 per ounce as of December 3, 2025, after a 0.5% daily gain and a 7.37% rise over the past month, driven by safe-haven demand amid geopolitical tensions and expectations of Fed rate cuts. However, forecasts for 2025 suggest potential volatility with upside to new highs like $4,000+ in the longer term, though short-term corrections could emerge due to overbought conditions, central bank policies, and inflation dynamics. 💡
📝 Trade Setup
🎯 Entry (Short):
4280 – 4340
(Entry from current levels is valid if price reaches the zone with strict risk management.)
🎯 Target:
• 3885
❌ Stop Loss:
• Daily close above 4400
⚖️ Risk-to-Reward:
• >1:3 overall
💡 Your view?
Will gold reject this ATH resistance zone for a deeper correction — or break higher into new territory?
👇 Share your thoughts below! 👇

Elliott Wave Analysis XAUUSD – Week 1 of December 2025
1. Momentum
W1 – Weekly Timeframe
Weekly momentum is currently turning upward, exactly as warned last week: if weekly momentum continues to rise strongly, the market may enter a bullish phase lasting 4–5 weeks.
However, the candlestick structure still shows short, overlapping candles, which do not yet reflect a clear long-term uptrend. Therefore, we need to continue monitoring closely.
D1 – Daily Timeframe
Daily momentum remains compressed in the overbought zone, indicating a potential reversal on the daily chart in the coming week.
H4 – 4-Hour Timeframe
H4 momentum is currently rising, suggesting that early in the Asian session on Monday the market may continue with another upward move or remain in a sideways structure.
________________________________________
2. Wave Structure
W1 – Weekly Timeframe
On the weekly chart, the main focus remains on weekly momentum:
• If weekly momentum pushes decisively into the overbought zone and price breaks the 4,396 high, the current corrective structure may be considered complete, and the market could begin yellow wave 5.
• The initial upside target in this scenario would be the 4,592 region.
However, weekly candles still do not support a long-term bullish view, as they lack a pattern of higher highs and higher lows and instead show overlapping behavior.
Therefore, for now, we prioritize monitoring the wave structure and momentum on D1.
________________________________________
D1 – Daily Timeframe
The strong rally on Friday pushed the price higher, threatening the red 1–2–3–4–5 count.
However, to fully invalidate this structure, price must reach or exceed 4,245.
→ Therefore, at this moment, the red 1–2–3–4–5 wave count remains valid.
If price breaks above 4,245, it suggests that purple wave X is still unfolding, forming a W–X–Y Flat correction in purple, with wave Y potentially ending near the previous wave X bottom.
If price breaks strongly above the orange wave 3 high (4,383), the market will enter orange wave 5, and given the nature of commodities—where wave 5 often extends—targets could exceed 4,592.
________________________________________
H4 – 4-Hour Timeframe
Since the red 1–2–3–4–5 count has not been invalidated, we continue to follow this plan.
On the H4 chart:
• Price is currently inside blue wave 5, which itself belongs to black wave 5 of blue wave C.
• Black wave 5 shows a five-wave internal structure in blue, but with overlapping price action, suggesting a possible ending diagonal formation for black wave 5.
If this is indeed an ending diagonal, the market should experience a sharp decline to confirm the pattern.
Key confirmation signals to watch on Monday:
• A H4 candle closing below 4,184
• Ideally, a stronger close below 4,158
If these conditions appear, we will prioritize breakout trading around:
• 4,184
• 4,158
I will provide a detailed update once we have real market data early next week.

Gold Hit Both Targets — +440 Buy, +195 SellHello my trader friends,
I'm back with an updated analysis on gold.
We had a great forecast on XAU/USD.
Based on our previous analysis, we expected a bullish move toward our marked zone — and gold followed the chart beautifully. Our buy position delivered +440 pips profit.
After that, we were waiting for a reaction from the sell zone, and that’s exactly what happened. Gold tapped our level and started a corrective move downward, giving us another +195 pips profit from the sell.
Follow me for more updates and upcoming analyses!

GOLD (XAU/USD): Bullish Sentiment ConfirmedGold is currently exhibiting a bullish trend.
Following the establishment of a new higher high, the pair retraced to a rising trend line.
Upon testing this trend line, the market formed a double bottom formation and subsequently violated its neckline.
It is anticipated that buyers will continue to drive the pair upward.
The target is 4,200.

Gold buy idea📈 Gold Buy Idea
Gold has been in an uptrend since Friday. Price continues to rise as London provides the main supply expansion, and NY liquidity merges with the London move, creating strong bullish momentum.
How to Trade It
1️⃣ Wait for the 30m candle to close above 4262
You need a full bullish candle closing above this level to confirm continuation.
2️⃣ Volume Confirmation
Volume must be above average or at least match the previous candle’s volume to validate strength.
Invalidation / Avoid Taking the Trade
❌ If the current 30m candle closes below the previous candle, skip the trade.
❌ You can re-enter only if price closes back above 4262, following the same confluences listed above.
