Today's strategy! Short gold at 4208-4220!After the gold market opened this week, gold prices rose but encountered resistance and then pulled back. Compared with the past, the overall fluctuation range was not large, with the highest and lowest points fluctuating by only about $100, and the trend has been oscillating and adjusting.
Weak US ADP data further fueled market expectations of a December rate cut by the Federal Reserve, supporting gold prices to remain in a high-level consolidation phase.
Short-term technical analysis shows that gold prices have been hovering around the $4200 level, which has temporarily become a key dividing line between bullish and bearish sentiment. Our trading strategy is to treat this as range-bound trading. A short-term strategy could consider shorting gold in the $4208-$4220 range. The MACD is showing signs of a death cross, indicating weakening upward momentum.
The above views represent my personal thoughts. If you do not yet have a clear trading strategy or the ability to independently analyze market trends, you are welcome to refer to them! Let's improve together! If the market changes, I will notify you in the channel!
Trade ideas

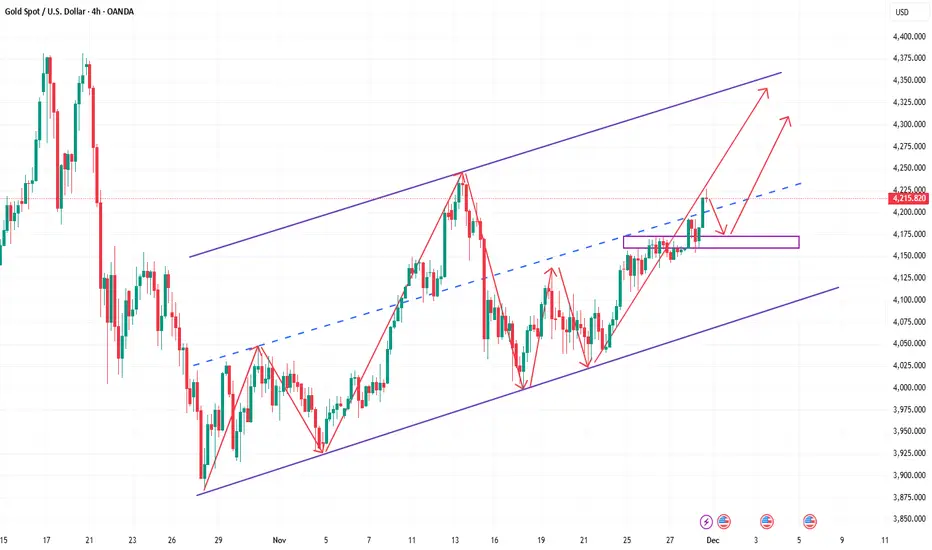
How high will gold go next week How much room is there to go up?Gold Technical Analysis: Gold has seen several highlights this week, breaking through the 4200 mark again, a figure that has caused considerable panic. Coupled with consecutive daily gains and high-level consolidation, this is the first sign of a strong upward move. The daily chart shows a reversal from a bearish to a bullish pattern, and if this pattern continues for two more days, forming a consecutive bullish formation, it will likely evolve into a second upward move. On Friday, gold experienced a relatively strong surge, falling to a low of around 4153 and rising to a high of around 4226. Currently, the bullish trend remains unchanged, and pullbacks present opportunities to enter long positions. The next key resistance level to watch is around 4245; if this level holds, a short position can be considered before going long.
This week, the key resistance area for gold is around 4240-4250. If it can break through effectively, the price of gold is expected to further test the previous highs of 4300 and even 4380. On the downside, 4175-4160 has turned from resistance into the first strong support, and the more critical support is at the 4150 level, a trading zone between bulls and bears. From the 4-hour chart, the main support for the price is at 4200. As long as the market maintains its strong upward momentum, it will not retrace too deeply. Therefore, it is necessary to pay attention to the short-term bullish trend. On the hourly chart, the price rose from 4155, and after a retracement from 4170-4180, it rose to 4226. The bullish trend support is at 4155. As long as the price does not break 4155, it will continue to rise and move towards the 4240-4250 area. In summary, the recommended strategy for gold trading next Monday is to primarily buy on dips and secondarily sell on rallies. The key resistance level to watch in the short term is 4240-4250, while the key support level is 4180-4160. Please keep up with the pace of the market.
Gold breakout incoming? Triangle in focus as Fed cut bets rise!Gold has snapped back above the $4.1k handle and is coiling in a triangle just under resistance as markets go almost all‑in on a December Fed rate cut.
In this video, we look at how dovish shifts from Fed officials and surging rate‑cut odds are lifting gold while price action compresses between the 4k support and the 4,240–4,245 resistance band. We then map out both bullish and bearish scenarios using the 4,100 handle as the key line in the sand.
Key drivers
Markets now price roughly 80% odds of a December Fed cut after comments from Christopher Waller and Mary Daly backing a move on the basis of a weakening labour market.
Lower expected policy rates and a softer dollar reduce the opportunity cost of holding gold, helping XAUUSD hold above 4,100 even as risk appetite improves elsewhere.
On the 1‑hour chart, gold is locked in a contracting triangle/pennant with higher lows and lower highs, overbought RSI cooling off, and 4,100 acting as potential support.
A sustained break above roughly 4,175–4,200 opens the door towards 4,240–4,275, while a failure and loss of 4,100 puts 4,000 back in play and risks a deeper extension towards the 3,750 zone.
If you’re trading gold, share your triangle scenarios in the comments. Are you buying a 4,100 hold or fading a failed breakout? Make sure to follow for more macro‑plus‑technicals trade setups.
This content is not directed to residents of the EU or UK. Any opinions, news, research, analyses, prices or other information contained on this website is provided as general market commentary and does not constitute investment advice. ThinkMarkets will not accept liability for any loss or damage including, without limitation, to any loss of profit which may arise directly or indirectly from use of or reliance on such information.

03/12/2025 Gold Bullish ?? Or On Going Waterfall !!!I'm seeing Gold will Be Drop Soon on Decemberr
Thanks Me Later

XAU/USD Today's Market OutlookGold remains supported by expectations of a Federal Reserve rate cut in December, with markets pricing an 80–87% probability of easing. Lower interest rates reduce the opportunity cost of holding non-yielding assets like gold, fueling bullish sentiment.
Additionally:
US Dollar weakness and geopolitical uncertainty continue to underpin demand.
Central banks and ETFs maintain strong buying momentum, adding structural support.
Risks: A stronger-than-expected U.S. economic data release or hawkish Fed tone could trigger a pullback toward key supports.
Gold is currently consolidating near $4,200–$4,250, after hitting an all-time high of $4,381 in October. Analysts project a bullish medium-term outlook, with forecasts ranging between $4,450–$4,950 in 2026, driven by central bank diversification and potential Fed cuts.
The Asian session range (4215 – 4256) has set the tone for today’s trading.
Bullish Scenario
Price must hold above the previous month’s high at 4246 to confirm bullish continuation.
If this level holds, I’ll wait for a break above the double top at 4256 to enter long positions.
Targets:
First: 4300
Second: 4380
Bearish Scenario
The support belt at 4225 – 4230 is critical.
If this zone fails early in the New York session, expect a move to:
Invade the Asian session bottom (4215)
Then extend all the way toward 4155

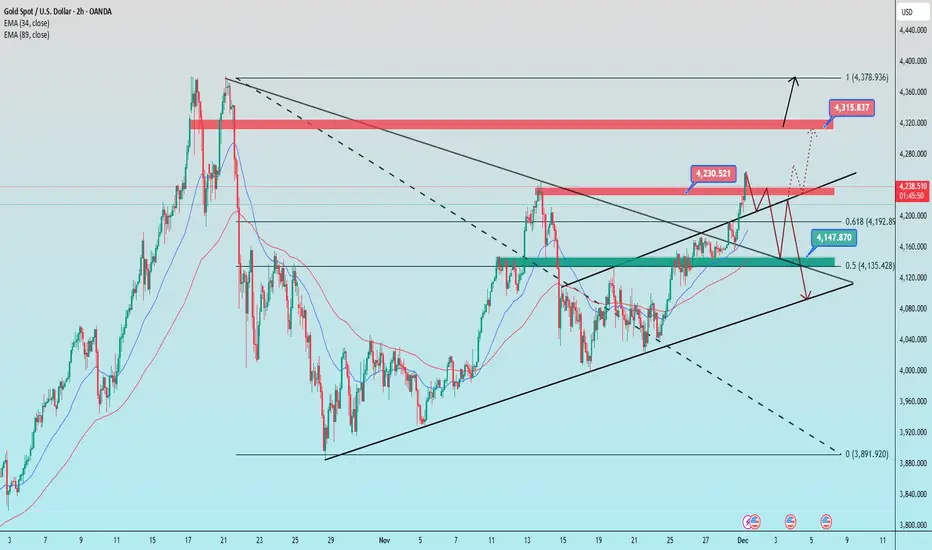
How did gold move in the first week of December? CONCISE & COMPREHENSIVE TECHNICAL ANALYSIS
1. Trend Lines
Ascending trend line (lower black line)
This is the main dynamic support of the current uptrend structure.
The price has bounced off this trend line several times → the short-term trend remains bullish as long as this line is not broken.
Major descending trend line (upper black line)
This is strong dynamic resistance on larger time frames, and the price recently touched this area.
This is an area where selling pressure frequently arises.
2. Support – Resistance
Resistance
4,243–4,245 (red zone):
This is the confluence of the previous peak and the descending trend line → selling pressure appears right in this area.
4,315–4,320 (next major resistance):
If this area is broken, the price will likely head towards 4,375–4,380.
Support
4.147–4.150 (green zone confluence):
Confluence of moving averages, the nearest swing low, and Fibonacci levels → important support that maintains the bullish structure.
4.105–4.120 (lower trendline):
If the price breaks through this area → the short-term trend has the potential to turn bearish.
3. Fibonacci
Fibonacci 0.618 = 4.194
→ Area with a high probability of a rebound if the price corrects.
Fibonacci 0.5 = 4.135
→ Confluence with strong support + trendline → potential buy zone if a deeper pullback occurs.
4. Price Scenarios
Scenario 1 – Continue Upward (Priority)
If the price remains above 4,200–4,215, there is potential for a retest:
➡️ 4,230 → 4,315 → 4,375
Scenario 2 – Downward Correction
If the price breaks through 4,190 and breaks through the green zone of 4,144–4,150, then:
➡️ Risk of a downward movement towards the 4,105–4,120 trend line
📌 Trading Plan
BUY GOLD: 4,148 – 4,250
Stop Loss: 4,138
Take Profit: 100–300–500 pips
SELL GOLD: 4,313 – 4,315
Stop Loss: 4,325
Take Profit: 100–300–500 pip
Gold Holds Strong Inside Trend Channel,Prepares for New ATH PushGold continues to maintain impressive bullish momentum, trading steadily within its rising trend channel. With structure firmly supported and macro sentiment leaning dovish, the market appears to be positioning for a new short-term ATH if liquidity aligns.
📊 Technical Outlook (M30 – MMF Flow)
Gold has respected the ascending channel perfectly, with each corrective leg finding buyers along channel midline and lower boundary.
The most recent impulse broke through the 4,23x region before pulling back into local liquidity.
Key Liquidity Zones
4,236 – 4,254 → Short-term supply reacting
4,218 – 4,220 → Minor demand zone
4,196 – 4,199 → Major BUY Zone (channel support + imbalance fill)
Market structure remains bullish as long as price holds above 4,196, the confluence level where:
✔️ Demand zone
✔️ Trend channel support
✔️ Fibonacci retracement
all align.
A clean bounce from this zone could trigger the next expansion leg.
🎯 MMF Trading Plan – BUY Priority
Scenario 1 – Continuation Bounce
Entry (Buy): 4,218 – 4,220
SL: 4,210
TP: 4,254 → 4,272 → 4,281
Scenario 2 – Strong Liquidity Sweep BUY (Preferred for RR)
Entry (Buy): 4,196 – 4,199
SL: 4,188
TP: 4,236 → 4,254 → 4,281
SELL Trades
Only scalp sells at supply zones
(4,254–4,257 / 4,281–4,283)
→ Not a main strategy while trend remains bullish.
⚜️ MMF View
Gold is showing healthy bullish structure, with clear liquidity engineering and controlled corrections.
As long as price stays within the trend channel and above 4,196, the path of least resistance remains up.
A breakout toward 4,281+ is highly likely before any deeper correction.
“In bullish markets, the best trades come from buying the dip—never chasing the pump.”XAU/USD – Gold Holds Strong Inside Trend Channel, Prepares for New ATH Push
Gold continues to maintain impressive bullish momentum, trading steadily within its rising trend channel. With structure firmly supported and macro sentiment leaning dovish, the market appears to be positioning for a new short-term ATH if liquidity aligns.
📊 Technical Outlook (M30 – MMF Flow)
Gold has respected the ascending channel perfectly, with each corrective leg finding buyers along channel midline and lower boundary.
The most recent impulse broke through the 4,23x region before pulling back into local liquidity.
Key Liquidity Zones
4,236 – 4,254 → Short-term supply reacting
4,218 – 4,220 → Minor demand zone
4,196 – 4,199 → Major BUY Zone (channel support + imbalance fill)
Market structure remains bullish as long as price holds above 4,196, the confluence level where:
✔️ Demand zone
✔️ Trend channel support
✔️ Fibonacci retracement
all align.
A clean bounce from this zone could trigger the next expansion leg.
🎯 MMF Trading Plan – BUY Priority
Scenario 1 – Continuation Bounce
Entry (Buy): 4,218 – 4,220
SL: 4,210
TP: 4,254 → 4,272 → 4,281
Scenario 2 – Strong Liquidity Sweep BUY (Preferred for RR)
Entry (Buy): 4,196 – 4,199
SL: 4,188
TP: 4,236 → 4,254 → 4,281
SELL Trades
Only scalp sells at supply zones
(4,254–4,257 / 4,281–4,283)
→ Not a main strategy while trend remains bullish.
⚜️ MMF View
Gold is showing healthy bullish structure, with clear liquidity engineering and controlled corrections.
As long as price stays within the trend channel and above 4,196, the path of least resistance remains up.
A breakout toward 4,281+ is highly likely before any deeper correction.
“In bullish markets, the best trades come from buying the dip—never chasing the pump.”

XAU/USD – Gold Accumulating Before Rising, Monitor BUY at📊 Market Structure
Gold is in an accumulation phase after a short-term drop creating ChoCH at lower price levels.
The current structure shows that the price has formed an Equal High (EqH) around 4,235 – a sign that the market may be holding liquidity above to support the next push.
The price returns to test the area 4,192 – 4,193 USD — this is the nearest support zone, and also the point where previous buying pressure created an upward BoS . If this area continues to hold, the short-term upward structure will be reactivated.
💎 Key Technical Zones
• Support Zone (Buy Zone): 4,192 – 4,193 USD
• Invalidation: below 4,170 USD
• Target 1: 4,237 USD
• Target 2: 4,249 USD
• Target 3: 4,264 USD
• Target 4: 4,284 USD
• Liquidity Zone: 4,323 USD
🎯 Trading Plan – BUY Priority
1️⃣ BUY Setup – Retest Support 4,192
If the price retests the area 4,192 – 4,193 and a bullish candlestick signal appears (rejection / engulfing):
• Entry: 4,192 – 4,193
• SL: 4,170
• TP1: 4,237
• TP2: 4,249
• TP3: 4,264
• TP4: 4,284
• TP5: 4,323 (sweep liquidity EqH)
→ This is a setup in line with the short-term trend, as liquidity above the EqH peak remains and is likely to be swept.
2️⃣ SELL Scalp – For Intraday Traders Only
If the price retests higher resistance zones and reacts with a strong decline:
• Waiting SELL Zone:
– 4,249
– 4,264
– 4,284
• Short TP: back to 4,225 – 4,216
→ This setup only trades against the trend when clear rejection is observed.
🧠 Vincent’s View
The current trend still supports the continuation of the upward expansion.
The 4,192 USD area is crucial: holding this area → prioritize BUY; losing this area → the market will need to sweep deeper before rising again.
⚡ “Follow the liquidity — the market always returns to collect what it left behind.”
⏰ Timeframe: 1H
📅 Update: 03/12/2025
✍️ Analysis by: Captain Vincent

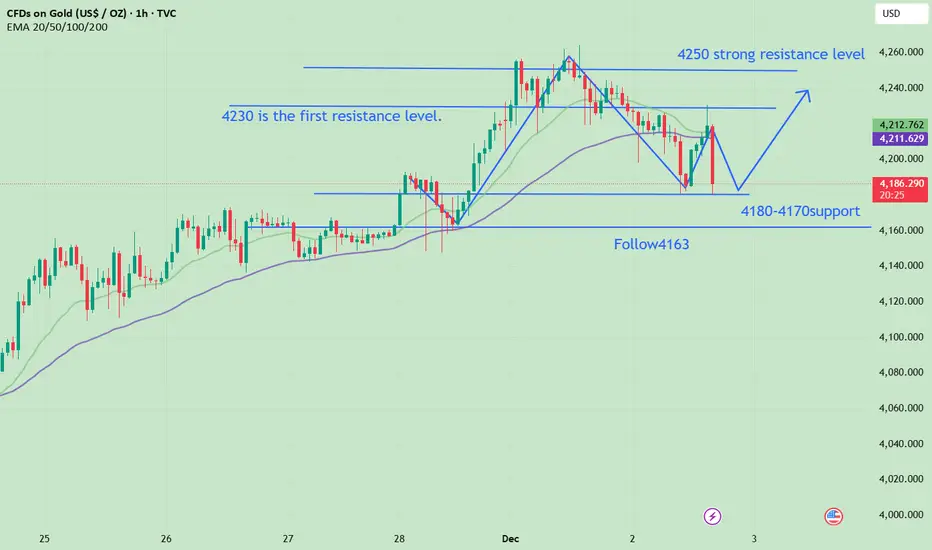
Is Gold Pulling Back or Remaining Bullish?Gold is once again exhibiting a typical bottom-rebound pattern. After falling to a low of around 4181 during the day, it quickly stabilized and began to rebound. Gold's movement during the US trading session was consistent with our predictions, touching 4230 but failing to break through and hold. We once again seized the opportunity, with our short positions yielding substantial profits. We will continue to look for buying opportunities at lower levels. Gold bulls still have the potential for further gains, but this should not be a blind pursuit of the rally. Looking at the 4-hour chart, key resistance levels are at 4230 and 4250, two important resistance areas that bulls must break through. On the downside, the support level at 4180-4170 is our first entry point for long positions, while also paying attention to a break below 4163, which is the core support level in the current structure. As long as this level holds, the bullish momentum will remain intact, and the overall trend will continue to develop upwards within the range. The more thorough the pullback, the clearer the opportunity.
I only focus on short-term trading and clear market analysis. In short-term trading, there is no market that goes up or down forever, only the right entry point at the present moment. Find your rhythm and follow the trend. That's the essence of trading. Currently, you must seize every opportunity to buy on pullbacks. If you're struggling to execute trades precisely, try my method: first test the market with a small position, then add to your position on pullbacks. This way, you won't miss any opportunities. If you need to recover significant losses or obtain precise trading signals, find the channel entry and contact me. Let's work together to flexibly and steadily pursue greater profits in the ever-changing market!
XAU/USD: Buy Gold on Support Retest, Bullish StructureGold continues to fluctuate within a compression model + ascending support, indicating that selling pressure is weakening and the market wants to accumulate before bouncing to the upper supply zones.
Recent data shows USD cooling as the market increases expectations that the FED will be more dovish → creating a support base for XAU/USD's short-term rise.
📊 Technical Analysis – H1 Frame (MMF Flow)
1️⃣ Key Support:
4,187 – 4,188: BUY zone + lower trendline + strong price reaction.
Price just retested and bounced → confirming active buying remains.
2️⃣ Near Resistance:
4,211 – 4,212: mid-liquidity zone → expected to create HL before breaking the downtrend line.
3️⃣ Main Target Zone:
4,236 → strong resistance, confluence multiple times from the market.
Further: 4,254 → large supply zone, is an extended target if price breaks out.
🧭 Trading Scenario According to MMF
Main Scenario – BUY with Trend
BUY again when price retests 4,187 – 4,188 or
BUY when price breaks 4,212 then retests.
TP Targets:
TP1: 4,212
TP2: 4,236
TP3: 4,254
SL: below 4,182.
Idea: price creates an absorption model + HL on trendline → potential to pull up to the upper liquidity zones.
Secondary Scenario – SELL Reaction
Only for scalp traders:
SELL reaction at 4,236 – 4,238
TP: 4,212
SL: 4,243
🎯 Daily Bias Summary
Bias: Bullish on H1 when price holds 4,187.
Priority: BUY at the bottom – SELL at the top only for scalp.
Wait for the downtrend line to break to extend the target to 4,254.

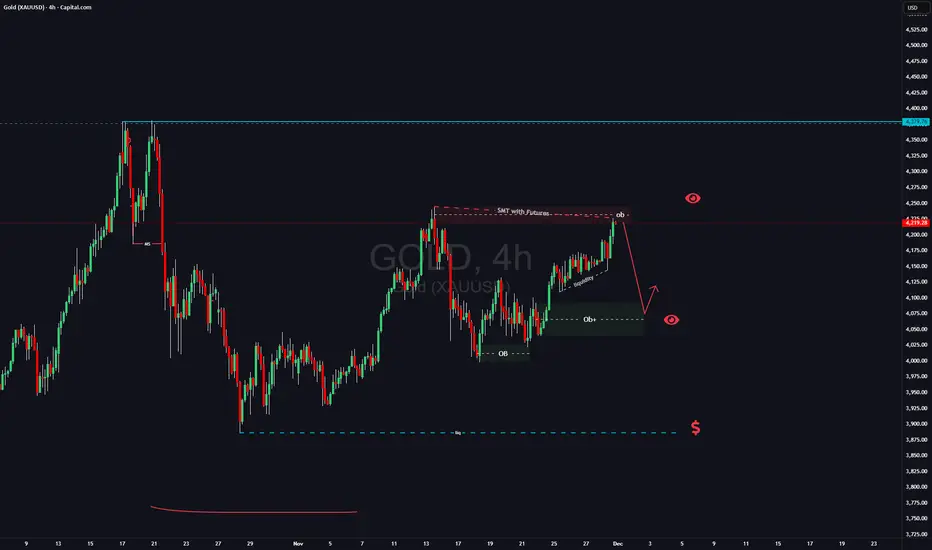
GOLD SETUP: The Liquidity Grab That Could Change Your Month!There is intresting situation on Gold right now:
1) There is SMT with futures(on futures price went higher than previous high from November 13th
2) Have a lot of liqudiity down below which usually means that this liqudiity will be taken
3) strong uptrend on LTF
taking in consideration these factors and that it will be beginign of the month on Monday i will be looking for manipulation at market opening. If i see trend shift on LTF i will be looking for short position till 4110 area (4h OB) , if this wont happen i simply gonna skiip trading GOLD this week.
When price action is not clean and when its hard to see clear picture better to avoid such trade and just watch.
Like and follow if you like my analysis
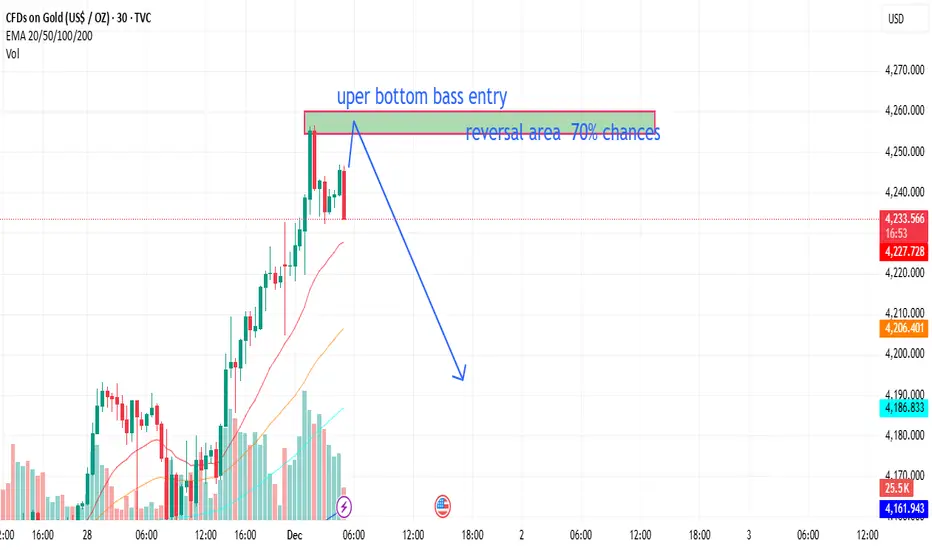
“Price Reaction Zone Observation”“Price is approaching a previously marked reaction area. I’m only monitoring how the structure behaves here for a possible pullback. This is not a signal—just sharing my personal chart observation.”
XAUUSDHello Traders! 👋
What are your thoughts on GOLD?
Gold continues to trade in a range-bound and choppy structure, showing back-and-forth movement with no clear directional bias in the short term.
In the current zone, price is trapped between channel resistance and key support, and a breakout from either side will determine the next strong move.
We expect gold to form a short-term upward correction toward the upper boundary of the descending channel and the resistance zone.
Once price reaches this area, a bearish rejection is likely, leading to a continuation of the downward trend toward lower support levels.
If gold breaks below the 4050 support zone and the daily candle closes below this zone,
this will confirm further downward continuation without any bullish pullback, signaling a stronger bearish wave.
As long as gold remains below the resistance zone and channel top, the short-term bias stays bearish.
Any upward movement is likely to be corrective, providing a potential setup for continuation to the downside.
Don’t forget to like and share your thoughts in the comments! ❤️

XAUUSD (Gold) Short Signal – 4H / 15M ConfirmationXAUUSD (Gold) Short Signal – 4H / 15M Confirmation
Massive rejection from the 4,250–4,260 supply zone + bearish structure break on lower timeframes.Entry: 4,235 – 4,240 (sell limit) or aggressive market sell on retest of the zone
Stop Loss: 4,262 (above the supply zone & today’s high)
Take Profit 1: 4,200
Take Profit 2: 4,180
Take Profit 3 (runner): 4,150–4,140 zone
Risk-Reward: 1:3 to 1:7+ depending on targetReason: Clean double-top rejection, strong bearish close below 4,240, momentum fully shifted lower, USD regaining strength.This is NOT financial advice.
Trade at your own risk. Always use proper money management and your own analysis.#XAUUSD #Gold #GoldShort #Forex #Trading #TechnicalAnalysis #PriceAction #BearishGold #ForexSignals Kill it or get killed by it – manage your risk!

GOLD, silver climb as Fed enters decisive phaseOANDA:XAUUSD and OANDA:XAGUSD began December with sharp moves, reflecting the intersection of U.S. monetary policy expectations, weak growth pressure, and rising defensive sentiment across global markets.
Spot gold touched USD 4,264/oz, the highest level in six weeks, while silver surged to USD 58.82/oz, marking a historic record. This price momentum is driven not only by a weakening U.S. dollar and prospects of rate cuts, but also by strategic repositioning among funds ahead of a data-heavy week.
Rate-cut expectations have become the central catalyst, with markets pricing in a near-certain reduction in December. Dovish remarks from Fed officials—from Waller to Williams—together with soft manufacturing data reinforce the argument that growth risks are rising faster than inflation risks. Gold has reacted quickly, especially as the Dollar fell to a two-week low before recovering slightly.
Silver, meanwhile, is following a completely different trajectory. Since the start of the year, silver has risen over 100%, benefiting from both safe-haven demand and industrial demand—particularly from electronics and solar energy. Silver’s high sensitivity to policy expectations, combined with speculation about a more dovish-leaning Fed under potential new leadership, is making it difficult for the market to find equilibrium. The fact that White House economic adviser Kevin Hassett is viewed as a possible Fed Chair nominee further increases downward pressure on the Dollar—an effect silver responds to even more strongly than gold.
At the same time, U.S. PMI manufacturing data continues to show economic fatigue, with the November index falling to 48.2, marking the ninth consecutive month below the 50 threshold. Declining new orders, rising input costs, and increasing import-tariff risks are creating a more challenging policy environment for the Fed. And all of this comes just as markets await a wave of high-impact data: ADP employment, and PCE inflation, the Fed’s preferred metric.
In the bond market, a sharp adjustment took place following comments by BOJ Governor Kazuo Ueda, who hinted at possible rate hikes—rare after decades of ultra-easing. Japanese yields surged, transmitting upward pressure to U.S. bonds: the 10-year Treasury yield jumped to 4.096%, the strongest move since mid-July. Meanwhile, U.S. corporations like Merck returning to the market with large bond issuances (USD 8 billion) forced dealers to sell Treasuries for hedging, amplifying volatility.
Another layer of uncertainty comes from the search for the next Fed Chair, with expectations that the White House will make a decision before Christmas. Traders are closely monitoring this because it directly influences the rate path for 2026. The Dollar just had its worst week in four months, and a dovish appointment could extend the decline.
On the geopolitical front, the White House expressed “cautious optimism” about reaching a resolution to the Russia–Ukraine conflict following discussions with Ukrainian officials in Florida. While these signals slightly reduce systemic risk, they remain insufficient to reverse safe-haven demand for precious metals.
I believe the gold–silver market is entering a high-volatility phase, but the bullish structure remains intact.
Rate-cut expectations, a weaker Dollar, and soft economic data continue to form the three core pillars supporting prices. However, rising bond yields and uncertainty over Fed leadership may interrupt the upward momentum in the short term. Powell’s speech this week will serve as an important guidepost, particularly for Q1 2026 rate expectations.
From a strategic perspective, investors should closely monitor employment data, PCE, and bond-market dynamics. In an environment where the monetary-policy cycle is pivoting, gold remains a portfolio hedge, while silver continues to be the asset most reactive to market sentiment and macro expectations—high return, but also higher risk.
Technical analysis and suggestions to follow OANDA:XAUUSD
The main trend of gold remains structurally bullish. The series of higher lows (HL) and higher highs (HH) is intact, supported by the medium-term rising channel and the 0.236–0.382 Fibonacci retracement cluster is acting as a defensive zone. The price is currently trading around $4,223/oz, above the dynamic MA21 and maintaining the bullish market status.
Main Support Zones
• $4,128 – $4,130 (Fib 0.236): the nearest support zone and the boundary of the uptrend.
• $3,972 (Fib 0.382): stronger support; a break below would open a medium-term correction.
• $3,846 (Fib 0.5): the level that protects the large bullish structure.
Resistance – upside target
• 4,380 – 4,390 USD (Fib extension + upper limit of rising channel): next upside target if price holds above 4,128 USD.
• In case of strong momentum (RSI is recovering from the technical oversold zone), the possibility of price moving up to 4,450 – 4,500 USD is not excluded.
Bearish risk conditions
Correction risk is formed only when:
1. Price closes below 4,128 USD, signaling short-term weakness.
2. Breaks 3,972 USD, the mid-term bullish structure is violated, opening a downside zone to
o 3,846 USD,
o or deeper than 3,720 USD (Fib 0.618).
3. RSI fails to surpass the 50 zone.
If the above 3 conditions occur at the same time, the bullish momentum will temporarily lose its dominance.
SELL XAUUSD PRICE 4329 - 4327⚡️
↠↠ Stop Loss 4333
→Take Profit 1 4321
↨
→Take Profit 2 4315
BUY XAUUSD PRICE 4178 - 4180⚡️
↠↠ Stop Loss 4174
→Take Profit 1 4186
↨
→Take Profit 2 4192

GOLD BULLISH STRUCTURE : M15 Buy Setup Greetings 👋
Gold On M15 Setup Has Bullish The Reason Of Buying Thats Liquidity Has Been Sweeped And Have A Demand Zone To Buy Gold With Confidence And The Target 🎯 is Buy Side Liquidity We Are Trade On Liquidity Hold With Breakeven

Gold delivers my first Target of #4,252.80 markAs discussed throughout my Friday's session remark: 'My position: I have waited for Gold to deliver decent pullback and I found such on #4,185.80 Support test. I have engaged big Lot set of Buying orders (#4,177.80 Stop) and closed my orders on #4,202.80 extension. I will use this chance to congratulate Traders who followed my calls and had patience to hold the orders, well done / enjoy the Profits and have a great weekend!'
My position: I have made excellent Profits throughout Friday's session and spectacular Profits last night as Gold delivered #4,130.80 Gap, which I used and engaged #100 Lot Selling order there and closed on #4,118.80 delivering around #120k EUR Profits (remember every Gap has to be closed) and will not Trade for today's session anymore, very satisfied with Profits. On the contrary, I mentioned that #4,000.80 is and will represent Ultimate Bottom and 'floor' as I referred so if you Bought on #4,033.80 local Low's (then), you would be in excellent Profits by now as I expect #5,100.80 benchmark Price Target on Medium to Long-term on Gold. I have used #4,033.80 - #4,192.80 and utilized with engaging multi-Month Buying orders as I announced it many times on my recent ideas.

Gold on excellent break-outAs discussed throughout my yesterday’s session commentary: “ My position: After Profiting on multiple Medium-term Buying orders, I have turned now to more Intra-day calls as announced and am Buying Gold literally from #4,138.80 on multiple occasions and will continue to do so, and will Buy Big if #4,130.80 is delivered. I will not Sell Gold and my practical suggestion is to not Sell Gold at all costs.”
My position : I have engaged multiple Buying orders throughout yesterday’s session on #4,151.80 test and even though Volume was almost non-existent, I was well aware that Gold is Trading within Ascending Triangle and ready to deliver upside break-out. I have kept my order and on market opening Gold delivered slow but steady break1-out of #4,167.80 Resistance and I closed my set of aggressive Buying orders on #4,172.80 extension. I have re-Bought Gold this morning with #4,167.80 entry point and will continue Buying Gold from my key entry points. Congratulations on Profits and have a great weekend!

BUY NOW XAUUSD!!!!!Gold made a strong bounce off the sell side liquidity showing strong rejections from that zone confirming with a choch on a 1m to 5min tf am looking forward to see price maintain an uptrend stability from this zone till 4,264 target is completed.....

GOLD FREE SIGNAL|SHORT|
✅XAUUSD strong sweep into the supply zone triggered a premium-priced rejection, aligning with the ICT narrative shift for a short-term distribution leg targeting inefficiency below.
—————————
Entry: 4,215$
Stop Loss: 4,240$
Take Profit: 4,185$
Time Frame: 4H
—————————
SHORT🔥
✅Like and subscribe to never miss a new idea!✅

XAUUSD – Bullish ABC Pattern“Market is forming a bullish ABC structure. Wave C may continue upward if support holds.”

GoldXAUUSD
- Completed " 12345 " Impulsive Waves
- Symmetrical Triangle as an corrective pattern in Short Time Frame
- Break of Structure
- Bearish Channel as Long Time Frame
- Consolidation Phase

GOLD: Bearish Continuation & Short Signal
GOLD
- Classic bearish pattern
- Our team expects retracement
SUGGESTED TRADE:
Swing Trade
Sell GOLD
Entry - 4217.9
Stop - 4226.7
Take - 4201.0
Our Risk - 1%
Start protection of your profits from lower levels
Disclosure: I am part of Trade Nation's Influencer program and receive a monthly fee for using their TradingView charts in my analysis.
❤️ Please, support our work with like & comment! ❤️
