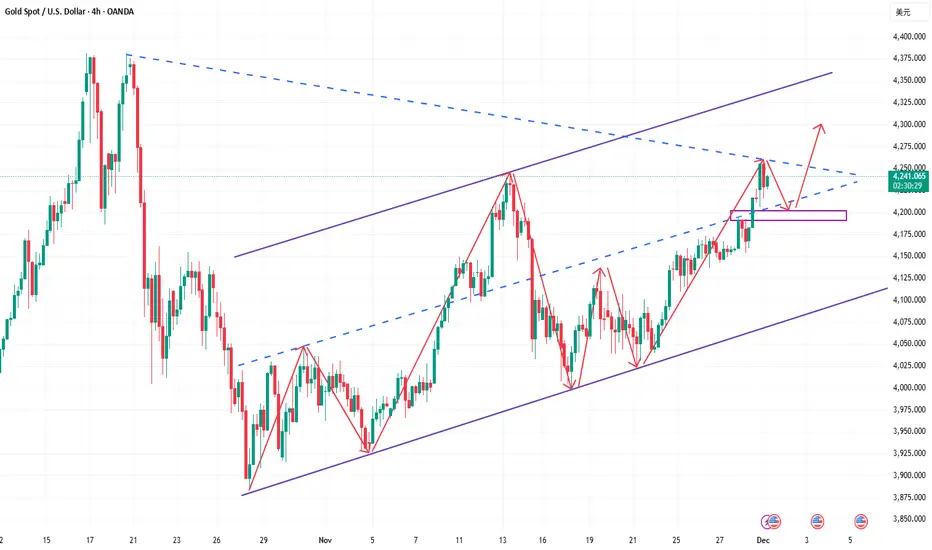
Gold 4H – Liquidity Plays Ahead of Fed Minutes & PMI Data🥇 XAUUSD – Weekly Smart Money Outlook | by Ryan_TitanTrader
📈 Market Context
Gold continues to trade inside a controlled 4H consolidation as markets brace for a highly event-driven week: U.S. PMI releases, updated Fed guidance, and renewed debates over the timing of future rate cuts.
Recent data has shown mixed momentum — softer employment trends but steady business activity — keeping the dollar volatile and gold reactive near mid-range liquidity.
Institutional flows remain cautious, reducing aggressive positioning ahead of major macro catalysts. This environment typically leads to engineered sweeps on both sides of the range as Smart Money hunts liquidity before revealing direction.
Expect short-term volatility spikes, especially around U.S. session opens and PMI releases.
🔎 Technical Analysis (4H / SMC View)
• Price is navigating a minor bearish structure, forming lower highs while protecting deeper liquidity beneath 4020.
• The recent 4H BOS + corrective pullback suggests the market may generate a liquidity grab toward the discount zone before any strong bullish leg develops.
• A Premium Sell Zone at 4225–4227 sits above resting liquidity, making it an ideal region for stop hunts and short-term distribution.
• The Discount Buy Zone at 4010–4008 aligns with structural reaction points, unmitigated demand, and a liquidity shelf — ideal for accumulation.
• Mid-range liquidity around 4060–4080 may be swept before the market chooses a larger weekly direction.
🟢 Buy Zone: 4010–4008
SL: 4000
TP targets: 4085 → 4120 → 4175 → 4220
Rationale:
• Deep discount zone beneath 4H liquidity
• Confluence of demand + structural mitigation
• High probability of engineered sweep before bullish expansion
🔴 Sell Zone: 4225–4227
SL: 4235
TP targets: 4175 → 4120 → 4060 → 4015
Rationale:
• Premium supply above equal-high liquidity
• Favors stop hunt + distribution before correction
• Aligns with previous 4H rejection and imbalance fill
⚠️ Risk Management Notes
• Wait for M15 ChoCH / BOS inside each zone before entering — avoid blind entries.
• Expect spreads and liquidity manipulation around news: US PMI, Fed speeches, and data surprises.
• Avoid trading 10–20 minutes before high-impact events.
• Scale partial profits at each structural target to secure gains and let runners develop.
✅ Summary
Gold remains trapped in a structured 4H range where Smart Money is likely to sweep one side before delivering a decisive expansion.
Discounted buys at 4010–4008 and premium sells at 4225–4227 remain the highest-probability weekly setups.
Stay patient, respect liquidity, and follow confirmation.
🔔 FOLLOW @Ryan_TitanTrader for more weekly SMC setups 🚀
Trade ideas

GOLD → Consolidation above 4220. Bullish structureFX:XAUUSD is trading in a narrow range around $4,200, maintaining sideways momentum ahead of US inflation data. The market confirms a bullish structure...
The probability of a Fed rate cut in December remains at ≈90%.
Mixed US employment data:
– Jobless claims fell to their lowest level since September 2022.
– Layoffs in November reached a two-year high.
The key benchmark today is the PCE index for September (data delayed due to the government shutdown).
Gold is awaiting new signals on inflation. Range trading is likely until the release of PCE data, which may set the direction of movement ahead of the Fed's decision.
Resistance levels: 4238, 4262
Support levels: 4220, 4183
If the bulls hold their ground above local support at 4220, we will have a chance to break through 4238 and retest 4262. However, a breakout of the trading range resistance could trigger a continuation of the rally towards the ATH.
Best regards, R. Linda!

Gold Buys only / never SellAs discussed throughout my yesterday's session commentary: 'My position: I have been Buying Gold aggressively from #4,222.80 Support throughout yesterday’s session many times and closing m orders as near as #4,242.80 Resistance. I Bought Gold this morning #4,185.80 aggressively as well with set of Buying orders. I will continue Buying aggressively above #4,208.80 Resistance is invalidated. #4,300.80 and #5,100.80 Medium-term Targets.'
Technical analysis: Practically I have nothing to add to the previous analysis as following the Double Bottom on Hourly 1 chart / Price-action has made a (marginal) new High’s on Hourly 4 chart above #4,227.80 Resistance for the fractal. If #4,227.80 - #4,232.80 gets invalidated on High Volume / on aggressive manner (last #3 attempts have been really anemic) then I can call a test of the #4,242.80 Resistance in extension. With the my instruments on Neutral levels I do not expect Selling sustainability on both Short and Medium-term. #4,230.80 local High’s got hit on my surprise Gold delivered aggressive #4,162.80 take-down which was recovered right away (well used it from #4,167.80 and Bought there), I am expecting the final extension wave of this parabolic run towards #4,300.80 Higher High’s Upper zone Technically. I believe this will be a major Resistance, but will necessarily cause a (# -1.00%) or (# -2.00%) pullback within new Monthly accumulation period. #4,152.80 - #4,162.80 zone is currently posing as an Support on Hourly 1 chart and values I mentioned above Resisting. I should mind our Risk tolerance as like I said this is most likely the final wave of the parabolic run that started recently, small stabilization then #5,100.80 benchmark test ahead.
My position: I am without any orders currently as current Neutral Rectangle belt is too idle to deliver any conclusions however my Profit from both Short and Medium-term orders is already excellent. I will attempt to Buy as Lower as I can from my key entry points.

Gold Sell SetupHi Everyone,
Hope you all are doing well,
I Prefer to get into sell as of now as per my analysis however later on it will be buy too. So will try to catch both the moves. (This is just my personal view and analysis & not any suggestions from my end to trade, its just for the educational purposes, rest you can do your own analysis).
Hope to get Green Pips.
Amen

[Short] XAUUSD Bearish Harmonic PatternFollowing the previous Long then Short Idea posted on Nov 25. The Long setup has hit the TP on Nov 28.
Bearish Harmonic Pattern is at completion. Will look to short around the 4220 level with an RR of around 1:3.5.

GoldXAUUSD
- Completed " 12345 " Impulsive Waves
- Change of Characteristics
- Bullish Channel as an corrective pattern in Short Time Frame and Long Time Frame
- Order Block
- Fibonacci Level - 78.60%

XAUUSDHello Traders! 👋
What are your thoughts on GOLD?
Gold continues to trade in a range-bound and choppy structure, showing back-and-forth movement with no clear directional bias in the short term.
In the current zone, price is trapped between channel resistance and key support, and a breakout from either side will determine the next strong move.
We expect gold to form a short-term upward correction toward the upper boundary of the descending channel and the resistance zone.
Once price reaches this area, a bearish rejection is likely, leading to a continuation of the downward trend toward lower support levels.
If gold breaks below the 4050 support zone and the daily candle closes below this zone,
this will confirm further downward continuation without any bullish pullback, signaling a stronger bearish wave.
As long as gold remains below the resistance zone and channel top, the short-term bias stays bearish.
Any upward movement is likely to be corrective, providing a potential setup for continuation to the downside.
Don’t forget to like and share your thoughts in the comments! ❤️

Gold Breakout, Record Highs in PlayGold has broken out of the bull pennant it’s been coiling within since late October, signalling a potential resumption of the prior bullish trend and a move back toward record highs. Bullish momentum is building, with RSI (14) pushing above 50 and MACD staging a bullish crossover, favoring long setups.
If the breakout holds, longs could be initiated above the downtrend with a stop beneath for protection, targeting 4245 initially—the high from November 13. Should the move extend beyond that level, the record highs may act like a magnet for price.
Good luck!
DS

THE KOG REPORT - UpdateEnd of day update from us here at KOG:
What a choppy day but the 15min structure played it's part giving us an opportunity to get in on that long trade based on the break of defence on the 4H. We've support there now and we're protected and managed, so for now we'll say we can't really add to anything up here apart from let's see if we hit that defence box over the Asian session.
We're more observing now than anything else, awaiting the close and then we'll plan for tomorrow if there is a decent set up. Still looking bullish but there is strong resistance just here and the extension level is slightly above, there is a huge chance of a RIP from one of those levels so caution is needed.
As always, trade safe.
KOG

What is the intention behind the surge in gold prices at theopenLast Friday, due to Thanksgiving, market liquidity was limited. It was expected that the market would close early and the price movement would be minimal. However, gold still broke strongly above 4200 before the close, reaching the 4220-4230 area before a strong finish. Nevertheless, the trading strategy for this week should not be to blindly chase the rally. The key focus now is on the short-term resistance zone of 4245-4260, which is the high point after gold rebounded from the strong support of 4000 on November 18th. It is also a key resistance level in this upward structure. From the 4-hour chart, this area shows very clear resistance. If the bulls cannot break through effectively in the short term, shorting at higher levels remains the preferred strategy. On the downside, the key support level to watch is the psychological level around 4200-4190. If it retraces and stabilizes without breaking through, it can be used as a reference area for short-term long positions. The overall strategy remains the same: if the resistance level holds, prioritize shorting at higher levels; if the support level holds, then look for pullbacks to go long. The trend is there, but timing is more important. Blindly chasing the rise is not a wise choice. Trading according to the structure and key points is the key to continuous stability. Continue to follow my rhythm this week. We make decisions with discipline, not let the market lead us.
How to properly seize gold trading opportunities?Gold Technical Analysis: Gold rebounded yesterday, finding support near the 5-day moving average, but as expected, it encountered resistance around 4230 and retreated to around 4195. Weaker-than-expected ADP non-farm payroll data caused another rebound to around 4241, but the price subsequently retreated again to around 4195. The daily chart ultimately closed with a bearish doji candlestick with an upper shadow. Reviewing yesterday's price action, although there was a rebound, it failed to break Tuesday's high, indicating market apprehension about Tuesday's bearish candlestick. The positive ADP data only pushed the high to around 4241, suggesting a weakening of bullish momentum. A short-term technical correction is possible. Based on the daily chart structure, the key support level to watch today is the 10-day moving average around 4180-4170, while the resistance level to watch is around 4230-4240.
Returning to the hourly chart, gold is currently trending upwards within a range. During the US session, consider a buy-on-dips strategy around the 4180-4170 area. If the previous high of 4230-4240 resistance fails to hold, then consider shorting. Plan your trade, trade your plan. There are no gods in this world; it's just about seeing one step ahead. When you've considered everything that might happen, victory is assured. In summary, today's gold trading strategy is to primarily buy on dips and secondarily sell on rallies. The key resistance level to watch in the short term is around 4230-4240, and the key support level is around 4180-4165. Please keep up with the pace.

Wait and see to avoid CME technology risks!Gold Technical Analysis: Since the beginning of this week, gold has been trending upwards in a volatile manner. After breaking through the high point of the 4110-4130 trading range, it formed a small, one-sided upward trend, currently approaching the 4200 level. The increase has not been significant, and the process has been tortuous, with continuous oscillating upward movement. Currently, supported by positive news, there is still room for short-term upward movement, but overall, the upside potential remains limited. Moreover, as mentioned before, this bullish move is likely to trap many investors. Therefore, a relatively conservative approach has been consistently advised. The extent of this upward movement is uncertain and depends entirely on the strength of the news. It may reach the previous high of 4245, or it may break through. However, even if it breaks through, it is still recommended that long positions exit rather than hold on. The area above 4200 is a risk zone for longs. Once the news direction changes, the decline will be faster than the rise; a rise may take two weeks, while a fall may only take three days.
Looking at the overall performance of gold, after consolidating yesterday, it opened higher today. However, such a rapid rise should not be chased, especially as it approaches $4200, where the upside potential is limited and the risk outweighs the potential profit. The key resistance level to watch in the short term is $4200, a level we have consistently emphasized. If it breaks above $4200, short-term bulls should consider exiting their positions. Short-term support lies in the $4155-$4150 area. If this support is reached, short-term traders can continue to follow the trend, but if it rallies further, take profits quickly, as there is a possibility of stagnation or a pullback above $4200. Due to Thanksgiving in the US, trading markets closed early, resulting in limited market activity during the US session. The market is expected to oscillate between $4150 and $4190, and this oscillation is likely to continue. Recently, neither bulls nor bears have shown sustained momentum. Watch the $4190-$4200 resistance level above and the $4150 support level below, and be aware of the risks. Today is the last trading day of November. We should be cautious about the current rise, as there is a possibility of a large-scale sweeping fluctuation at the monthly closing price. Therefore, even if we are bullish now, we should be cautious and not chase the rise.

Gold buy idea Gold Analysis
Gold stopped dropping since yesterday’s NY open. It continued falling during today’s Asia and London sessions, but failed to continue the drop into the Asia close, showing signs of weakening bearish momentum.
How to Trade It
1️⃣ Wait for price to drop to 4210
4210 is the closest psychological level and a key reaction zone.
2️⃣ Look for entry confirmation
At 4210, wait for either:
A bullish engulfing candle
A bullish pin bar
with above-average volume
This signals strong buyers defending the level.
If Price Does NOT Retrace to 4210
If gold continues rising without touching 4210, then:
Check the volume
If volume is above average, this confirms bullish continuation without a retest.
Targets
TP1: 4245
TP2: 4265
Invalidation
❌ If price drops to 4210 but none of the confirmations appear, do not take the trade.

XAUUSD: Gold Continues to Rise on Rate Cut ExpectationsGold continues its upward trend from yesterday, with the current price at 4,159.455 USD. The chart shows that gold is moving within a stable upward channel, and if it maintains above this support level, there is a high likelihood that the price will continue towards the 4,190,000 USD level.
Why is gold continuing to rise?
Weaker-than-expected U.S. retail sales data has reinforced the forecast that the U.S. Federal Reserve (Fed) will cut interest rates in December 2025. This has weakened the USD, which in turn reduces yields and increases gold's appeal as a safe-haven asset. These factors, combined with expectations of rate cuts, suggest that gold has the potential to continue rising sharply.
Next Scenario:
If the price of gold stays above the 4,120,000 USD support zone, there is a high probability it will break through the 4,190,000 USD resistance level. The potential for continued upward movement could push gold to 4,230,000 USD in the near future.
With strong support and a favorable market backdrop, XAUUSD is likely to continue this upward trend, especially as labor market data from the U.S. is released.

Are people still blindly chasing the rise in gold prices?
news:
Gold prices remained around $4,200 in early Asian trading on Thursday, as market bets on a potential rate cut by the Federal Reserve at its meeting next week intensified. Lower interest rates reduce the opportunity cost of holding non-interest-bearing assets, providing structural support for gold.
Weak US jobs data pushed the dollar lower, providing additional support for gold prices. The ADP report showed that US private sector employment fell by 32,000 in November, far worse than the revised increase of 47,000 in the previous month and also worse than the market expectation of a 5,000 increase. This was in line with our expectations, and gold remains in a downward trend.
U.S. initial jobless claims will be released on Thursday, while the PCE inflation indicator, which is more closely watched by the Federal Reserve, will be released on Friday. If the inflation data is unexpectedly strong, it could boost the dollar, thereby weakening gold prices in the short term.
Technical aspects:
The 1-hour chart shows that the recent pullback in gold prices has widened, causing the 4-hour RSI to revert from overbought levels. Currently, gold prices are stabilizing above the 20-day moving average support level on the 4-hour chart, further reinforcing the bearish bias on the 1-hour chart. A short-term pullback in gold prices may exacerbate short-term volatility; a cautious short-selling strategy is recommended for the day.
Strategy Signals:
Buy at 4209-4215, stop loss at 4227, target at 4190-4170.

Lingrid | GOLD Complex Correction Short SetupOANDA:XAUUSD is testing the 4,150 resistance zone, where price might form a potential fake break. The move stalled right at confluence between the red long-term resistance trendline and the ceiling of the range, signaling possible buyer exhaustion. Price is now slipping back beneath the broken breakout level, suggesting that momentum is shifting back in favor of sellers as intraday structure loses strength.
If bearish pressure continues, TVC:GOLD is positioned to rotate toward 4,095, with the broader correction where the next liquidity cluster sits. As long as price remains capped under 4,160, the downside scenario remains dominant, especially with markets awaiting key USD-driven macro catalysts (PPI) that could strengthen the dollar and weigh further on gold.
➡️ Primary scenario: rejection holds → drop toward 4,095.
⚠️ Risk scenario: a clean breakout above channel flips momentum and opens room toward higher levels.
If this idea resonates with you or you have your own opinion, traders, hit the comments. I’m excited to read your thoughts!

XAUUSD: Short-Term Bullish Momentum Build-UpGold continues to shape a constructive bullish sequence on the 4-hour timeframe, with recent price action showing controlled momentum as the market transitions into December. The developing structure reflects an ongoing buyer-driven phase, keeping the upside scenario active while the trend maintains its current rhythm.
Disclosure: We are part of Trade Nation's Influencer program and receive a monthly fee for using their TradingView charts in our analysis.

“Resistance Rejection → Bearish Pullback Toward Support🟡 GOLD (XAU/USD) – Bearish Rejection from Major Resistance 🟥📉
🔍 Key Technical Insights
Price rejected the major resistance zone around 4,245 – 4,255
Rising Support Line has been broken → signals weakening bullish momentum ❌
Current structure favors a pullback toward demand area
Market seeking liquidity below recent swing lows 💰
🎯 Suggested Targets (with stickers)
Target Type Price Area Sticker
TP1 → Support Retest 4,210 – 4,215 🎯
TP2 → Demand Zone 4,195 – 4,205 📉💰
📌 TP1 is your high-probability target
📌 TP2 is for extended move if bearish momentum continues ⬇️
📌 Trade Setup Idea
📍 Sell Entry Zone:
➤ 4,238 – 4,245 (after failed breakout)
❌ Stop-Loss:
➤ Above 4,255
🎯 Take Profit:
➤ TP1: 4,215 🎯
➤ TP2: 4,200 📉💸
🧭 Overall Market Outlook
Factor Bias
Short-term Trend Bearish Pullback 🔻
Liquidity Downside targets in focus 💧
Resistance Reaction Strong rejection 🚫

Downmove for goldHi traders,
Last week gold made a bigger upmove then expected. This changed the pattern for me. I think the correction (orange wave 4) is a Triangle that rejected from the 38.2 fib level.
So next week we could see a downmove. If it's corrective, we could see the next impulsive upmove.
If the upmove is corrective it could come down for the last time.
Let's see what price does and react.
Trade idea: Wait for a correction down and a change in orderflow to bullish to trade longs.
This shared post is only my point of view on what could be the next move in this pair based on my technical analysis.
But I react and trade on what I see in the chart, not what I've predicted or expect.
Don't be emotional, just trade your plan!
Eduwave

Gold prices continue to recover - above 4200⭐️GOLDEN INFORMATION:
Gold (XAU/USD) picks up fresh demand in Friday’s Asian session, rising to a two-week high as bulls target a move back toward $4,200. Growing expectations of a December Fed rate cut remain a major tailwind for the non-yielding metal, while a break above the $4,170–4,175 resistance zone has also fueled additional technical buying
⭐️Personal comments NOVA:
Continue to recover - break resistance and increase price. Gold price approaches resistance zone 4210 at the end of the week
⭐️SET UP GOLD PRICE:
🔥SELL GOLD zone: 4210 - 4212 SL 4217
TP1: $4200
TP2: $4185
TP3: $4170
🔥BUY GOLD zone: 4113 - 4115 SL 4108
TP1: $4130
TP2: $4140
TP3: $4160
⭐️Technical analysis:
Based on technical indicators EMA 34, EMA89 and support resistance areas to set up a reasonable BUY order.
⭐️NOTE:
Note: Nova wishes traders to manage their capital well
- take the number of lots that match your capital
- Takeprofit equal to 4-6% of capital account
- Stoplose equal to 2-3% of capital account

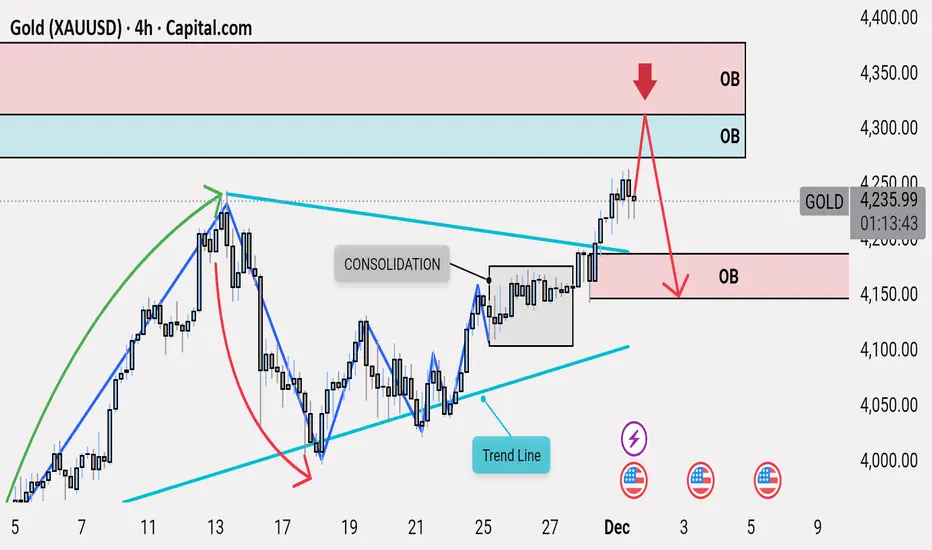
HIGH-PROBABILITY SELL | Upper Order Block RejectionThe market recently broke out of a consolidation zone, which had been holding price in a tight sideways structure. This breakout cleared the liquidity above the range, and price briefly surged past the trend line, showing temporary bullish momentum. However, this move is corrective within the broader bearish framework.
Price has now entered the imbalance region, leaving a clean Fair Value Gap (FVG) above, signaling inefficiency that the market is likely to revisit on the downside. Above this, the price is approaching a strong, unmitigated Upper Order Block — the key supply zone on the chart.
This Upper OB sits above the liquidity cleared during the consolidation breakout, making it the strongest potential rejection point. A reaction from this zone would likely trigger a sell-off back toward the Lower Order Block, filling the remaining FVG on the way down. This aligns with the original bearish structure, with the recent upward move being only a corrective retracement.
If the Upper OB holds, the expected move is a decline, making this a high-probability sell setup. Only a strong breakout above the OB with sustained closings would invalidate this bearish scenario.
ADP data will determine the $4,200 mark.
news:
In the crucial window leading up to the Federal Reserve's December interest rate meeting, the US November ADP employment data, to be released today, has become the market focus. Its performance will directly influence the short-term direction of gold prices, with bulls and bears fiercely battling around the $4200/ounce level.
ADP Data: The "Final Piece of the Puzzle" Influencing Fed Rate Cut Expectations
As a leading indicator of non-farm payroll data, this month's ADP data is far more important than ever. Due to the US government shutdown, the official employment reports for October and November will be postponed to December 16th, lagging behind the Fed's December 9-10 interest rate meeting. Therefore, today's ADP data will be a core reference for the Fed's policy decisions.
Technical aspects:
Looking at the 1-hour chart, the key resistance level to watch is 4240-50, while the short-term support level is around 4200, with a significant support level at 4175. Technically, the current consolidation suggests a tendency to short on pullbacks. We should patiently wait for key entry points. Specific trading strategies will be provided in the channel; please pay close attention.
Gold prices are still trading above the 5-10 day moving average, and the downtrend has not yet been broken. After the $4,200 level is lost, gold prices may face further declines.
Strategy Signals:
Buy: 4225-4230 Stop Loss: 4240 Target: 4200-4180

Gold Analysis Today: Continue Buying at 4210Gold Analysis Today: Continue Buying at 4210
As shown in the chart: Current Strategy:
Buy Price: 4210
Stop Loss: 4195
Take Profit: 4230-4260
Gold prices are currently in a consolidation phase. As long as the price remains above $4195, our current strategy is to buy on dips.
The $4180-$4200 range is undoubtedly a strong support area and will become the fulcrum for the next significant upward move.
I share real-time trading signals daily on my public channel, aiming to provide a learning platform for many confused traders. My trading strategy is very clear. Looking forward to your attention and cooperation.
