December 4th trading signals are here!No time to waste, let’s get straight to the trading signals. Keep an eye on this post to track the accuracy of my signals.
XAUUSD: Buy @ 4190-4200, TP 4230.
I’ll keep updating, stay tuned!
Trade ideas

Gold delivers my first Target of #4,252.80 markAs discussed throughout my Friday's session remark: 'My position: I have waited for Gold to deliver decent pullback and I found such on #4,185.80 Support test. I have engaged big Lot set of Buying orders (#4,177.80 Stop) and closed my orders on #4,202.80 extension. I will use this chance to congratulate Traders who followed my calls and had patience to hold the orders, well done / enjoy the Profits and have a great weekend!'
My position: I have made excellent Profits throughout Friday's session and spectacular Profits last night as Gold delivered #4,130.80 Gap, which I used and engaged #100 Lot Selling order there and closed on #4,118.80 delivering around #120k EUR Profits (remember every Gap has to be closed) and will not Trade for today's session anymore, very satisfied with Profits. On the contrary, I mentioned that #4,000.80 is and will represent Ultimate Bottom and 'floor' as I referred so if you Bought on #4,033.80 local Low's (then), you would be in excellent Profits by now as I expect #5,100.80 benchmark Price Target on Medium to Long-term on Gold. I have used #4,033.80 - #4,192.80 and utilized with engaging multi-Month Buying orders as I announced it many times on my recent ideas.
Gold Analysis Today: Continue Buying at 4210Gold Analysis Today: Continue Buying at 4210
As shown in the chart: Current Strategy:
Buy Price: 4210
Stop Loss: 4195
Take Profit: 4230-4260
Gold prices are currently in a consolidation phase. As long as the price remains above $4195, our current strategy is to buy on dips.
The $4180-$4200 range is undoubtedly a strong support area and will become the fulcrum for the next significant upward move.
I share real-time trading signals daily on my public channel, aiming to provide a learning platform for many confused traders. My trading strategy is very clear. Looking forward to your attention and cooperation.

idea for buy one idea for buy . i waiting for price to go down to 4.000. for long positions . at 4.000 is a big support volume , and is a perfect zone for long positions

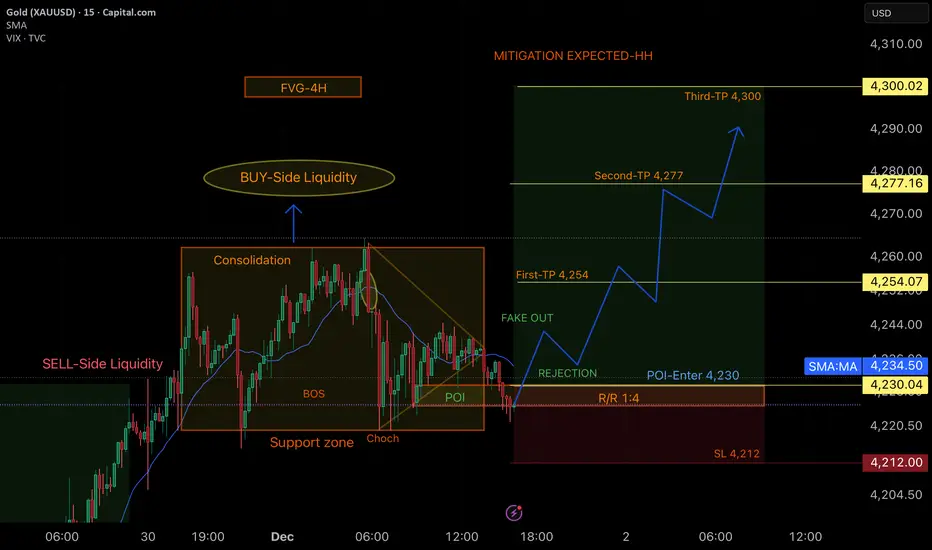
Bullish Analysis Gold-15M (SMC)Breakdown
On the 15-minute chart, I’m seeing a very clean accumulation → manipulation → expansion sequence that aligns perfectly with institutional behavior. 📈✨
The market first formed a consolidation range, building both buy-side and sell-side liquidity. 💧⬆️⬇️ After that liquidity was engineered, price delivered a Buy-Side Liquidity sweep, followed by a strong move down that broke structure, giving me a clear BOS and shortly after a CHOCH, signaling a potential shift in momentum. ⚡🔄
Once the shift was confirmed, price tapped directly into my POI at 4,230, which aligns with an order block and a previous support zone that has shown strong reactions. 🎯📍 This is the level I’m interested in for entries because institutions often return here to mitigate before starting their expansion phase.
Inside this POI we got a small fake out, followed by a clean rejection, confirming the setup. From here, I project a bullish move with a 1:4 R/R, protected with a stop-loss at 4,212. 🛡️📊
I set three take-profit levels based on liquidity and imbalances:
• TP1: 4,254 → first reaction zone & nearby liquidity. 🥇📌
• TP2: 4,277 → unmitigated imbalance and previous liquidity. 🥈📈
• TP3: 4,300 → expected mitigation at the previous higher highs; major liquidity target. 🥇🎯✨
My bullish bias remains intact as long as price respects the POI. Liquidity, structure, and the unmitigated 4H FVG above all support the idea of price pushing toward those higher highs. 🚀💚
💬 Motivational Message
Every analysis—win or loss—brings you one step closer to mastery.
Trust your process, stay disciplined, and remember: the market rewards those who stay consistent even when the setup takes time.
You’re leveling up every single day. Keep pushing.
GOOD LUCK TRADERS…. 💪🔥📈

GOLD Trade Plan 04/12/2025ِDear Traders,
XAUUSD – Multi-Channel Structure, Liquidity Sweep Expectations & Bullish Continuation Setup
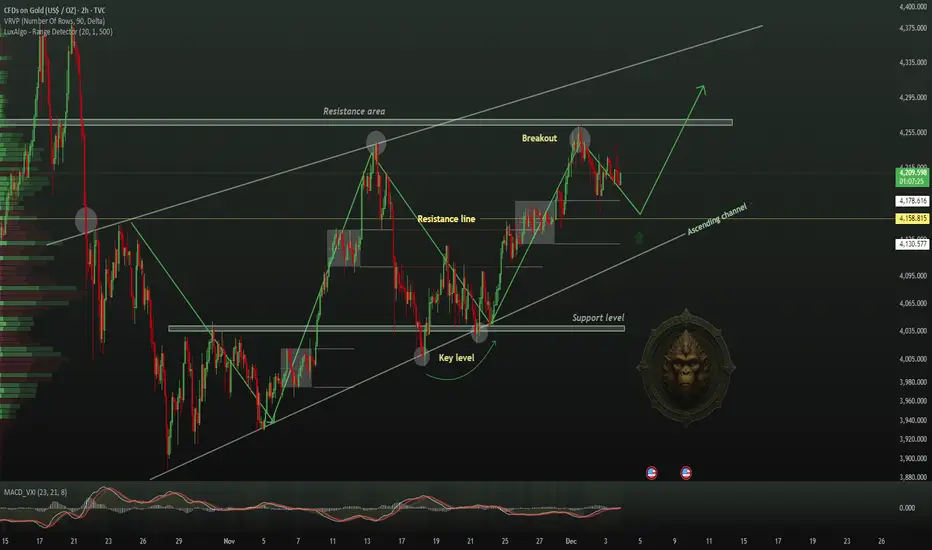
Gold continues to trade within a well-defined ascending channel structure on the 4H timeframe. Price has consistently respected both the major blue trend channel and the inner black median channel, showing a clean pattern of higher highs and higher lows. Each previous touch of the lower boundary (marked by arrows on the chart) has generated a strong bullish reaction, confirming active demand in these regions.
1. Market Structure
Price is currently positioned near the midline of the inner black channel, where short-term consolidation is developing. This type of ranging behavior after a strong bullish leg is typical before another expansion phase. As long as the major lower blue boundary remains intact, the broader structure remains strongly bullish.
2. Expected Liquidity Sweep Before Moving Higher
Based on recent price action, I expect the market to temporarily break below the minor trendline inside the channel. This corrective move would allow price to:
Collect liquidity below the local swing lows
Fill inefficiencies within the channel
Retest the mid to lower boundary of the major ascending channel
Only after this liquidity sweep do I expect gold to resume its upward trajectory.
3. Key Buy Zones (Entry Levels)
The following levels inside the channel provide the highest probability for a bullish reaction:
4189 – 4200 → First area of interest (mid-channel support)
4175 → Deeper liquidity grab area
4163 → Critical structural level; the uptrend remains intact as long as this level is not broken
If price retraces into these zones with declining momentum and shows bullish rejection, these areas offer attractive opportunities to position long within the trend.
4. Trendline Break & Reaction
A break of the inner trendline is expected but should not be viewed as a bearish trend reversal. Instead, it would act as a liquidity event, resetting the market before bulls regain control. The dotted projection on the chart represents the expected recovery path back toward the upper band of the channel.
5. Upside Targets
Once the liquidity sweep completes and bullish momentum returns, the next upside objectives are:
First Target: 4220
Second Target: 4256
Extended Target: Retest of the upper black channel (~4300+)
Macro Target: Upper boundary of the major blue channel (toward 4400)
Momentum confirmation on the break of 4220 will strengthen the bullish continuation outlook.
6. Bias Summary
Primary Bias: Bullish
Condition: Bullish structure remains valid above 4163
Tactical Plan: Wait for liquidity sweep into the lower zones → enter long → target upper channel
Gold remains in a strong uptrend, and any controlled pullback into support is likely to be accumulated by buyers.
Regards,
Alireza!

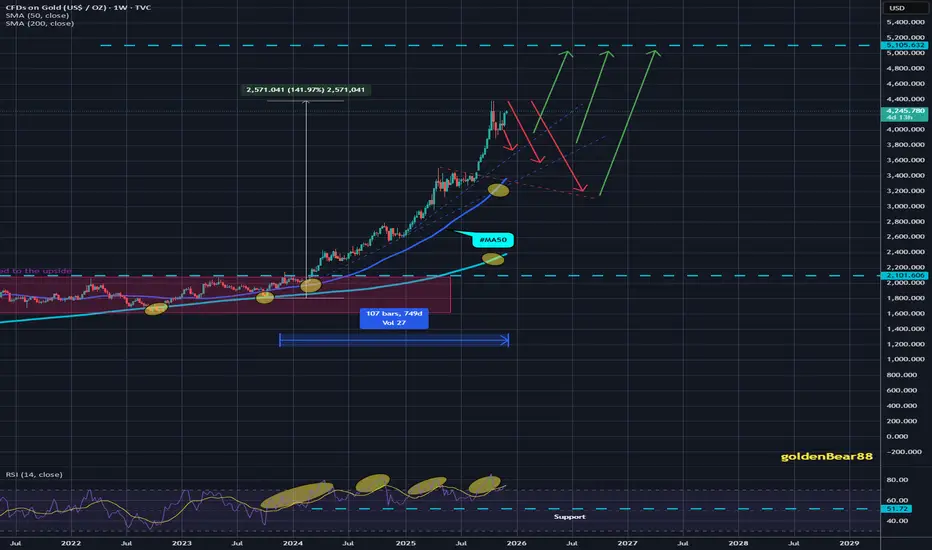
GOLD breaks out of accumulation phaseOANDA:XAUUSD has moved from a consolidation phase to an active bull run: spot is trading around ~$4,200/oz, supported by expectations of Fed easing (markets are pricing in ~89% probability of a 25bp cut in December), central bank buying and a still uncertain geopolitical backdrop. In this context, a $5,000/oz target is no longer a pipe dream but a conceivable scenario, but only if a number of technical and fundamental conditions align.
Analysis (fundamentals — geopolitics)
1. Fundamentals: Central banks’ net buying (WGC: strong net buying), a weaker USD and falling real Treasury yields are the three fundamentals supporting gold. Recent weak US economic data (weak manufacturing PMI, ADP and PCE potentials reinforce cooling sentiment) push the market to price in higher interest rate cuts, reducing the opportunity cost of holding gold.
2. Geopolitics: Russia-Ukraine negotiations remain uncertain; regional tensions (Middle East, US-Venezuela relations…) maintain safe-haven demand. External shocks could spur rapid and strong demand for gold.
Conditions for the $5,000 scenario (necessary & sufficient)
• Necessary: The Fed makes at least one 25 bps cut in the near term (December) or the market is certain of a rate cut cycle; real yields continue to fall; the USD remains weak; the central bank continues to buy net.
• Sufficient: Price breaks the $4,216–$4,226 resistance zone on higher than average volume, accompanied by a sustained decline in real yields (-real basket) and no sharp reversal in the USD. When all three factors (technical break, real yield decline, sustained official demand) are present, the $5,000 target becomes a trackable possibility in the medium-long term.
Risks
Bear case risks include: the Fed unexpectedly takes a hard/clear stance without cutting, the USD strengthens again (e.g. due to better employment data), or market liquidity declines leading to massive profit-taking by funds. These factors could push gold back below $4,000 and break the short-term bullish structure.
In summary, the journey to $5,000 is a structurally plausible scenario: the macro fundamentals and the official demand flow are tilted to the upside, but that scenario will only be triggered by a volume-driven technical breakout combined with a sustained decline in real yields. I maintain a cautiously positive stance, closely monitoring the underlying geopolitical developments and yield developments to assess the sustainability of this rally.
Technical analysis and recommendations OANDA:XAUUSD
Gold price is maintaining a clear bullish structure as it continues to follow the medium-term rising channel and holds the important support zone around 4,128 – 4,130 USD/ounce (Fibo 0.236). The price continuously making higher lows and bouncing back above the short-term MA shows that active buying power is still dominant. The most recent candlestick pattern shows strong absorption at the support zone, implying that money flow is protecting the uptrend.
With no break below 3,973 USD/ounce (Fibo 0.382), the bullish structure continues to be consolidated. The next target of the current cycle is 4,300 – 4,380 USD/ounce, corresponding to the top of the rising channel and the extended Fibo zone. RSI is recovering from the neutral zone, showing that the upside momentum still has room to grow.
SELL XAUUSD PRICE 4277 - 4275⚡️
↠↠ Stop Loss 4281
→Take Profit 1 4269
↨
→Take Profit 2 4263
BUY XAUUSD PRICE 4191 - 4193⚡️
↠↠ Stop Loss 4187
→Take Profit 1 4199
↨
→Take Profit 2 4205

Gold prices continued their upward trend, approaching $4,300.
news:
Gold prices (XAU/USD) remained in a positive range around $4230 during Monday's Asian trading session. This rebound was primarily driven by widespread market expectations that the Federal Reserve might cut interest rates at its December 9-10 meeting.
Weaker-than-expected US economic data, coupled with dovish statements from several officials, further strengthened market bets on monetary easing.
"Against the backdrop of easing geopolitical tensions, gold prices are driven more by interest rate expectations than by their traditional safe-haven attributes."
Technical indicators:
From a daily chart perspective, the current price is consolidating strongly above $4240, exhibiting characteristics of "high-level oscillation within an uptrend."
The moving average system remains in a bullish alignment, with the 20-day moving average providing significant support. The price has repeatedly tested this moving average and stabilized, indicating strong short-term buying resilience.
Regarding momentum indicators, the RSI remains in the mid-to-high range but has not entered extreme zones, suggesting that the trend continues, but upward momentum has slightly slowed. If the price breaks through the upper edge of the recent consolidation range, a new round of upward movement is likely; however, if it falls below the 20-day moving average, it may retest the previous strong support zone and enter a wide-range oscillation pattern.
Overall, the daily chart remains bullish, but the upward pace is shifting from a one-sided advance to a slower climb.
Strategy Signals:
BUY:4215-4220 SL:4205 TP:4265,4280

Gold Continues Decline After Breaking Support at 4224📊 Market Overview:
Gold continues to face pressure as the USD shows slight recovery and safe-haven demand withdraws. After reaching 4256 earlier this morning, gold dropped sharply and is now trading around 4218, indicating that selling pressure dominates in the short term.
________________________________________
📉 Technical Analysis:
• Key Resistance: 4224 – 4232 | 4250 – 4256 (mid-term)
• Nearest Support: 4208 (mid-term) | 4198 (deep support)
• EMA (09): Price is below EMA09, confirming a prevailing bearish trend.
• Candles / Momentum: Consecutive long red candles appear, with strong downward momentum; no rejection candle observed around 4215 → downside risk remains high.
________________________________________
📌 Outlook:
Gold may continue to decline in the short term if the price breaks 4215 with a strong candle. Conversely, if a clear rejection appears at 4215, gold could see a technical rebound toward 4230 – 4235.
________________________________________
💡 Trade Ideas:
🔻 SELL XAU/USD at: 4235 – 4238
🎯 TP: 40 / 80 / 200 pips
❌ SL: 4241
🔺 BUY XAU/USD at: 4198 – 4195
🎯 TP: 40 / 80 / 200 pips
❌ SL: 4192

Excellent week closingAs discussed throughout my morning's commentary: 'My position: I have engaged multiple Buying orders throughout yesterday’s session on #4,151.80 test and even though Volume was almost non-existent, I was well aware that Gold is Trading within Ascending Triangle and ready to deliver upside break-out. I have kept my order and on market opening Gold delivered slow but steady break1-out of #4,167.80 Resistance and I closed my set of aggressive Buying orders on #4,172.80 extension. I have re-Bought Gold this morning with #4,167.80 entry point and will continue Buying Gold from my key entry points. Congratulations on Profits and have a great weekend!'
My position: I have waited for Gold to deliver decent pullback and I found such on #4,185.80 Support test. I have engaged big Lot set of Buying orders (#4,177.80 Stop) and closed my orders on #4,202.80 extension. I will use this chance to congratulate Traders who followed my calls and had patience to hold the orders, well done / enjoy the Profits and have a great weekend!

GoldGold possibly circle entrapment ...........
If price respect this curve body resistant ...more up side view

GOLD BUY | Idea Trading AnalysisGOLD is moving in an ascending channel and creating symmetrical triangle and is moving in a descending AND is moving in an UPWARD channel.
We expect a decline in the channel after testing the current level.
Hello Traders, here is the full analysis.
I think we can soon see more fall from this range! GOOD LUCK! Great BUY opportunity GOLD
I still did my best and this is the most likely count for me at the moment.
-------------------
Traders, if you liked this idea or if you have your own opinion about it, write in the comments. I will be glad
Gold market daily projection Gold market opened the Asian session at 4204, initially moved to mitigate 4229.
Price has since revisited 4205, breaking the earlier pullback structure formed from the 4229 mitigation.
With this shift in momentum, gold now holds a potential revisit toward the 4240’s, aligning with the current bullish trajectory and ongoing daily projection. follow for more insights , comment and boost idea

GEOPOLITICAL RELIEF SOFTENS SAFE-HEAVEN DEMANDS Gold is currently trading around 4190, with the 4236 zone acting as the nearby resistance area and 4163 serving as the intraday support. Price action remains mixed, and I’m watching how the market behaves within this range to understand the next potential shift in structure.
From a macro perspective, discussions around a possible Russia–Ukraine peace development have softened safe-haven demand, while a strengthening U.S. dollar adds additional pressure on the upside. These factors are contributing to the broader sentiment in the current session.
On the technical side, I’m observing how price reacts between support and resistance. If the structure weakens further, it could help explain how the market might eventually explore lower zones such as the broader 4100 area, which has been relevant in past price behavior. Whether price reaches this level depends on how the market responds to the intermediate zones.
These thoughts are shared purely for learning, chart study, and discussion within the community.

XAUUSD Pullback to Supply Zone Before Potential Drop📌 Description:
The chart shows XAUUSD pushing back into a marked supply zone after a strong bearish move. A projected pattern indicates possible consolidation in the zone followed by a downward move toward the rising trendline suppor

Gold price analysis December 2After a slight correction to the 4195 support area, gold quickly regained momentum and continued to maintain the main uptrend structure. This shows that the buyers are still in good control of the market rhythm, especially when the price always receives support at important support zones.
In today's session, the trading strategy still prioritizes BUY orders in line with the trend. It is expected that the market will move towards challenging the psychological resistance zone of 4300 - where profit-taking pressure from the sellers may appear.
📌 Reference strategy
Hold BUY from the 4195 area
BUY Trigger when there is a clear price rejection signal at the support zones: 4170 - 4115
Risk: if the price closes below 4110, selling pressure may return strongly and break the short-term uptrend structure

XAUUSD buy and sell level to look forGOLD on Friday with montly close price significantly moved to montly high. As with the new montly open, price is in a pullback to antoher important daily support level.
There is a significant rejection on the lowertimeframe which now moving in down trend on 1h and 15minutes timeframe. Price level 4154.70 is a key liquidity zone with strong impulse created from the level on Friday before weekend closer can be test and may have another rejection to the resistance.
Therefore looking for possible sell on 4195.00 level and upon rejection, possible buy on 4155.00

GOLD Free Signal! Sell!
Hello,Traders!
GOLD taps a clean supply zone after an extended move, showing rejection wicks and shifting orderflow that signal potential distribution. A short-term pullback into discounted levels may unfold toward the downside target.
--------------------
Stop Loss: 4,246$
Take Profit: 4,192$
Entry Level: 4,216$
Time Frame: 2H
--------------------
Sell!
Comment and subscribe to help us grow!
Check out other forecasts below too!
Disclosure: I am part of Trade Nation's Influencer program and receive a monthly fee for using their TradingView charts in my analysis.

XAUUSD – H2: Discount zone has formed, just waiting for the ...XAUUSD – H2: Discount zone has formed, just waiting for the price to pull back to continue buying up
On the H2 frame, gold just had a strong break up to the 4.180+ zone after a period of narrow range compression. At the end of the week, coinciding with Thanksgiving, I only prioritize waiting for an adjustment to the discount zone to buy up, absolutely not chasing the price at the peak.
🎯 MAIN SCENARIO – BUY THE DIP AT FIBO & POC ZONE 4.163–4.160
Buy entry: 4.163 – 4.160
SL: 4.155
TP: 4.178 – 4.195 – 4.220
⭐️ ALTERNATIVE SCENARIO – BUY DEEP AT VAL ZONE + STRONG SUPPORT 4.139–4.136
Buy entry: 4.139 – 4.136
SL: 4.130
TP: 4.150 – 4.172 – 4.190 – 4.220
The total risk for each scenario I always keep within the range of 1–2% of the account.
Basic context
End of the week + Thanksgiving ⇒ thin liquidity, easy to shake at the end of the session.
Messages from Trump & credit data show the economic picture and the December interest rate path are not really clear.
This keeps gold still having a defensive role, but not enough basis to expect a straight upward move – so I prioritize trading according to technicals and specific price zones.
Technical analysis H2
Market sentiment & trading plan
After the break, the buyers are holding momentum, but the price moving sideways at the high zone shows the market is partially taking profits, waiting for liquidity.
Thin liquidity easily creates sweeps to the support zone before turning around, that's the move I want to take advantage of.
Plan:
Prioritize Buy at 4.163–4.160, only consider the 4.139–4.136 scenario if the price is deeply sold off.
All orders have a hard SL (4.155 and 4.130), do not widen the stop.
Take partial profits, move SL in a favorable direction as the price approaches TP levels.
If you find the analysis useful, follow TradingView and leave a comment about the price zone waiting for entry – I always read feedback to optimize future posts.

XAUUSD – 1H | Bearish Channel Continuation SetupOANDA:XAUUSD
Gold lost bullish momentum after the rejection at the top resistance and is now following a corrective channel lower. The market is likely seeking liquidity toward the next support zone. As long as price remains below the resistance levels and inside the bearish channel, sellers hold the upper hand.
Key Scenarios
❌ Bearish Case 📉 (Primary Bias)
If price stays below 4,211 – 4,244, continuation downside expected:
🎯 Target 1: 4,130
🎯 Target 2: 4,024
🎯 Final Draw: 3,999 – 3,984
✅ Bullish Case 🚀 (Invalidation)
If price breaks and closes above 4,244.420, bearish setup invalidates and price may attempt a move back toward:
🎯 4,280+
Current Levels to Watch
Resistance 🔴: 4,211.141 • 4,244.420
Support 🟢: 4,130.881 • 4,024.780 • 3,999.332
⚠️ Disclaimer: This analysis is for educational purposes only. Not financial advice.

XAUUSD | Price Sees Bounce to ReboundGold (XAU/USD) rebounded well overnight from the $4,155-$4,150 support level. This upward movement benefits gold bulls.
However, traders are advised to exercise caution and wait for confirmation of a breakout of key levels.
✅ Bullish Scenario
- Key Hurdles: It is recommended to wait for price acceptance above the strong $4,245-$4,250 barrier before taking further bullish positions.
✅ Upside Target: Once $4,250 is broken, gold could:
- Surpass the weekly high around $4,264-$4,265.
- Break through the $4,277-$4,278 resistance.
- Aim to reclaim the $4,300 round number.
✅ Bearish Scenario
- Initial Support (Buying Opportunity): Weakness below the $4,200 round figure may continue to attract buyers and is expected to find decent support ahead of the $4,150 level.
- Critical Point (Pivot): The $4,150 level should act as a key pivotal point.
- Strong Selling Trigger: A break below $4,150 could drag Gold prices towards the $4,100 round figure.
- Key Confluence Support: Continued selling will test the confluence support at $4,075 – $4,073.
Note: $4,075 – $4,073 consists of the 200-period EMA on the 4-hour chart and a long-term uptrend line.

Scalp: Buy on Gold - R/R: 1/3Guys,
You can have a scalp buy position on gold with a risk of max 2% of account
