GOLD-SELL strategy Monthly chart Reg. Channel - KCGOLD is very overdone, and I remain of the opinion that medium-term a large scale correction will take place. we are extr4enely high on RSI levels unseen ever, and secondly, way above KC channel and also Reg. Channel.
Strategy SELL between $ 4.000 - 4,375 and take profit near $ 3,250 first, and there after $ 2,875 for now.
Trade ideas

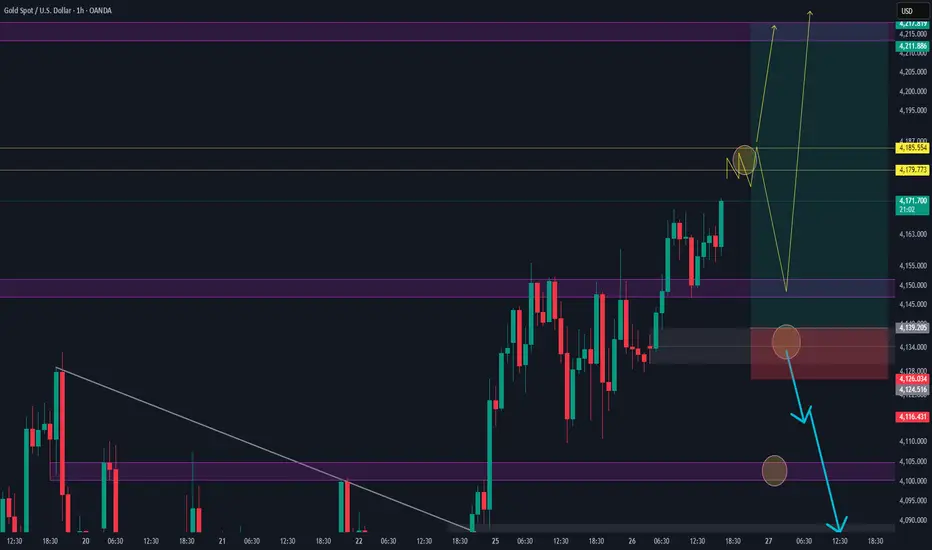
Gold next move (continuation but a pullback needed)(26-11-2025)Go through the analysis carefully and do trade accordingly.
Anup 'BIAS for the day (26-11-2025)
Current price- 4074
wait for the pullback and if it happens then buying area will be 4135-4040
"if Price stays above 4120, then next target is 4150, 4170 and 4205 and 4205 and below that 4100, 4085".
-POSSIBILITY-1
Wait (as geopolitical situation are worsening )
-POSSIBILITY-2
Wait (as geopolitical situation are worsening)
Best of luck
Never risk more than 1% of principal to follow any position.
Support us by liking and sharing the post.
GOLD 1H CHART ROUTE MAP UPDATE & TRADING PLAN FOR THE WEEKHey Everyone,
Please see our updated 1h chart levels and targets for the coming week.
We are seeing price play between two weighted levels with a gap above at 4100 and a gap below at 4057. We will need to see ema5 cross and lock on either weighted level to determine the next range.
We will see levels tested side by side until one of the weighted levels break and lock to confirm direction for the next range.
We will keep the above in mind when taking buys from dips. Our updated levels and weighted levels will allow us to track the movement down and then catch bounces up.
We will continue to buy dips using our support levels taking 20 to 40 pips. As stated before each of our level structures give 20 to 40 pip bounces, which is enough for a nice entry and exit. If you back test the levels we shared every week for the past 24 months, you can see how effectively they were used to trade with or against short/mid term swings and trends.
The swing range give bigger bounces then our weighted levels that's the difference between weighted levels and swing ranges.
BULLISH TARGET
4100
EMA5 CROSS AND LOCK ABOVE 4100 WILL OPEN THE FOLLOWING BULLISH TARGETS
4140
EMA5 CROSS AND LOCK ABOVE 4140 WILL OPEN THE FOLLOWING BULLISH TARGET
4193
EMA5 CROSS AND LOCK ABOVE 4193 WILL OPEN THE FOLLOWING BULLISH TARGET
4233
EMA5 CROSS AND LOCK ABOVE 4233 WILL OPEN THE FOLLOWING BULLISH TARGET
4275
BEARISH TARGETS
4057
EMA5 CROSS AND LOCK BELOW 4057 WILL OPEN THE FOLLOWING BEARISH TARGET
4016
EMA5 CROSS AND LOCK BELOW 4016 WILL OPEN THE FOLLOWING BEARISH TARGET
3965
EMA5 CROSS AND LOCK BELOW 3965 WILL OPEN THE SWING RANGE
3923
3861
As always, we will keep you all updated with regular updates throughout the week and how we manage the active ideas and setups. Thank you all for your likes, comments and follows, we really appreciate it!
Mr Gold
GoldViewFX

Be careful! Gold is likely to experience significant fluctuationGold continues to trade within a short-term ascending channel and is now approaching the upper boundary, which aligns with a major resistance zone formed by the previous swing high. This creates a strong confluence area where sellers may become active.
As price enters this resistance cluster, we expect selling pressure and a potential rejection. Based on the current momentum, a clean breakout above this zone does not seem likely in the short term.
Most Probable Scenarios
1-A final upward push toward the upper boundary of the channel
2-A rejection from the resistance zone
3- A move back toward the lower boundary of the ascending channel
4- If the channel breaks to the downside, an extended decline toward the next key support level becomes likely
This week includes several high-impact events—most importantly:
The U.S. Federal Reserve interest rate decision,
which may significantly increase volatility in gold.

GOLD Best Buy and Sell area
( OANDA:XAUUSD ) At the beginning *Inverse Head & Shoulders* pattern, alongside an **ABC corrective wave** upwards, with clear Fibonacci retracements and volume profile zones.
Let’s break down the analysis into six key points:
---
# ✅ **1) Inverse Head & Shoulders Pattern**
* We have a clear **Left Shoulder**, **Head**, and **Right Shoulder** formation.
* The **neckline has been broken**, signalling a strong bullish reversal.
* Typically, the target is measured from the head to the neckline, which aligns roughly with **Target 1 at 4217** on the chart.
---
# ✅ **2) Elliott Wave Analysis**
The chart outlines an **A → B → C upward corrective wave**:
### Wave A
An initial impulsive move upward, indicating a trend change.
### Wave B
A retracement to the 0.618 – 0.705 Fibonacci levels, which is very typical for gold.
### Wave C
Expected to reach the labelled targets:
* **C ≈ A** at about 4217
* **1.272 – 1.618 of A** around 4236 to 4248
This alignment supports the target levels shown.
---
# ✅ **3) SMC Zones (Smart Money Concepts) **
We can see three key elements:
### **🔵 Demand Zone**
Around **4202 – 4195**
The price has bounced strongly from this area, indicating:
* Liquidity absorption
* Entry of large buyers
* This zone acts as a strong **order block (OB)**
### **🔴 Liquidity Pools Above**
At the target levels (4217, 4236, 4248), we see likely stop hunts. The price tends to gravitate there to trigger stops and fill orders.
---
# ✅ **4) Volume Profile (VPVR) Analysis**
The chart shows:
### ✔ Point of Control (POC) around:
**4208 – 4210**
Currently, the price is trading above the POC, suggesting that:
🔹 Buyers are in control
🔹 Any dips to this zone are likely just retests rather than trend reversals
---
# ✅ **5) Expected Scenario**
## 🔵 Main Scenario (Bullish)
As long as the price stays above **4202 – 4208**, gold is expected to target:
### 🎯 **TARGET 1 → 4217**
(The first liquidity level)
### 🎯 **TARGET 2 → 4236**
(Approx. 100% extension of wave C)
### 🎯 **TARGET 3 → 4248**
(The final target of the C wave)
---
# ✅ **6) Alternative Scenario (Bearish Failure) **
Only if the price breaks:
❌ **Below 4195**
❌ And closes below it on the 15-minute chart
In that case, we might see a decline towards:
**4164 – 4151** (the 1.618 and 2.00 Fibonacci extensions downward)
---
# 📌 **Conclusion**
Overall, the analysis suggests:
### ✔ Short-term trend: **Bullish**
### ✔ Buy zone: **4195 – 4205**
### ✔ Stop loss: **Below 4192**
### ✔ Targets: 4217, 4236, 4248
The price action, wave structure, and volume profile all support this bullish scenario.
FX:XAUUSD
---

Can XAUUSD extend the uptrend on Fed rate-cut hopes?Macro approach:
- Rising expectations of Fed rate cuts are supporting gold prices, with markets now assigning a roughly 85% probability to a Dec reduction amid softer US economic data.
- Ongoing US dollar weakness and signs of cooling in the US labor market are likely to keep providing a tailwind for gold on the upside.
- Softer US Treasury yields and a more dovish Fed stance, together with a slowing labor market, may continue to bolster safe-haven demand for gold.
Technical approach:
- After retesting the EMA21, XAUUSD has moved toward resistance at 4208, with a breakout above the Symmetrical Triangle suggesting scope for further bullish continuation.
- A sustained move above 4208 could open the way for XAUUSD to target the previous ATH area at around 4365.
- However, if XAUUSD fails to secure a close above the triangle breakout, the price could pull back toward the next support area around 4054.
Analysis by: Dat Tong, Senior Financial Markets Strategist at Exness

Gold prices fell as expectedfollowing a continuous bearish trendAnalysis of the gold market trend: Gold has no fluctuations today. Gold has failed to rebound in the US market and is still under pressure at 4220. Gold fell as expected. The gold relay continued to win on Friday, and gold won 3 consecutive victories. The market is currently waiting for an interest rate cut. Before the interest rate cut, we will continue to focus on high altitudes. We have also made it clear that we are shorting near 4220, and the highest is near the 4219 line, which is basically consistent with our expectations. Let’s first look at the line near 4170-4160!
Gold Technical Analysis: Looking at the 1-hour chart, gold is still in a generally downward trend with weak rebounds. If the rebound in the US session continues to face pressure in the 4200-4220 area, shorting at higher levels is possible. With the Fed's interest rate decision approaching, gold is likely to remain range-bound. The hourly chart shows a sideways movement today, with signs of a breakout. A large bearish candlestick completely engulfed two bullish candlesticks, a bearish engulfing pattern. This is a time-for-space consolidation, and the short-term support around 4180 is unlikely to hold. Continue to watch for support around 4160-4150. In summary, today's trading strategy for gold is to primarily sell on rallies and secondarily buy on dips. The key resistance level to watch in the short term is around 4200-4220, and the key support level is around 4160-4150. Please follow the trend closely.

Gold?Hi
Gold kept resisting going down. But, it had broken the low.
Had actually retest and went down below 4200
Will it do that again today?
OR break and goes higher.
Sp 4223-4230 will be a watch area
If it fits one criteria, will execute
: my view still a sell for now bcoz of strong sell yest
All the best
Not a guru

SELL NOW XAUUSD
🔻 SELL SIGNAL – XAUUSD (Gold USD)
📍 Entry: 4,205.35
🛑 Stop-Loss: 4,215.29
🎯 Take-Profit: 4,183.90
Description:
Price rejected resistance and formed a lower high. Bearish momentum continues after a breakdown from the recent uptrend. Expect further downside if the candle closes below the entry level.

Gold prices fluctuated, experiencing repeated oscillations.
Gold prices retreated during Thursday's Asian session, primarily reflecting improved market risk appetite and reduced safe-haven demand amid thin holiday trading. As market expectations for another Fed rate cut in December intensified, coupled with rising hopes for regional peace negotiations, global market sentiment turned optimistic, prompting some funds to flow from gold to risk assets. This week's US economic data was mixed, but overall did not change the market's assessment of the Fed's policy path. Data from the US Commerce Department showed that durable goods orders rose 0.5% in September, a significant slowdown from the previous 3.0%, but still higher than the market forecast of 0.3%. Excluding transportation, orders rose 0.6%, indicating continued resilience within the manufacturing sector. Gold prices retreated slightly after previous gains, mainly influenced by improved market risk appetite and rising expectations for peace negotiations. However, strong expectations of a Fed rate cut in December put pressure on the dollar, continuing to support gold. While various US economic data showed mixed results, they did not shake the market's judgment on a rate cut.
Recent speeches by several Federal Reserve officials have clearly shifted towards a dovish stance. John Williams of the New York Fed stated that if the economy remains as it is, interest rate cuts would not affect the inflation target; while Fed Governor Waller pointed out that the weakness in the labor market is sufficient to support another rate cut. Against this backdrop, the dollar index fell to a one-week low, continuing to be a significant supporting factor for gold. On the other hand, signs of improvement in the atmosphere surrounding regional peace negotiations have further boosted risk appetite. Multiple statements indicate that while negotiations remain far off, external sentiment has improved, thus weakening gold's safe-haven appeal. Overall, gold's fundamentals present a mixed structure of "cooling safe-haven demand + support from interest rate expectations." Short-term fluctuations in gold are more driven by sentiment than by trend reversal signals. From the combined perspective of interest rate expectations, dollar performance, and technical structure, this round of correction is more like a natural adjustment within an upward trend. If subsequent economic data continues to support expectations of rate cuts, then gold still has the potential to resume its upward trend after retracing to key support levels. However, it should be noted that fluctuations in peace negotiation expectations could bring additional volatility. There are no key data releases or events to watch today. The gold market will close two hours early due to Thanksgiving in the US, but this can be disregarded.
Gold Price Analysis:
Gold touched around 4173 in the US session yesterday before falling back. We identified the 4170-75 resistance level yesterday, a key resistance point we've emphasized in the past two days. If this level continues to act as resistance today, the downward momentum may persist. This morning, gold saw a slight pullback to around 4140 before consolidating in a narrow range. This morning's pullback is likely a tentative move; we will continue to monitor the resistance level to see how much further it may fall.
Looking at the four-hour chart, the triangle consolidation pattern for gold remains unchanged. The downward trendline resistance is at 4173-75. Only a decisive break above this trendline will allow for further upward movement and a new opportunity. Otherwise, it will remain in consolidation at the end of the consolidation phase. On the one-hour chart, the price has started to break below the short-term support zone and is now under pressure from the short-term moving averages. There may be some room for adjustment in the short term; we will monitor the short-term correction. Today, continue to focus on the resistance level of the upper trendline of the triangle pattern, which is also the watershed between bulls and bears. If the resistance holds, expect a pullback. Therefore, we still need to try to establish short positions today. If there is a rebound to around 4168-73, we can short. In summary, the short-term trading strategy for gold today is to focus on selling on rallies. The key resistance level to watch in the short term is 4173-4175, and the key support level is 4110-4100. Please keep up with the pace.

XAU/USD Daily OutlookYesterday’s session reminded us of the importance of adaptability.
As mentioned earlier, I did not expect 4193 to be invalidated, but once it broke during the New York session, I adjusted and entered short at 4190, targeting 4155 and 4135.
Due to limited bearish conviction, I managed trades manually and closed at 4182 and 4174.
Overall, a disciplined and productive Tuesday.
Today’s Technical Setup
Tokyo High: 4229
Previous Day High: 4236.50
As long as this resistance belt remains intact, I’ll stay away from buy positions.
If this zone is invalidated, I will act accordingly.
Yesterday’s price action suggests gold is attempting to form a higher low, but bearish momentum is limited - partly due to fundamentals.
London Session Plan:
Look for sell opportunities below 4200
Target: 4165
ADP Nonfarm Employment Change (Nov) release during the New York session will likely drive volatility and set the tone for the day.
Fundamental View
Gold’s downside remains capped by geopolitical tensions and expectations of Fed rate cuts, which reduce the opportunity cost of holding gold.
However, strong U.S. labor data could strengthen the dollar and pressure gold lower.
Conversely, weaker data would reinforce bullish sentiment and increase the likelihood of a breakout above the 4230–4236 zone.

THE KOG REPORT - UpdateEnd of day update from us here at KOG:
Slow day but nothing has changed. Earlier, we wanted a pull back into the 4130's which we did get, not on point, but the red boxes confirmed the move upside and we managed to get in level to level on our way to the level we want above.
For now, we'll stick with it and look at the two hotspots as areas of interest for the sessions ahead. Support stands around the hot spot 4150 while resistance is just below at 4170. Ideally, we would like to see this encounter a RIP from one of these resistance levels, lets see what tomorrow brings!
As always, trade safe.
KOG

Gold will rise
On Friday, the US September core PEC annual rate unexpectedly fell to 2.8%, a three-month low. The US dollar index ultimately closed down 0.08% at 98.99. US Treasury yields rose to their highest levels in weeks, as investors anticipated a hawkish rate cut from the Federal Reserve. The benchmark 10-year Treasury yield closed at 4.1410%, while the 2-year Treasury yield, sensitive to Fed policy rates, closed at 3.5710%.
Spot gold rallied briefly during the session, approaching the $4260 mark, but subsequently retreated from its highs, erasing all of its intraday gains and closing below the $4200 level, ultimately falling 0.27% to $4197.13 per ounce. Spot silver historically broke through the $59 mark, setting a new record high for the second consecutive day, ultimately rising 2.03% to $58.3 per ounce.
The sharp drop in gold prices at the end of last week validated my view that one shouldn't overemphasize the potential for price fluctuations within this cycle, as there might be sweeping price action. Therefore, I didn't chase the upward trend on Friday, thus avoiding the significant drop. The price closed near 4195, which basically confirms that gold will maintain last week's range-bound movement this week. We still need to observe the price action within this range, buying low and selling high, and then assess the continuation or breakout of the trend based on market changes. Therefore, the immediate range for gold remains 4260/4170. A breakout above or below this range could lead to 4300 on the upside and 4120 on the downside.
From a technical perspective, both the daily and H4 charts show a range-bound pattern. The daily chart lacks a strong bullish signal, while the H4 chart shows Bollinger Bands narrowing and moving averages converging, indicating no clear direction. The current H4 range is 4230/4180. This means that at the beginning of the week, traders can buy low and sell high within this range. A breakout in either direction would expand the range to last week's 4260/4170. Gold is currently fluctuating around 4190. Aggressive traders can go long directly, while conservative traders can go long at 4180, waiting for the price action from last week during the European and American sessions.
Investment Strategy: Buy gold at 4170-80, stop loss at 4160, target 4230, hold if it breaks through.

XAUUSD - Sell IntradayBreakout of the trendline can be a good trade on the sell side, if the trade gets activated.
Follow Risk management, as every trade can fail.

XAUUSD: The upward trend remains intact; wait for entryGold remains in an overall uptrend, but bullish momentum is clearly weakening, making today a crucial session.
Whether prices can continue moving higher will largely depend on whether gold can hold the current pullback. If support holds, the next leg up is likely to be even stronger. If not, the market will likely slip into a choppy, range-bound pattern.
Over the past two weeks, markets have been heavily pricing in a Fed rate-cut narrative, and much of that expectation is now largely priced in.
At the same time, the nomination of a new Federal Reserve Chair has returned to the center of market attention. Regardless of who is selected, the candidate is widely expected to be dovish, or they would not have been nominated in the first place.
A dovish chair would inherently support rate cuts—a bullish factor for gold.
Therefore, even if gold experiences short-term pullbacks or weakening momentum, the broader bullish trend remains unchanged.
For today, the key price levels to watch are $4,180 and $4,200.
If price reaches these zones, they may offer actionable trading opportunities.

XAUUSD structure is still bullish XAUUSD structur is still bullish
I will buy on every DIP
As I mentioned 4180-4190 area is my buy zone .
Secondly if H4 closed below 4175 then market will retest my 4145-4135 structural demand zone where I will start buying again .
Target remain same 4245 then 4275 on intraday

XAUUSD – Potential Bullish Reversal Zone FormingPrice is currently trading above a key demand zone around the 4170–4185 region. This area has previously acted as strong support, and market reactions here suggest that buyers are still defending it. The recent push into this zone combined with the rejection wicks indicate potential accumulation.
Price is hovering around the 4200 psychological level, and if we see a deeper retest into demand, the structure allows for a possible bullish continuation scenario.

XAUUSD – H1 in a downtrend channel, prioritize selling at the...XAUUSD – H1 in a downtrend channel, prioritize selling at the channel top – buying at the trendline & Fibonacci
On H1, gold is sliding in a clear downtrend channel after peaking around 4.22x–4.23x.
In this context, I do not enter trades in the middle of the channel but only trade at two extreme zones:
Sell at the resistance/channel top.
Buy at the trendline + Fibonacci below.
🎯 Today's trading plan
1️⃣ SELL Scenario – Watch for shorting at the resistance zone 4.203
Sell: 4.203
SL: 4.225 (aggressive) 4.249 (safer for swing)
TP: 4.183 – 4.161 – 4.143
Zone 4.203 is:
Resistance of the H1 downtrend channel.
Near the supply zone where price was previously sold off strongly.
If the price retests 4.203 during the day, I prioritize selling according to the downtrend channel, with the first target near the bottom at 4.183, further at 4.161–4.143 – corresponding to the demand zone in the middle of the channel.
2️⃣ BUY Scenario – Buy at the channel bottom: trendline + Fibonacci
Buy: 4.142
SL: 4.119 (aggressive) 4.098 (safer)
TP: 4.170 – 4.198 – 4.205
Zone 4.142 is a confluence of the long-term uptrend line + Fibonacci + old support zone.
If gold is sold off to this area and a good price reaction appears (wick candles, increased buying volume), I see this as an opportunity to buy against the corrective phase, expecting the price to return to the middle of the channel and resistance 4.20x.
1️⃣ Basic Context
USD is trying to recover from the lowest bottom since late October, creating short-term corrective pressure on gold.
However, the USD's upward momentum is limited by expectations that the Fed will soon shift to a dovish stance:
Recent macro data shows the US economy is cooling down, with growth slowing.
The labor market shows signs of weakening in November.
This increases the probability of the Fed cutting 25bps at next week's FOMC, keeping the medium-term picture for gold positive, even though it is currently undergoing technical correction.
In summary: short-term has room to decline in the H1 channel, but medium-term gold is still supported by rate cut expectations.
2️⃣ Technical & Market Sentiment View
The H1 downtrend channel represents a distribution/correction phase after the previous strong rally.
Every time the price touches the upper edge of the channel, selling pressure appears, indicating that shorts are still taking advantage of high areas to enter.
Conversely, the lower edge of the channel + long-term trendline around 4.14x is where medium-term buying power is likely to appear – those waiting for a discount to re-enter the larger trend.
Current sentiment:
Short-term traders: prioritize selling at resistance, buying at support within the channel.
Medium-term traders: wait for the deeper 4.14x zone to accumulate gradually, instead of FOMO at the 4.20x zone.
3️⃣ Execution Plan
Do not enter trades in the middle of the channel, only act at:
4.203 for the SELL scenario.
4.142 for the BUY scenario.
Each trade limits risk to 1–2% of the account, choose one of the two SL levels (aggressive/safer) depending on the trading timeframe.
If the price decisively breaks the downtrend channel (H1 candle closes above 4.249 or below 4.098), I stop all current scenarios and reassess the structure.
If you find this perspective useful, follow the TradingView account.

The price of gold will rise to new highs!Gold is likely to continue bullish move where we expect price to hit around 4380 area or 4400. This our intraday approach and before our sell entry get activated which will be our swing entry. There is only one target for this setup which is 4390$. You can adjust stop loss and take profit based on your own view.

GOLD fluctuates sharply as labor data weakensSpot OANDA:XAUUSD closed nearly flat at $4,203.06 an ounce, down less than 0.1%, after a volatile session in New York. A significantly weaker-than-expected ADP report sent gold soaring to $4,241.60 an ounce, before profit-taking pressure and a sharp reversal in silver sent prices quickly tumbling back to $4,195 an ounce.
As of writing today, Thursday, December 4, spot gold was trading at $4,202 an ounce, up about $10 on the day.
ADP data showed the US private sector lost 32,000 jobs in November, in stark contrast to expectations for a gain of 10,000, the sharpest decline since March 2023. Win Thin (Nassau 1982) assessed that the ADP index had weakened continuously, reflecting a sustained downward trend in the labor market. Nela Richardson (ADP) noted the widespread slowdown across all business groups, especially the small and medium-sized sector, a sign of more cautious consumers in the context of macro instability.
While gold rebounded in response to the data, silver, which had touched $58.97/ounce in the early session yesterday, then fell sharply to $57.83/ounce, dragging the entire group of precious metals into a short-term correction.
Trump’s unexpected move causes market turmoil: Will the Fed chairmanship change soon?
A new political variable emerged when the White House abruptly canceled the interview schedule for the Fed chairman candidate this week. The Wall Street Journal commented that this move shows that President Trump may have finalized his choice to succeed Powell.
The market immediately raised the possibility that the leading candidate is Kevin Hassett, the White House economic adviser, who is seen as leaning towards a strong interest rate cut stance. The weak USD and recent recovery in gold partly reflect expectations that Hassett may push for a deeper easing cycle after Mr. Powell ends his term in May next year.
Steve Englander (Standard Chartered) said Hassett has an “impressive” track record, but worries about the Fed’s independence under political pressure. The Financial Times said bond investors have expressed concerns to the US Treasury that Hassett may prioritize short-term growth over price stability.
CME FedWatch currently prices an 89% chance of a Fed rate cut at its December 9-10 meeting. Markets are still waiting for September core PCE data, delayed until Friday, a key piece of the inflation puzzle.
Fundamental Outlook: Lower Yields Boost Gold, But Correction Risks Not Over
Given that gold is not yielding, expectations of QE are the central support. However, the combination of weak data, silver volatility and profit-taking pressure suggests that the road ahead for gold will be bumpy.
Macro trends – weak labor, softer USD, and political uncertainty surrounding the Fed Chair – continue to favor price support. But until we break above $4,400/oz with convincing liquidity, the momentum for acceleration will remain at the potential level.
Technical analysis and recommendations OANDA:XAUUSD
Gold is operating in a new bullish cycle: the price remains above the medium-term rising channel, making successive higher lows and closing above the short-term moving averages, indicating active buying.
The important support zone around $4,128–$4,130 (Fibo 0.236) is well defended; if maintained, the short-term bullish structure remains intact.
The RSI has recovered from the neutral zone, implying that the upside momentum is still strong but not overbought. The bullish scenario is complete when the price remains above the short-term MA21, does not break below $3,972–$3,973 (Fibo 0.382) and moves towards challenging the resistance zone of $4,300–$4,380 (channel top/Fibo extension).
Cyclical risk: a break below $3,972 would weaken the structure and could drag the price to a test of $3,846–$3,720.
SELL XAUUSD PRICE 4231 - 4229⚡️
↠↠ Stop Loss 4235
→Take Profit 1 4223
↨
→Take Profit 2 4217
BUY XAUUSD PRICE 4141 - 4143⚡️
↠↠ Stop Loss 4137
→Take Profit 1 4149
↨
→Take Profit 2 4155

GOLD its breakout? its selling turn??#GOLD... market just broke again his supporting area and in last turn market gave is a fake breakout.
so again if market holds below 4178-80 then we can expect further drop towards next supporting area.
stay sharp guys..
good luck
trade wisely

XAUUSD KEY LEVELS 04-11Greetings
Hi traders, This is the crucial support zone for XAU-USD at 15 minute,
based on the movement of the day prior and market trends.
Support zone (White line)
Important levels:
4175.09 is the entry
Target: 4185.09
Stop loss: 4165.09
1:1 Risk-Reward Ratio
We are inspired to continue learning and exchanging ideas by your likes and boosts!

Gold 30 Mints Bearish Trend & Short SetupThe chart shows a bearish trend for Gold on a 30-minute time frame. A Change of Character is indicated by the sharp price movement at the beginning of the chart, suggesting a reversal in the market. The price reaches the Supply Zone after liquidity is taken out, showing potential for a continued downward move. After the market tapped into the Demand Zone, the price exhibits a possible continuation setup, confirming the bearish trend. The chart's key points include liquidity in the supply zone and a potential short entry around 4,209.800, with targets set near the demand zone around 4,186.025. Keep an eye on the market’s reaction to these zones for confirmation of the next price action direction.
