Gold buy idea Gold Analysis
Gold stopped falling around 12 AM, forming a series of higher lows and lower highs. Price then changed character at 4199, where a 30m candle showed strong rejection with high volume, signaling potential bullish continuation.
How to Trade It
1️⃣ Wait for the 30m candle to close
You need confirmation that the rejection is valid and buyers are stepping in.
2️⃣ Drop to the 15m timeframe
Wait for the 15m candle to close as a bullish engulfing candle with strong volume.
This confirms momentum and validates the shift in structure.
Targets (TPs)
TP1: 4207
TP2: 4222
Invalidation
❌ If the 15m candle closes below the previous 15m candle, do not take the trade.
This signals weakness and invalidates the setup.
Trade ideas

Gold?Hi
Gold kept resisting going down. But, it had broken the low.
Had actually retest and went down below 4200
Will it do that again today?
OR break and goes higher.
Sp 4223-4230 will be a watch area
If it fits one criteria, will execute
: my view still a sell for now bcoz of strong sell yest
All the best
Not a guru

XAU/USD: Strong Uptrend, Ready to Break to New HighsHello traders! Today, we’ll analyze gold (XAU/USD), which is currently in a strong uptrend, and explore opportunities to capitalize on this momentum.
The latest news shows that gold has surged on November 26th, with the market anticipating that the Federal Reserve (Fed) might cut interest rates in December. Spot gold reached its highest level since mid-November, touching 4,170 USD/ounce. Factors such as mixed economic data from the U.S ., concerns about the labor market , and weakening consumer confidence have created a positive sentiment for gold.
From a technical analysis standpoint, the chart shows that XAU/USD is moving in a clear ascending wedge . The current price is near the support zone at 4,130 USD, with the potential for the uptrend to continue towards 4,240 USD if the price maintains its bullish momentum. Indicators like EMA 34 and EMA 89 both support the upward trend, reinforcing the potential for new highs.
Trading Strategy: Buy when the price adjusts to 4,130 USD and shows signs of reversal. The target for the uptrend could be 4,240 USD, and if the price breaks this level, we can expect gold to move towards 4,300 USD. A stop-loss can be placed around 4,120 USD to protect the account.
With positive market trends and technical support, gold is likely to continue its upward momentum in the near future. Stay updated and take advantage of this opportunity!

A perfect grasp of both bullish and bearish trends.Gold remains in an overall bullish trend, consistently hitting new recent highs. The bullish momentum remains strong, and pullbacks during the US session present buying opportunities. After testing the lows again in the US session, gold rebounded, maintaining its bullish strength. Continue to buy in the 4225-4215 range during the US session. The 1-hour moving averages are still in a bullish golden cross and diverging upwards, indicating further upward momentum. Gold rebounded strongly after testing the lows around 4215 in the morning, and again during the US session. The highs during pullbacks are progressively higher, suggesting continued buying opportunities during the US session. The principle is simple: follow the trend. Gold is currently in a bullish trend, and pullbacks present buying opportunities.

THE KOG REPORT - UpdateEnd of day update from us here at KOG:
A great start to the week with the hot spot and key level of 4040 providing the catalyst to give us the bounce we wanted up into the higher target and hot spots netting a fantastic pip capture to set us up for the week. We've now hit the defence level and as you can see we're getting a slight RIP from the region, however, due to it being late session now we're likely to only scalp this and close up for the day.
We'll leave you with the resistance level also lining up with the red box defence and support below at the 4085 level which will need to break to go lower.
Please do support us by hitting the like button, leaving a comment, and giving us a follow. We’ve been doing this for a long time now providing traders with in-depth free analysis on Gold, so your likes and comments are very much appreciated.
As always, trade safe.
KOG

XAU/USD Daily OutlookYesterday’s session reminded us of the importance of adaptability.
As mentioned earlier, I did not expect 4193 to be invalidated, but once it broke during the New York session, I adjusted and entered short at 4190, targeting 4155 and 4135.
Due to limited bearish conviction, I managed trades manually and closed at 4182 and 4174.
Overall, a disciplined and productive Tuesday.
Today’s Technical Setup
Tokyo High: 4229
Previous Day High: 4236.50
As long as this resistance belt remains intact, I’ll stay away from buy positions.
If this zone is invalidated, I will act accordingly.
Yesterday’s price action suggests gold is attempting to form a higher low, but bearish momentum is limited - partly due to fundamentals.
London Session Plan:
Look for sell opportunities below 4200
Target: 4165
ADP Nonfarm Employment Change (Nov) release during the New York session will likely drive volatility and set the tone for the day.
Fundamental View
Gold’s downside remains capped by geopolitical tensions and expectations of Fed rate cuts, which reduce the opportunity cost of holding gold.
However, strong U.S. labor data could strengthen the dollar and pressure gold lower.
Conversely, weaker data would reinforce bullish sentiment and increase the likelihood of a breakout above the 4230–4236 zone.

SELL NOW XAUUSD
🔻 SELL SIGNAL – XAUUSD (Gold USD)
📍 Entry: 4,205.35
🛑 Stop-Loss: 4,215.29
🎯 Take-Profit: 4,183.90
Description:
Price rejected resistance and formed a lower high. Bearish momentum continues after a breakdown from the recent uptrend. Expect further downside if the candle closes below the entry level.

XAUUSD 01/12 Support zoneSalutations,
Hi traders, This is the crucial support zone for XAU-USD at 15 minute,
based on the movement of the day prior and market trends.
Support zone (White line)
Important levels:
4211.25 is the entry
Target: 4221.25
Stop loss: 4201.25
1:1 Risk-Reward Ratio
We are inspired to continue learning and exchanging ideas by your likes and boosts!

Another Golden Opportunity!Gold's corrective move the past few weeks has now led to a bounce, expect some more gains in a likely ABC bounce to be followed by further correction towards $3800ish.
This wave 5 might only be wave 1 finished at $4380, a wave 2 corrective decline to be followed by a stronger wave 3...of course anything can happen, new highs in the next week or so will be very welcome.
Let's see the pattern play out before we are clearer on the outcome, expect this bounce to peter out towards $4190ish, if a resumption of the correction develops, another golden opportunity presents itself around $3800.
Whatever happens, this wave 5 will see $5000 plus and possibly $6000...remember $3000?
Appreciate a thumbs up, good trading and God Bless you all!

GOLD 4H CHART ROUTE MAP UPDATE & TRADING PLAN FOR THE WEEKHey Everyone,
Please see our updated 4h chart levels and targets for the coming week.
We are seeing price play between two weighted levels with a gap above at 4124 and a gap below at 4042. We will need to see ema5 cross and lock on either weighted level to determine the next range.
We will see levels tested side by side until one of the weighted levels break and lock to confirm direction for the next range.
We will keep the above in mind when taking buys from dips. Our updated levels and weighted levels will allow us to track the movement down and then catch bounces up.
We will continue to buy dips using our support levels taking 20 to 40 pips. As stated before each of our level structures give 20 to 40 pip bounces, which is enough for a nice entry and exit. If you back test the levels we shared every week for the past 24 months, you can see how effectively they were used to trade with or against short/mid term swings and trends.
The swing range give bigger bounces then our weighted levels that's the difference between weighted levels and swing ranges.
BULLISH TARGET
4124
EMA5 CROSS AND LOCK ABOVE 4124 WILL OPEN THE FOLLOWING BULLISH TARGETS
4212
EMA5 CROSS AND LOCK ABOVE 4212 WILL OPEN THE FOLLOWING BULLISH TARGET
4328
EMA5 CROSS AND LOCK ABOVE 4328 WILL OPEN THE FOLLOWING BULLISH TARGET
4422
EMA5 CROSS AND LOCK ABOVE 4422 WILL OPEN THE FOLLOWING BULLISH TARGET
4494
BEARISH TARGETS
4042
EMA5 CROSS AND LOCK BELOW 4042WILL OPEN THE FOLLOWING BEARISH TARGET
3964
EMA5 CROSS AND LOCK BELOW 3964 WILL OPEN THE FOLLOWING BEARISH TARGET
3873
EMA5 CROSS AND LOCK BELOW 3873 WILL OPEN THE SWING RANGE
3767
3646
As always, we will keep you all updated with regular updates throughout the week and how we manage the active ideas and setups. Thank you all for your likes, comments and follows, we really appreciate it!
Mr Gold
GoldViewFX

GOLD Best Buy and Sell area
( OANDA:XAUUSD ) At the beginning *Inverse Head & Shoulders* pattern, alongside an **ABC corrective wave** upwards, with clear Fibonacci retracements and volume profile zones.
Let’s break down the analysis into six key points:
---
# ✅ **1) Inverse Head & Shoulders Pattern**
* We have a clear **Left Shoulder**, **Head**, and **Right Shoulder** formation.
* The **neckline has been broken**, signalling a strong bullish reversal.
* Typically, the target is measured from the head to the neckline, which aligns roughly with **Target 1 at 4217** on the chart.
---
# ✅ **2) Elliott Wave Analysis**
The chart outlines an **A → B → C upward corrective wave**:
### Wave A
An initial impulsive move upward, indicating a trend change.
### Wave B
A retracement to the 0.618 – 0.705 Fibonacci levels, which is very typical for gold.
### Wave C
Expected to reach the labelled targets:
* **C ≈ A** at about 4217
* **1.272 – 1.618 of A** around 4236 to 4248
This alignment supports the target levels shown.
---
# ✅ **3) SMC Zones (Smart Money Concepts) **
We can see three key elements:
### **🔵 Demand Zone**
Around **4202 – 4195**
The price has bounced strongly from this area, indicating:
* Liquidity absorption
* Entry of large buyers
* This zone acts as a strong **order block (OB)**
### **🔴 Liquidity Pools Above**
At the target levels (4217, 4236, 4248), we see likely stop hunts. The price tends to gravitate there to trigger stops and fill orders.
---
# ✅ **4) Volume Profile (VPVR) Analysis**
The chart shows:
### ✔ Point of Control (POC) around:
**4208 – 4210**
Currently, the price is trading above the POC, suggesting that:
🔹 Buyers are in control
🔹 Any dips to this zone are likely just retests rather than trend reversals
---
# ✅ **5) Expected Scenario**
## 🔵 Main Scenario (Bullish)
As long as the price stays above **4202 – 4208**, gold is expected to target:
### 🎯 **TARGET 1 → 4217**
(The first liquidity level)
### 🎯 **TARGET 2 → 4236**
(Approx. 100% extension of wave C)
### 🎯 **TARGET 3 → 4248**
(The final target of the C wave)
---
# ✅ **6) Alternative Scenario (Bearish Failure) **
Only if the price breaks:
❌ **Below 4195**
❌ And closes below it on the 15-minute chart
In that case, we might see a decline towards:
**4164 – 4151** (the 1.618 and 2.00 Fibonacci extensions downward)
---
# 📌 **Conclusion**
Overall, the analysis suggests:
### ✔ Short-term trend: **Bullish**
### ✔ Buy zone: **4195 – 4205**
### ✔ Stop loss: **Below 4192**
### ✔ Targets: 4217, 4236, 4248
The price action, wave structure, and volume profile all support this bullish scenario.
FX:XAUUSD
---

SHIFTING TO BULLISH EXPOSURE: THE SQUEEZE IS NOW IN PLAYOver the past few days, I’ve been closely analyzing the critical 4184–4193 zone, initially watching for exhaustion signals to position for a potential downside move.
However, the market has spoken clearly.
What just happened is exactly the opposite:
a clean, technical, textbook short-squeeze.
⸻
🔥 What exactly happened?
✔ Price reacted violently to the upside right inside the zone previously marked as “LOOK FOR ENTRY” (the white zone).
✔ The breakout of 4184–4193 occurred with:
• strong increasing volume,
• decisive large candles,
• MACD aligned on 5–15–30m,
• RSI pushing upward with no bearish divergences.
✔ The previous structure showed a perfect compression, a classic setup before a squeeze triggers.
✔ And most importantly: price entered an area of low volume, which typically fuels fast expansions.
All of this confirms that sellers were trapped under the breakout and are now fueling the upside by getting stopped out.
⸻
🔄 Shift of focus: now positioned for bullish continuation
Given the evidence, I’m adapting the plan:
➡️ 1. I’m now exposed to the bullish scenario
I’m keeping my long positions as long as:
• momentum remains strong,
• volume continues to support the breakout,
• and price does not lose 4184 with force.
My management targets are:
• 4205–4210 (first resistance),
• 4220–4225 (1.618 extension),
• 4244 (major higher high, main target if the breakout sustains).
I will close partials or tighten stops if I see clear signs of exhaustion using volume, candle behavior, or MACD in these zones.
⸻
🔍 2. Still monitoring the bearish scenario
Even though the structure now favors bullish extension, I’m still paying attention to:
• a clean rejection around 4192–4205,
• bearish divergences on 5–15m,
• a failed breakout retest,
• heavy rejection candles with volume on 1m,
• or a MACD bearish cross on 5–15m after hitting key fib levels.
🔻 If that happens, it could be the beginning of the deeper pullback we expected before the squeeze triggered.
⸻
📌 My immediate plan
To confirm continuation, I will look for:
• A retest of the higher high or the 4184–4192 zone,
• Rejection or acceptance around fib retracement levels on 5m/15m,
• MACD cross as confirmation depending on direction,
• Renewed buying volume for continuation.
⸻
🧠 Conclusion
The market did exactly what we anticipated as a possible scenario:
trigger a squeeze right above the critical zone.
Now the bias is clearly bullish, but I remain cautious in case of a failed breakout or exhaustion.
At this stage, the key is to read real-time flow instead of locking onto a single idea, and continue adapting to how price structures itself.

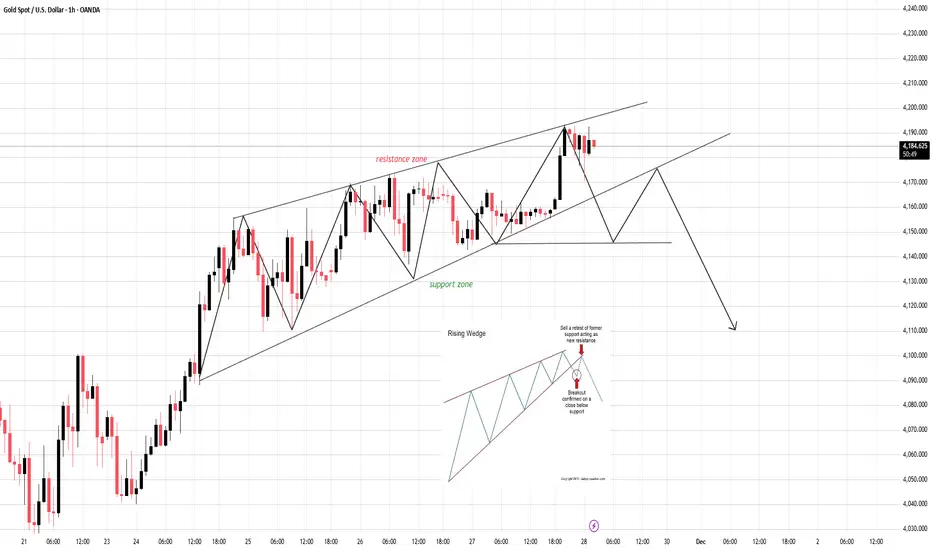
Rising Wedge on the Edge — The Breakdown Is Only One Candle AwayCURRENT MARKET ANALYSIS & TODAY’S EXPECTED MOVE
1. Current Market Structure
The market is currently respecting the structure of a Rising Wedge — a pattern where price continues rising but momentum weakens, volatility compresses, and the probability of a bearish breakdown increases.
Key observations:
- Price is moving near the upper boundary of the wedge.
- Newly formed highs lack strength → buying pressure is fading.
- Recent candles show long upper wicks, indicating strong sell pressure at resistance.
- The lower support line has been tested multiple times, increasing the likelihood of a breakdown.
- Buyers are losing control while sellers are beginning to step in.
2. Primary Scenarios for Today
✓ Scenario 1 – Breakdown of the Rising Wedge (High-probability scenario)
If a candle closes decisively below the lower support, the market is likely to:
- Drop quickly toward the next support levels.
- Trigger strong seller participation on the retest of the broken trendline (support → resistance).
- Confirm a high-quality SELL entry.
Downside Targets:
- Target 1: Nearest support zone
- Target 2: Previous low of the wedge
- Target 3: Major support below (depending on your timeframe)
✓ Scenario 2 – Price holds but remains weak
If price bounces from the lower edge but fails to break the upper boundary:
- The structure remains weakly bullish but vulnerable.
- Any upward move is fragile and easy to reverse.
- Not suitable for chasing BUY positions.
- Bulls need a strong breakout above the upper trendline to reverse the bias — which currently has a lower probability.
3. Intraday Trend Bias
Today’s intraday bias remains: DOWN (or at least corrective to the downside).
Confirmation signs:
- Support becomes easier to break the more it is tested.
- Volume is weak on bullish moves.
- Price action is tightening → preparing for a breakout.
- Sellers will wait for a clean retest, as shown in your reference chart.
4. Conclusion
The market is approaching the end-phase of a Rising Wedge, a classic bearish reversal pattern.
Priority today: Wait for breakdown → retest → SELL.
Avoid chasing BUY setups due to high reversal risk.
Expected development:
Break support → Retest → Continue dropping
“Your edge is built from discipline — not every setup must be traded, but every trade must follow your plan.”
Drop your market bias in the comments — do you expect the breakdown or a surprise breakout?
Gold next move (gold looks fragile)(24-11-2025)Go through the analysis carefully and do trade accordingly.
Anup 'BIAS for the day (24-11-2025)
Current price- 4075
"if Price stays below 4095, then next target is 4065, 4050 and 4025 and and above that 4100, 4115 ".
-POSSIBILITY-1
Wait (as geopolitical situation are worsening )
-POSSIBILITY-2
Wait (as geopolitical situation are worsening)
Best of luck
Never risk more than 1% of principal to follow any position.
Support us by liking and sharing the post.

XAUUSD: The upward trend remains intact; wait for entryGold remains in an overall uptrend, but bullish momentum is clearly weakening, making today a crucial session.
Whether prices can continue moving higher will largely depend on whether gold can hold the current pullback. If support holds, the next leg up is likely to be even stronger. If not, the market will likely slip into a choppy, range-bound pattern.
Over the past two weeks, markets have been heavily pricing in a Fed rate-cut narrative, and much of that expectation is now largely priced in.
At the same time, the nomination of a new Federal Reserve Chair has returned to the center of market attention. Regardless of who is selected, the candidate is widely expected to be dovish, or they would not have been nominated in the first place.
A dovish chair would inherently support rate cuts—a bullish factor for gold.
Therefore, even if gold experiences short-term pullbacks or weakening momentum, the broader bullish trend remains unchanged.
For today, the key price levels to watch are $4,180 and $4,200.
If price reaches these zones, they may offer actionable trading opportunities.

ARE INVESTORS PRICING IN ON DECEMBER RATE CUT EXPECTATIONS Gold is trading around the 4240 level during today’s session, showing early signs of bullish momentum. This suggests that buyers are active, possibly reflecting broader market expectations surrounding a potential December rate cut and recent dovish remarks from Federal Reserve officials. These factors have contributed to increased interest in safe-haven assets, which I’m keeping in consideration for today’s analysis.
On the technical side, I’m personally watching the 4193 area as an intraday support zone. This level has been important for maintaining structure and may help indicate whether buyers can remain in control.
To the upside, 4256 stands out as the immediate resistance area I’ll be observing. How price behaves around this zone may offer clues about whether the bullish momentum can continue or if the market pauses.
These are simply my intraday observations for educational purposes and discussion within the community.

XAUUSD - Sell IntradayBreakout of the trendline can be a good trade on the sell side, if the trade gets activated.
Follow Risk management, as every trade can fail.

XAUUSD structure is still bullish XAUUSD structur is still bullish
I will buy on every DIP
As I mentioned 4180-4190 area is my buy zone .
Secondly if H4 closed below 4175 then market will retest my 4145-4135 structural demand zone where I will start buying again .
Target remain same 4245 then 4275 on intraday

With perfect timing in trading, where will gold go next?Gold closed in a narrow range yesterday with light trading, consolidating within the 4160-4150 range, perfectly in line with our expectations. After opening today, gold broke through the trendline resistance, officially entering a bullish phase. The longer the consolidation, the higher the potential rise; the upward momentum is expected to be significant. If gold prices break through and stabilize above 4200 as anticipated, further upside potential will open up. Long positions can wait for a pullback before considering appropriate entry opportunities. From a 4-hour chart perspective, gold broke upwards after consolidating sideways around the middle Bollinger Band and trend line, indicating a clearly bullish structure. There is still momentum for further upward movement in the short term. The recommended strategy is to buy on dips, focusing on support around 4175-4160, and resistance at 4200 and 4245. It's important to note that today is the monthly closing day; while bullish, be wary of a potential technical pullback after the initial surge. Overall, the trend remains bullish. After a period of consolidation, today's price action broke through the previous secondary high resistance level, making the direction very clear. Following this trend, the focus for today should be on buying on dips.

GOLD its breakout? its selling turn??#GOLD... market just broke again his supporting area and in last turn market gave is a fake breakout.
so again if market holds below 4178-80 then we can expect further drop towards next supporting area.
stay sharp guys..
good luck
trade wisely

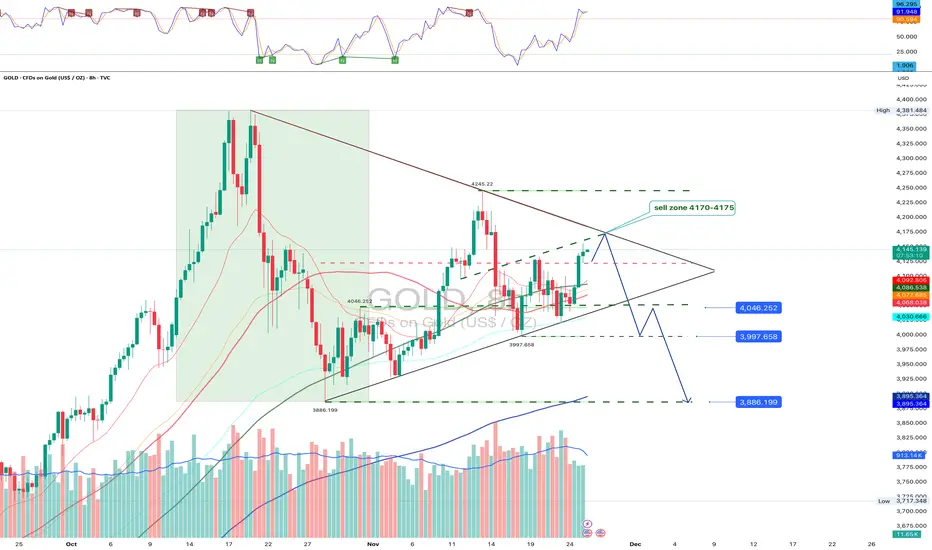
GOLD approaches a critical inflection inside the triangleGold is compressing inside a large triangle on the four hour chart and has returned to the twenty four hundred seventy area which acts as the main sell zone at four thousand one hundred seventy to four thousand one hundred seventy five. The market still fails to break above this region and preserves a sequence of lower highs. A breakdown through the triangle support may open the path toward four thousand forty six three thousand nine hundred ninety seven and three thousand eight hundred eighty six where strong liquidity and the two hundred period moving average converge.
The fundamental picture as of November twenty fifth remains mixed. United States inflation is cooling more slowly than expected which keeps treasury yields elevated and limits the attractiveness of gold as a defensive asset. Market expectations for a Federal Reserve rate cut in the first half of next year persist which supports the metal during pullbacks. Demand from Asian jewelry markets stays muted which adds pressure when yields rise.
Price is approaching a decision point. A rejection from the sell zone may send the market toward four thousand forty six three thousand nine hundred ninety seven and three thousand eight hundred eighty six. A confirmed move above four thousand one hundred seventy five will invalidate the bearish scenario and allow a possible breakout to the upside although the market still looks weaker than the seller for now.
Gold is precious without doubt but inside a triangle nothing shines too confidently until the market shows its choice.
XAU/USD Looking sell from supply zone at 4240 strong sellXAUUSD (Gold) – 1H Bearish Setup
Price is currently reacting from the 4240 supply zone, showing signs of weakness on the 1-hour timeframe.
I’m looking for a sell opportunity at the 4220 level.
Targets:
• TP1: 4207
• TP2: 4190
• TP3: 4171
Market structure remains bearish for now, but always remember:
✔️ Follow your trading plan
✔️ Use proper risk management
✔️ Protect your capital first
If you find this analysis helpful—Like, Follow, Comment & Share 🔄

XAUUSD – Possible Ending Diagonal Completing Wave (5)Gold appears to be forming a classic Ending Diagonal structure for the final Wave (5). Price action is compressing inside a narrowing wedge, with each push up showing clear loss of momentum — typical behavior for a terminal wave.
🔍 Structure Breakdown
Wave (3) is confirmed.
Wave (4) retracement respected the lower structure.
Current price action is unfolding inside a rising wedge, matching all characteristics of an Ending Diagonal:
Overlapping waves
Converging trendlines
Weakening momentum on each new high
Waves (A)(B)(C)(D)(E) of the internal wedge are completed.
🔻 Bearish Implication
If this diagonal is valid, Wave (5) is likely in its final stage.
A break below the lower wedge trendline would confirm the reversal and open the road toward the next major support — the base trendline of the larger channel.
This would signal the beginning of a sharp corrective move, as Ending Diagonals usually unwind aggressively.
📉 What I’m Watching
Breakdown of the wedge = confirmation
Volume/momentum expansion on the break
