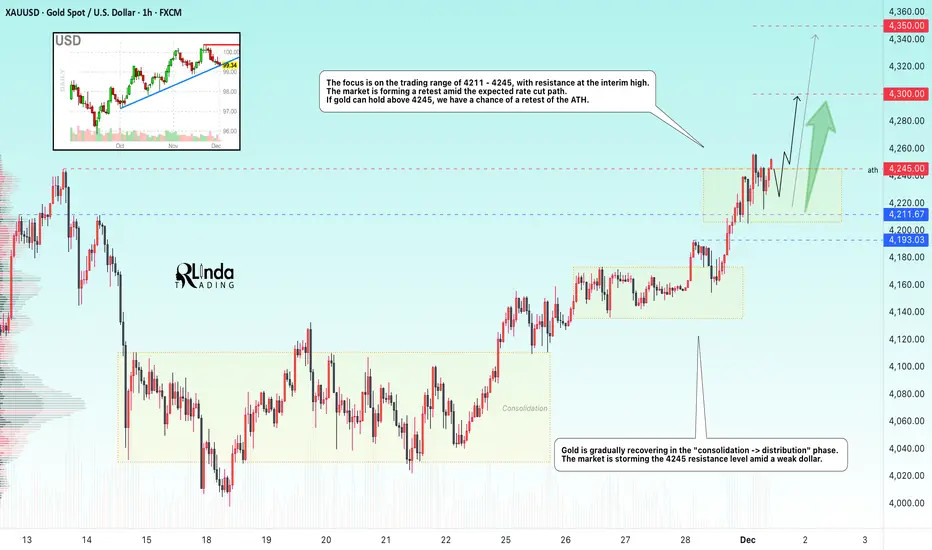
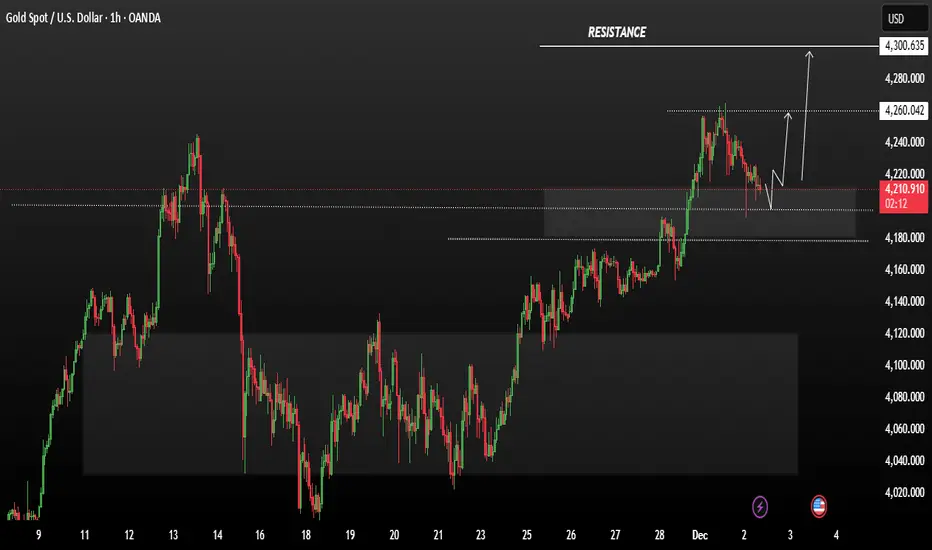
GOLD → The bullish trend continues. Retest of 4250FX:XAUUSD is trading at six-week highs near $4,250, supported by a weaker dollar and expectations of a Fed rate cut. The market is storming key resistance...
The probability of a December rate cut is 87%. The dollar is posting its worst week in four months after failing to consolidate above 100.0. A break in local trend support could trigger a decline in the index, which would support gold.
Today's focus is on the ISM Manufacturing PMI (forecast: 48.6). Weakness in the data could increase pressure on the dollar and support gold.
Gold maintains its upward trend, supported by loose monetary policy. Key data this week could boost momentum ahead of the Fed meeting.
Resistance levels: 4245, 4300
Support levels: 4211, 4193
A retest of 4245 could end with a pullback within the current consolidation at 4211 - 4245. Two scenarios: If the bulls hold the price above 4245, a rally to 4300 is expected. Otherwise, the market could retest 4215 - 4211 with the aim of a long squeeze before rallying. The trend is bullish, and the fundamental background is relatively positive.
Sincerely, R. Linda!
Trade ideas
XAU/USD | Gold Update : Watching 4192 and 4240 Closely!By analyzing the #Gold chart on the 4 hour timeframe, we can see that price followed the previous analysis perfectly and hit the first target at $4240, even pushing slightly higher to $4242. After that move, gold pulled back and corrected all the way down to $4175. Right now gold is trading around $4192, which is basically a neutral zone with no clear direction yet.
We need to see whether price can climb back above $4240 again or not. One important point: if gold fails to hold above $4192 within the next hour, we might see another heavier drop. Keep an eye on the reaction to these key levels. I will update this analysis again soon.
Please support me with your likes and comments to motivate me to share more analysis with you and share your opinion about the possible trend of this chart with me !
Best Regards , Arman Shaban

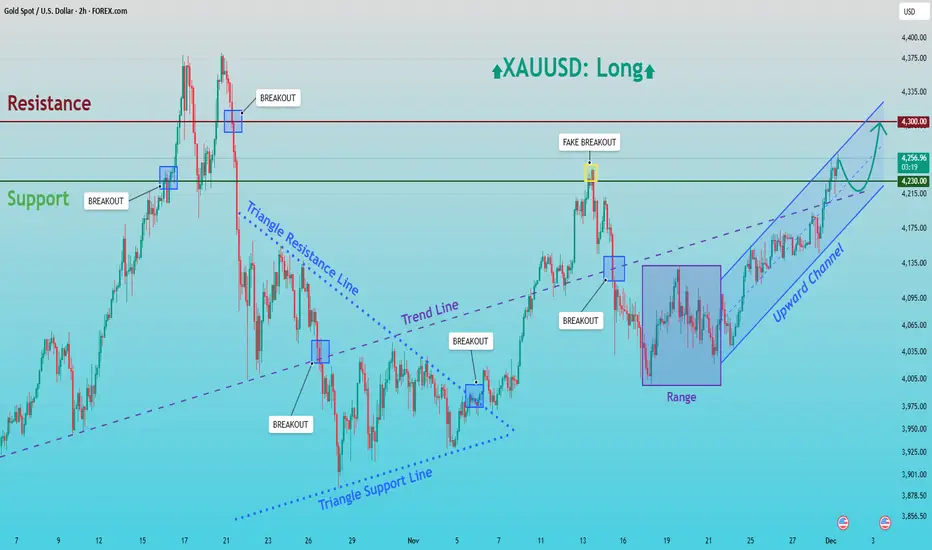
XAUUSD: Buyers Eye Retest of the $4,300 Resistance ZoneHello everyone, here is my breakdown of the current XAUUSD setup.
Market Analysis
Gold continues to trade within a well-structured bullish environment following a strong recovery from the lower Triangle Support Line earlier in the month. After a prolonged corrective phase inside a symmetrical triangle, price eventually broke above the Triangle Resistance Line, shifting the market structure from consolidation into bullish continuation. This breakout created a clear trend shift, supported by a steady sequence of higher highs and higher lows. After the breakout, XAUUSD entered a temporary Range phase, suggesting accumulation from buyers before the next impulsive move. Once price broke out of that range to the upside, the market formed a clean Upward Channel, showing sustained bullish pressure. A notable fake breakout above the Resistance Zone around 4,260 occurred recently, indicating strong seller activity at the top of the zone, but buyers quickly regained control and continued to push price upward within the channel.
Currently, gold is trading near the mid-upper area of the Upward Channel, approaching the 4,300 key Resistance Zone. The broader technical picture shows clear bullish market structure, with trendline support and channel dynamics favoring further upside as long as the channel remains intact.
My Scenario & Strategy
My scenario is bullish, supported by the strong rebound within the Upward Channel and the consistent higher-low structure. As long as price remains above the 4,215–4,230 Support Zone and respects the channel’s lower boundary, buyers hold a clear advantage. My expectation is that XAUUSD may make a minor pullback toward the mid-channel zone near 4,230 to gather liquidity before continuing the upward movement.
Therefore, the primary bullish target remains the 4,300 Resistance Zone, where a retest is highly probable. A clean breakout above 4,300 would open the door for a stronger rally and signal continuation of the broader bullish cycle. However, if gold fails to break the resistance and forms a deeper correction, the Upward Channel support and the prior breakout zone at 4,215 will be key levels to watch. The bullish bias remains valid as long as these supports hold. For now, the structure favors a long scenario with attention on the move toward 4,300 and potential bullish continuation beyond that level.
That's the setup I'm tracking. Thank you for your attention, and always manage your risk.
Gold: Safe-Haven Demand Surges After Venezuela TensionsHey Traders,
In the coming week we are monitoring XAUUSD for a potential buying opportunity around the 4,195 zone. Gold remains in a clear uptrend, and the current correction is guiding price back toward a major support-and-trendline confluence, where buyers have consistently defended the structure.
On the fundamental side, safe-haven flows are heating up again.
Following Trump’s announcement that a land operation against Venezuela is expected to begin soon, markets quickly shifted into risk-off mode. Geopolitical uncertainty has historically driven capital toward traditional havens — and Gold often reacts first.
If tensions continue to escalate, the 4,195 zone could become the launchpad for the next bullish extension, with sentiment strongly supporting upside.
Trade safe,
Joe

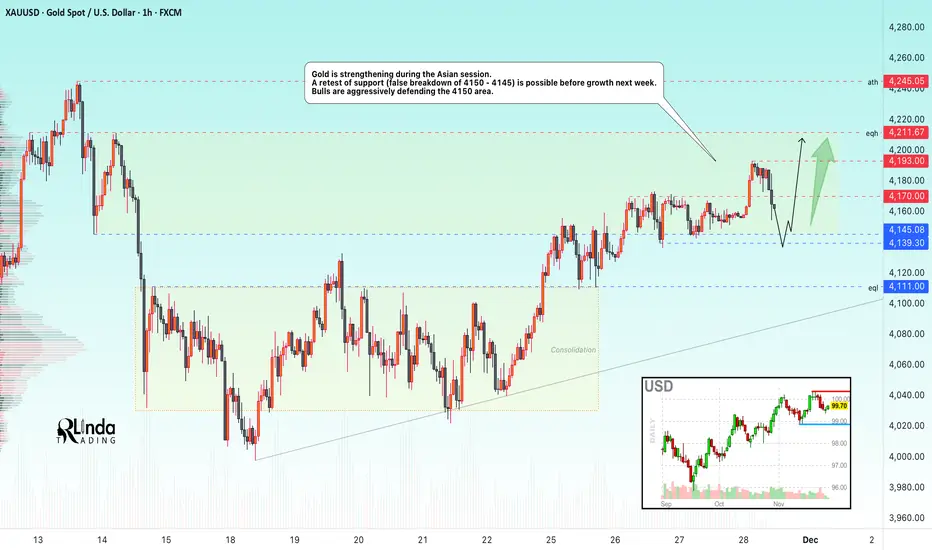
GOLD → Consolidation above 4150 amid a bullish market FX:XAUUSD breaks through 4170 and renews its high to 4193 during the Asian trading session. But further on, the market may consolidate before a possible continuation of growth...
The probability of a Fed rate cut in December remains at 82%. Geopolitical risks (Russia-Ukraine) continue to support demand for safe-haven assets. Weekly growth continues, but consolidation above $4170-4190 is required for the movement to continue.
However, low liquidity is expected on Thursday/Friday due to the holidays in the US. There may not be any strong movement, but volatility could be high during the European/American session...
Focus on the current trading range of 4150-4193...
Resistance levels: 4170, 4193, 4211
Support levels: 4150, 4145, 4139
The market is bullish both globally and locally. Accordingly, within the current trading range, gold may form a long squeeze relative to support and the liquidity zone at 4150. If the fundamental background does not change over the weekend, growth may continue next week...
Best regards, R. Linda!
GOLD → Retest of consolidation support on uptrend FX:XAUUSD is trading in a sideways range around $4,200, awaiting new labor market data to determine the Fed's policy trajectory after December's rate cut.
Weak US data (a 32K decline in ADP employment and a slight increase in ISM services to 52.6) did not change market expectations. The probability of a 25 bp Fed rate cut on December 11 is around 90%. Attention has shifted to the trajectory of policy easing in early 2026. Key factors will be data on unemployment claims and sentiment on Wall Street.
The fundamental background is relatively positive, and the dollar has entered a correction phase due to expectations of lower rates, which may support the gold price...
Resistance levels: 4238, 4262
Support levels: 4185, 4175
Gold is testing the support levels of the key trading range. If the bulls keep the price above 4185 and form a bullish reversal pattern, then in the short and medium term, we can expect growth to intermediate highs.
Best regards, R. Linda!

GOLD 4H CHART ROUTE MAP UPDATE & TRADING PLAN FOR THE WEEKHey Everyone,
Please see our 4h chart remaining levels and targets for the coming week with one updated Goldturn.
We are now seeing price play between two weighted levels with a gap above at 4224 and a gap below at 4124. We will need to see ema5 cross and lock on either weighted level to determine the next range.
We will see levels tested side by side until one of the weighted levels break and lock to confirm direction for the next range.
We will keep the above in mind when taking buys from dips. Our updated levels and weighted levels will allow us to track the movement down and then catch bounces up.
We will continue to buy dips using our support levels taking 20 to 40 pips. As stated before each of our level structures give 20 to 40 pip bounces, which is enough for a nice entry and exit. If you back test the levels we shared every week for the past 24 months, you can see how effectively they were used to trade with or against short/mid term swings and trends.
The swing range give bigger bounces then our weighted levels that's the difference between weighted levels and swing ranges.
BULLISH TARGET
4224
EMA5 CROSS AND LOCK ABOVE 4224 WILL OPEN THE FOLLOWING BULLISH TARGET
4328
EMA5 CROSS AND LOCK ABOVE 4328 WILL OPEN THE FOLLOWING BULLISH TARGET
4422
EMA5 CROSS AND LOCK ABOVE 4422 WILL OPEN THE FOLLOWING BULLISH TARGET
4494
BEARISH TARGETS
4124
EMA5 CROSS AND LOCK BELOW 4124 WILL OPEN THE FOLLOWING BEARISH TARGET
4042
EMA5 CROSS AND LOCK BELOW 4042 WILL OPEN THE SWING RANGE
3964
3873
As always, we will keep you all updated with regular updates throughout the week and how we manage the active ideas and setups. Thank you all for your likes, comments and follows, we really appreciate it!
Mr Gold
GoldViewFX

Gold Pullback or Breakout? Sitting at the Edge of a Bigger MoveGold Pullback or Breakout? XAUUSD Sitting at the Edge of a Bigger Move
Gold is coiling in a narrowing channel, and this kind of structure usually ends with a sharp directional break. The chart shows buyers trying to defend the mid-zone, while the broader trend still leans corrective. With macro fundamentals shifting fast and volatility picking up around U.S. data, gold is getting primed for a move that won’t stay quiet for long.
Current Bias
Short-term neutral leaning bullish.
Medium-term bullish if buyers defend the lower channel and reclaim the upper trendline.
Key Fundamental Drivers
• US inflation and labour data are softening (per recent BLS and ADP reports), reducing expectations of aggressive Fed tightening. This generally supports gold.
• US yields have eased from recent highs, reducing opportunity cost of holding gold.
• Geopolitical tensions (Middle East, Ukraine, South China Sea) are keeping a haven bid under gold.
• Strong central-bank buying continues to act as a long-term floor for gold prices.
• USD movement remains the dominant short-term driver.
Macro Context
• Interest rate expectations: Markets are pricing a slower Fed path, especially after soft labour prints and cautious speeches from Cook and other Fed officials. A stable-to-mildly-dovish Fed environment supports gold.
• Global growth trends: Europe remains in a slowdown according to Sentix, while Asia shows modest improvement. Weak global growth tends to boost gold.
• Commodity flows: No supply shocks, but ETF outflows are stabilizing—another supportive sign.
• Geopolitics: Israel–Lebanon escalation risk remains in play. Several global risk headlines recently helped gold find intraday support.
Primary Risk to the Trend
A strong USD rally—especially if driven by unexpected U.S. data strength or hawkish Fed comments—would pressure gold back into deeper corrective territory.
Most Critical Upcoming News/Event
• US FOMC speakers (multiple appearances)
• US CPI revisions and PPI data
• US unemployment claims and PMIs
These will decide whether yields move higher again or give gold room to rally.
Leader/Lagger Dynamics
Gold is usually a lagger to:
• USD direction
• US yields
• Fed expectations
But becomes a leader during periods of heavy geopolitical risk, when it pulls safe-haven assets like CHF and JPY with it.
Right now, XAUUSD is following USD and yields more closely than risk sentiment.
Key Levels
Support Levels:
• 4,000 – 3,985 zone (major demand area)
• 3,960 (channel low / liquidity sweep potential)
Resistance Levels:
• 4,115 – 4,135 (mid-range supply)
• 4,245 (major resistance + previous high)
Stop Loss (SL):
• 3,960 (below channel structure)
Take Profit (TP):
• TP1: 4,115
• TP2: 4,245
Summary: Bias and Watchpoints
Gold is building energy inside a narrowing channel, and the next macro catalyst will likely determine the breakout direction. My bias is neutral-to-bullish as long as price holds above the 4,000 zone and avoids a breakdown toward 3,960. The key drivers are weakening U.S. data, softer Fed expectations, and a stable-to-higher geopolitical risk backdrop. The biggest risk is a USD rebound powered by hotter-than-expected U.S. numbers. The most important event ahead is the cluster of U.S. inflation and labour releases, which will directly influence yields and therefore gold. Stops sit cleanly below 3,960, and the natural upside magnet remains 4,115 first, then 4,245 if momentum builds.
XAU/USD | Gold hit $4200, Is It Time to Fall Again? (READ)By analyzing the #XAUUSD chart on the 4 hour timeframe, we can see that after the previous analysis, gold moved exactly as expected. Even with the low volatility during Thanksgiving, price still managed to hit both the $4190 and $4200 targets.
Once gold entered the supply zone at $4208 to $4244, it started to pull back and is now trading around $4196.
As we approach the final hours of the session, we need to watch how price reacts to its key supply and demand levels. This analysis will be updated soon.
Please support me with your likes and comments to motivate me to share more analysis with you and share your opinion about the possible trend of this chart with me !
Best Regards , Arman Shaban

XAUUSD Market Outlook — Targets AheadThe XAUUSD chart shows price reacting strongly from a major resistance zone highlighted by the blue area, where price has previously reversed. After retesting this resistance again, price formed a rejection candle, signaling a potential short-term pullback. The market is still respecting the ascending trendline, but a break below it would confirm downside momentum. If price fails to break above the resistance zone, the bearish correction may continue toward the marked support levels. Target 1 is 4,192, where initial support and minor structure align. A deeper move could extend toward Target 2 at 4,153, which matches previous demand and cloud support. A break below these levels may open the way toward lower zones.
If you found this XAUUSD analysis helpful, don’t forget to LIKE 👍 and COMMENT 💬!

THE KOG REPORT - UpdateEnd of day update from us here at KOG:
Not a bad start to the week with price giving us a tap and bounce from that 4220 level we gave yesterday and attacking the 4260 level which we said to monitor for the rejection. The indicators gave the signal and the red box rejected, giving us a nice move downside as we wanted.
Now we have a swing low in play with the resistance level above at the 4255 level which will need to break, however, there is still defence above so we'll keep an eye on that level again over the sessions to come. Ideally, support below 4228 will be the decider!
We'll stick with the plan for now.
RED BOXES:
Break above 4230 for 4237✅, 4247✅, 4250✅ and 4260✅ in extension of the move
Break below 4210 for 4199, 4195 and 4165 in extension of the move
Please do support us by hitting the like button, leaving a comment, and giving us a follow. We’ve been doing this for a long time now providing traders with in-depth free analysis on Gold, so your likes and comments are very much appreciated.
As always, trade safe.
KOG

XAUUSD – Weekly Scenario: Target Expands to 4,580 RegionXAUUSD – Weekly Scenario: Target Expands to 4,580 Region
Brian – Only prioritize buying if the price remains above 3,996
1. Market Overview – Breaks Triangle, Confirms Uptrend
On the D1 frame, gold has clearly broken out of the accumulation triangle that lasted for weeks.
The sixth candle closed above the descending trendline – which has been the main resistance for a long time – indicating:
Buying power has returned to control the market.
There is a high probability that this is a confirmation of the medium-term uptrend.
Above, the 4,246 region is considered the next “trend confirmation point”:
If the price breaks and holds above 4,246, the path to higher regions, especially 4,360–4,380 and 4,560–4,580, will open according to the Fibonacci expansion roadmap on the chart.
In summary: moving into next week, the current structure supports the bullish scenario, viewing corrections mainly as opportunities to buy.
2. Technical Structure – From Breakout to Fibonacci Levels
The breakout from the triangle occurred after a series of higher lows, bouncing from the lower ascending trendline → leaning towards accumulation, not distribution.
Below the current price are important demand/support regions:
The trendline area around 4,110 – an area to watch for entry plans.
Deeper are the 4,040 and 3,920 regions if a strong correction occurs.
Above, the technical “roadmap” is quite clear:
Point 1: 4,246 – near resistance + retest of the old supply area.
Point 2: 4,360–4,380 – old ATH/peak area, coinciding with the 1.0 Fibonacci region on the chart.
Point 3: 4,560–4,580 – 1.618 Fibonacci region, also the expansion target for the medium-term bullish scenario.
As long as D1 maintains the higher high – higher low pattern and does not break 3,996, the priority remains to view gold in the “buy the dip” frame.
3. Price Zones & Trading Ideas for Next Week
This is not personalized advice, but how Brian is mapping the chart for himself:
Main Scenario – Buy on Trendline/Support
Watch area: around the ascending trendline area of 4,110.
If early in the week there is a correction to this area with a nice candle reaction on H4/D1 (long lower tail, bullish engulfing…), that is the area I prioritize for finding a Buy entry point.
Target roadmap:
Target 1: 4,246 – resistance & trend confirmation area.
If break & retest 4,246 successfully from above, the next bullish wave could expand to 4,360–4,380.
Extended Target: 4,560–4,580 according to 1.618 Fibonacci as shown in the image.
Secondary Scenario – Use Fibonacci Area When Price Exceeds 4,246
When gold exceeds and holds above 4,246, then the 4,360–4,380–4,580 areas will be:
Areas to partially take profit / move SL to protect profits.
At the same time, short pullbacks from this area, if still respecting the uptrend structure, can continue to be opportunities to buy more with the final target of 4,580.
Invalidation Level:
Closing D1 below 3,996 will ruin the current uptrend structure.
At that point, I will stop the medium-term buy strategy, stand aside to observe and wait for a new structure, instead of holding onto the old view.
4. Fundamental Perspective – Why is Gold Still Supported?
On the macro side, gold is being affected by the interplay of:
Tariffs & trade tensions → increasing demand for defense, hedging policy risks.
War and geopolitical conflicts → maintaining gold’s classic “safe haven” role.
End of interest rate cycle: after a long period of interest rates being “pumped” high, the market is increasingly focused on the question “when” rather than “if” they will decrease. This makes non-yielding assets like gold more attractive in the eyes of long-term capital.
Overall, the current fundamental picture is limiting the deep decline of gold: each strong drop often soon sees bottom-fishing buying power, as long as the technical structure is not broken.
5. Strategy & Risk Management
In the coming week, Brian’s bias is quite clear:
→ Prioritize buying on corrections, as long as the price remains above 3,996.
The trendline area around 4,110 is the first place I pay attention to for the buy scenario; if the market is “more generous” and pulls deeper to 4,040–4,000 but still maintains the uptrend structure, that is an even more attractive price for a medium-term position.
Most importantly:
The order volume must be suitable for the account.
Have a plan to move SL/take profit when the price approaches each point 4,246 → 4,360 → 4,580, instead of trying to “hold the peak.”

Unlock Hidden Trading Edges: Master Support & Resistance Levels Master Support & Resistance Levels – The Most Powerful Tool in Technical Analysis 📈🔥
Support and Resistance (S&R) are the foundation of price action.
Support = where price tends to stop falling (buyers step in) 🛡️
Resistance = where price tends to stop rising (sellers take control) ⚔️
These levels are not always exact, but when used correctly they give you high-probability entries and exits in Forex, Crypto, and Stocks.
How to Find Strong S&R Levels:
1-Look left → Previous swing highs & lows
The more times price has touched and bounced, the stronger the level becomes.
2-Round numbers & psychological levels
Examples: $50,000 BTC, 1.2000 EUR/USD, $200 AAPL – traders love these!
3-Use TradingView tools
Horizontal Line
Fibonacci Retracement (38.2%, 50%, 61.8%)
Volume Profile (High-volume nodes often act as S&R)
2Role Reversal – The Magic Trick ✨
Broken resistance → becomes new support
Broken support → becomes new resistance
This is where the big moves start!
Real Examples Right Now:
Bitcoin → $100,000 break support → now strong resistance
Pro Tips:
Always check multiple timeframes (Daily + 4H give the strongest levels)
Combine with RSI or volume for confirmation
Place stop-loss just below support / above resistance
When a level breaks with high volume → jump on the breakout!
Start drawing your S&R levels today and watch your win rate improve instantly.
Which market are you trading right now? Drop your favorite S&R level in the comments! 👇
GOLD Consolidation bullish run momenmtumGold moved into consolidation after a bullish run. The metal pulled back to $4110/oz on Tuesday as investors booked profits following Monday’s six-week high. The market is now focused on U.S. interest rate expectations, with growing anticipation of a rate cut next week. Traders are also awaiting remarks from Federal Reserve Chair Jerome Powell later today for additional guidance on the Fed’s rate trajectory.
Price retested the 4205 zone and rebounded, indicating a healthy pullback within the uptrend If bulls successfully hold the 4210 support range, upward momentum could strengthen quickly On the upside, the next major resistance levels to watch are 4260 and 4300.
You may find more details in the chart.
Trade wisely best of luck buddies.
Ps; Support with like and comments for better analysis thanks for supporting.
BULLISH MOVE - GOLDHello traders,
the gold price has broken out of its descending channel.
This breakout signals a shift in momentum,
so I’m expecting a bullish continuation in the coming sessions.
🎯 TARGET: 4245.000

XAUUSD: Strong Growth and Buying OpportunityWith the prospect of a Fed interest rate cut and the weakening of the USD, XAUUSD is showing signs of a strong growth phase. Based on macroeconomic news and technical charts, we can see that the price of gold continues to hold steady above the uptrend line .
XAUUSD is currently pulling back to instant support at 4,120,000 USD . The uptrend is supported by the EMA (34, 89) indicators and the current upward trend. The strong support at 4,120,000 USD plays a crucial role in maintaining this upward momentum.
Short-Term Forecast:
XAUUSD could continue to rise to higher levels if it holds above 4,120,000 USD, with the next target being the TP1 level at 4,200,000 USD , and even the TP2 level at 4,250,000 USD . This is supported by market expectations that the Fed will continue to lower interest rates in December, weakening the USD and boosting demand for gold as a safe-haven asset.
Conclusion:
With a stable upward trend and support from both the market and chart indicators, XAUUSD is likely to continue its upward movement. If there is a pullback to the support level, it will provide an excellent opportunity for buying.

Gold 4H – Can XAUUSD reject 4245 before diving into 4140?📈 Market Context
Gold rallied as the U.S. dollar closed softer on repriced Fed rate-cut expectations, with market headline flow confirming USD finishes lower and gold rallies on renewed cuts timing debates — a setup that encourages external liquidity raiding before weekly direction is revealed. Forex Factory
4H conditions are classic for liquidity engineering: price trades near balanced mid-range flows, institutions exploit USD weakness into weekly open, and both buyer/seller pools are vulnerable to strategic sweeping before expansion.
Expect volatility spikes around U.S. session opens and PMI headline catalysts.
🔎 Technical Analysis (4H / SMC View)
🟢 Buy Zone: 4140–4138
SL: 4130
TP targets: 4175 → 4200 → 4220 → 4250 → 4280+
Rationale:
• Discount zone beneath 4H liquidity shelf
• Demand mitigation + accumulation narrative after sweep
🔴 Sell Zone: 4245–4247
SL: 4255
TP targets: 4220 → 4200 → 4175 → 4150 → 4140
Rationale:
• Premium supply above equal-high liquidity
• 4H imbalance magnet below waiting to be filled
⚠️ Risk Management Notes
• Wait for M15 ChoCH / BOS confirmation before entries — avoid blind positioning.
• Expect wider spreads and wick manipulation on USD headline releases.
• Avoid trading 10–20 minutes before high-impact USD news (PMI, Fed speakers).
• Scale partials at each TP level, let runners work only after confirmation is printed.
Summary
Gold remains in 4H rangebound engineering territory where Smart Money is likely to sweep premium above 4245, deliver a correction to 4140, then seek a validated bullish reaction from discount demand on confirmed USD volatility.
Patience and confirmation first. Liquidity always wins.
🚀 Follow @Ryan_TitanTrader for more weekly SMC setups

1 Test – 2 Breaks” in Gold: How It WorksIn the gold market, there’s a price behavior pattern that professional traders always pay attention to: “1 test – 2 breaks”.
This is not a lucky pattern or a coincidence — it is a repeating market behavior driven by liquidity, psychology, and institutional order flow.
Once you understand this rule, you’ll read gold’s movement far more clearly, especially during volatile phases.
1. What does “1 test – 2 breaks” actually mean?
This rule describes how gold typically reacts when it approaches a major support or resistance zone:
First time:
Price tests the level and rejects strongly.
Traders think the zone is “solid”.
Second time:
Price returns but reacts weaker.
This is where the market is collecting liquidity.
Third time:
The level gets broken decisively, starting a strong move in the breakout direction.
In short:
Gold respects the level the first time, tricks traders the second time, and breaks for real on the third.
2. Why does gold follow this rule so often?
Not random.
There are three core reasons:
2.1. Gold has extremely high liquidity
Gold (XAUUSD) is one of the most liquid assets in the world.
Institutions dominate
Volatility is high
Price often seeks stop-loss zones
This makes support/resistance areas get tested multiple times before the real break.
2.2. Retail traders believe too much in “strong levels”
Retail traders tend to:
Buy at support
Sell at resistance
Place SLs below/above obvious levels
Result?
Market makers know exactly where liquidity clusters are , so they push price to test those zones multiple times before the real move.
2.3. Institutions need liquidity to build large positions
Big players can’t:
Buy directly at the bottom
Sell directly at the top
They need price to revisit the zone to gather liquidity → then break it decisively.
The “1 test – 2 breaks” pattern reflects this institutional flow perfectly.
3. How to apply this rule in gold trading
(1) Don’t enter on the first test
The first reaction is strong but often not sustainable .
Avoid FOMO — just observe.
(2) The second test reveals the market’s intention
If the second reaction is:
Weaker
Low momentum
Weak rejection wicks
Lack of strong buyers/sellers
→ It likely indicates liquidity harvesting.
(3) The third approach is where the breakout often happens
If price comes back the third time with:
Faster momentum
No higher highs / lower lows
No clear rejection
Clean, steady approach
→ It’s a strong sign the zone is about to be broken cleanly .
You can then look for breakout entries or retest entries.
4. Important notes
Don’t apply this rule mechanically
Only use it on significant zones, especially on H1 and H4
Confirm with momentum or volume
Avoid using it during high-impact news (NFP, CPI, FOMC…)
5. Conclusion: Gold doesn’t move randomly — it repeats behavior
The “1 test – 2 breaks” rule works because:
Institutions need liquidity
Retail SLs cluster at predictable spots
Gold’s volatility + liquidity amplify the pattern
Recognizing this gives you:
Fewer premature entries
Fewer SL hunts
More confidence during real breakouts

XAUUSD Long: Channel Support Holding — Buyers Target 4,300 ZoneHello, traders! The price auction for XAUUSD has been unfolding within a clearly structured bullish progression after a period of heavy distribution inside the Supply Zone. Earlier, gold established a wide Range between the Supply and Demand areas, with multiple sharp rejections forming the top of the structure. Eventually, sellers pushed the price lower, initiating a corrective decline that developed into a well-defined Triangle Pattern, marked by a descending Triangle Supply Line and a rising Triangle Demand Line. This compression ended with a clean breakout to the upside, signaling the beginning of a new bullish phase. Following the breakout, XAUUSD formed a Pivot Point near the mid-range level, where price briefly rejected before continuing its upward trajectory. Another notable phase was the formation of an inverse Head-and-Shoulders structure, confirming buyer strength after a fake breakout below the neckline. This reversal pattern provided the foundation for the current bullish continuation.
Currently, gold is trading inside a strong Ascending Channel, respecting both channel boundaries with consistent higher highs and higher lows. The latest breakout from the mid-channel zone has kept the bullish structure intact, and after a corrective pullback to the lower channel boundary, price is attempting to resume upward movement. As long as price holds within this channel, the market dynamics favor a continuation toward the 4,300 resistance target, which aligns with the upper boundary of the channel and the previously broken structure.
My scenario for the development of events is bullish, with expectations of a rebound from the lower channel boundary followed by a continuation toward the 4,300 resistance level. In my opinion, maintaining structure within the ascending channel supports further upside as long as buyers defend the 4,110 support region below. Manage your risk!

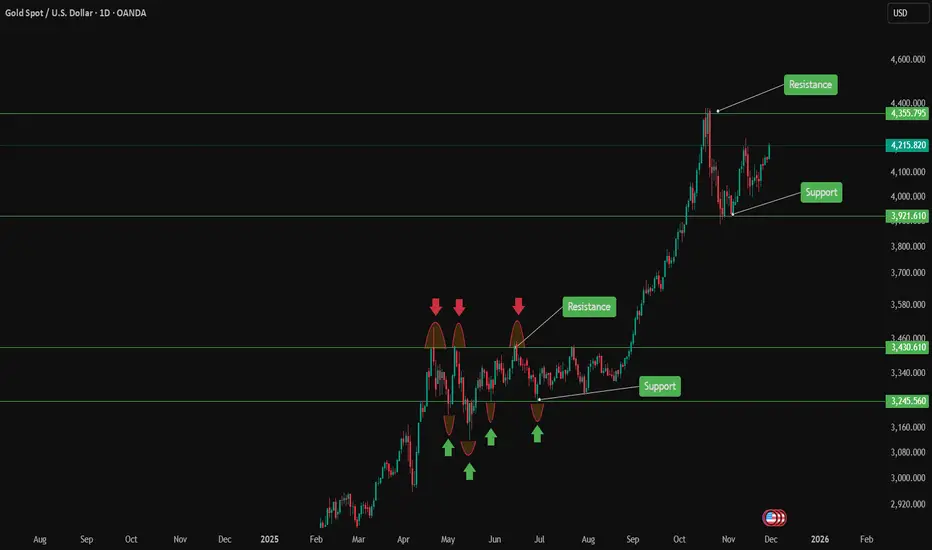
Gold - This is the bullrun top!⚰️Gold ( OANDA:XAUUSD ) is slowly reversing now:
🔎Analysis summary:
Starting back in the end of 2015, Gold established another major bullish cycle. Ever since the rounding bottom breakout, Gold has been rallying higher and higher. But at this exact moment, Gold retests major resistance and is slowly starting to create a reversal.
📝Levels to watch:
$4,000
SwingTraderPhil
SwingTrading.Simplified. | Investing.Simplified. | #LONGTERMVISION

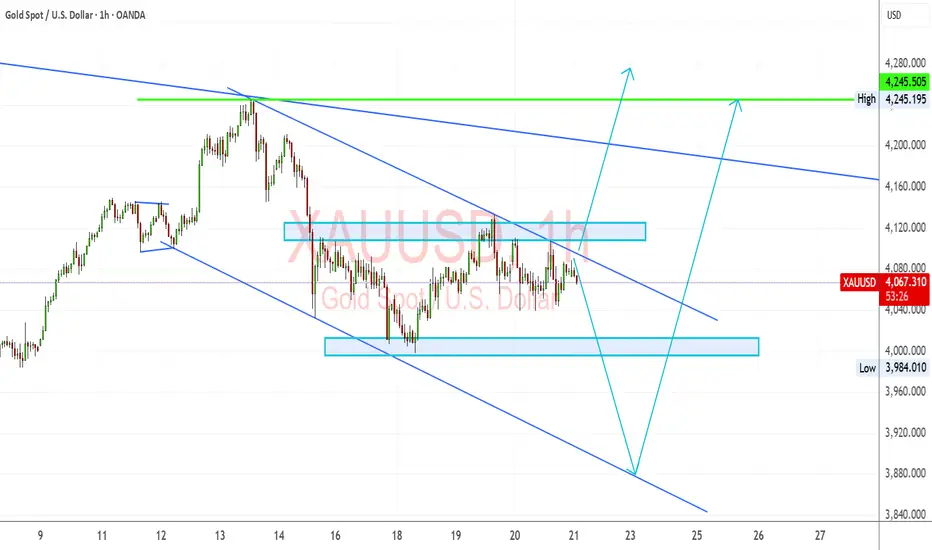
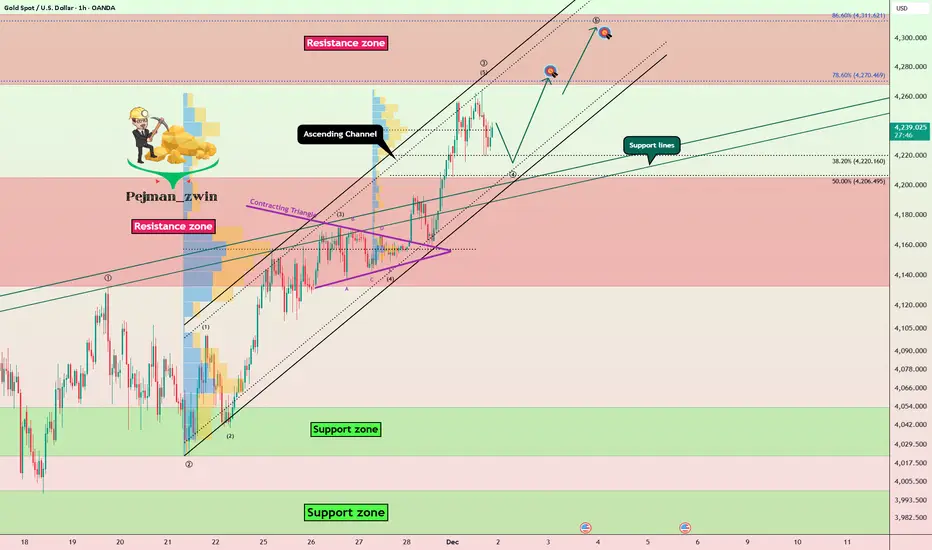
Gold Breakout + Wave Structure = New Targets LoadingGold( OANDA:XAUUSD ) has successfully broken through the Resistance zone($4,205 – $4,133) at the start of this new week, and over the past ten trading days, it seems to have formed an ascending channel.
From an Elliott Wave perspective, it looks like gold has completed wave 3 and is currently in the process of completing wave 4.
I expect that after a pullback toward the Resistance zone($4,205 – $4,133)—aligning with the lower line of the ascending channel and the support lines—gold will resume its upward movement and once again target the Resistance zone($4,316 – $4,261).
First Target: $4,266
Second Target: $4,294
Stop Loss(SL): $4,151
Note: Geopolitical tensions—especially the possibility of a direct confrontation between Venezuela and the U.S.—tend to push investors toward safe-haven assets, and gold historically reacts with strong upward momentum during such uncertainty. If this conflict escalates, increased risk aversion and volatility across global markets could support a bullish continuation in gold as capital shifts away from risk assets
💡 Please respect each other's opinions and express agreement or disagreement politely.
📌 Gold Analyze (XAUUSD), 1-hour time frame.
🛑 Always set a Stop Loss(SL) for every position you open.
✅ This is just my idea; I’d love to see your thoughts too!
🔥 If you find it helpful, please BOOST this post and share it with your friends.
Gold Bulls Smash Through the Flag PatternGold has climbed sharply, and after that sudden burst of momentum, the market naturally shifted into a cooling phase, forming a descending flag.
This pullback does not reflect weakness; instead, it represents a controlled pause as the market resets after a strong advance.
Sellers are attempting to push prices lower, yet the decline remains shallow. That limited retracement reveals that buyers are still firmly positioned and ready to defend the trend at every dip.
At this stage, price is breaking out of the flag with clear conviction, signaling that bullish strength is returning to the market. The breakout candle, supported by increasing volume, highlights strong market intent and renewed confidence from buyers.
With momentum building again, the next impulsive move is likely to extend toward the 4,300 target.

Gold 1H – Will 4242 Displace or 4170 Unlock the Next Leg?🟡 XAUUSD – Intraday Smart Money Plan | by Ryan_TitanTrader (04/12)
📈 Market Context
Gold squeezes into engineered liquidity as Donald Trump signals policy authorization for ultra-compact car production in the U.S., adding risk-on volatility to USD narratives. Markets may front-run sentiment shifts into commodities like gold. Expect fast bilateral sweeps before institutions reveal intent.
On H1, structure toggles between premium supply at 4242–4244 and discount demand at 4170–4168. The next directional leg requires MSS + BOS + displacement confluence.
🔎 Technical Framework – Smart Money Structure (1H)
Current Phase = liquidity-rich compression at H1 extremes
Liquidity Zones & Key Triggers
• 🔴 SELL GOLD 4242 – 4244 | SL 4252
• 🟢 BUY GOLD 4170 – 4168 | SL 4160
Bias invalidation only via structure break + displacement validation.
Expected Sequence = Sweep → MSS/CHoCH → BOS → Displacement → Retest → Expansion
🎯 Execution Rules (unchanged methodology, matching your zones)
🔴 SELL GOLD 4242 – 4244 | SL 4252
Rules:
✔ Zone tap 4243 → bearish MSS/CHoCH (M5–M15)
✔ Clean bearish BOS down + candle displacement
✔ Entry on FVG fill or OB retest after displacement
Targets:
1. 4200 – 4190
2. 4182 – 4176
3. 4170 – 4168
🟢 BUY GOLD 4170 – 4168 | SL 4160
Rules:
✔ Sweep under 4169 → bullish MSS/CHoCH + BOS up
✔ Displacement candle away from discount
✔ Wick rejection into FVG fill / OB retest confirm
Targets:
1. 4186
2. 4210
3. 4242+
⚠️ Risk Notes
• Both sweeps = traps until BOS + Displacement confirms intent
• No averaging inside compression
• SL = structural invalidation only
• Reduce size during headline-driven spikes
📍 Summary
Two institutional paths today:
• 4243 sweep → bearish MSS/BOS → retest → delivery into 4170
or
• 4169 sweep → bullish MSS/BOS → retest → expansion into 4242+
Trade the structure. Let price narrate the intent. Patience = edge. 🚀
📌 Follow @Ryan_TitanTrader for daily Smart Money breakdowns.
