Gold: Watch 4228 as the Short-Term Pivot, Focus on Buying DipsUnder the influence of the FOMC’s 25bp rate cut yesterday, gold surged toward the 4248 area with significant volatility. Now that the rate-cut decision has been finalized, the conditions for trading purely on that expectation have passed; however, its subsequent impact will continue to create opportunities in the market. The series of economic releases before the holidays still deserve close attention. At the same time, developments in the Russia–Ukraine situation should be monitored. If peace negotiations progress smoothly and tensions ease, safe-haven demand for gold will weaken, putting short-term pressure on the bullish side.
Technically, fueled by news, the price broke through resistance near 4228 and tested the 4245-4250 area, but encountered significant selling pressure, returning to the 4207-4200 area. This trend is relatively healthy, but it also indicates that the market remains cautious.
Continue to focus on the 4223-28 area. If it can stabilize at this level, it means that the selling pressure has been largely released. With increased capital participation, there may be an opportunity to test the 4300 area before the holiday. If it cannot stabilize, and the Russia-Ukraine peace talks proceed smoothly, the bears may push the price down to around 4100 or even 4050.
Additionally, there is some data to watch in 7 hours.
Trade ideas

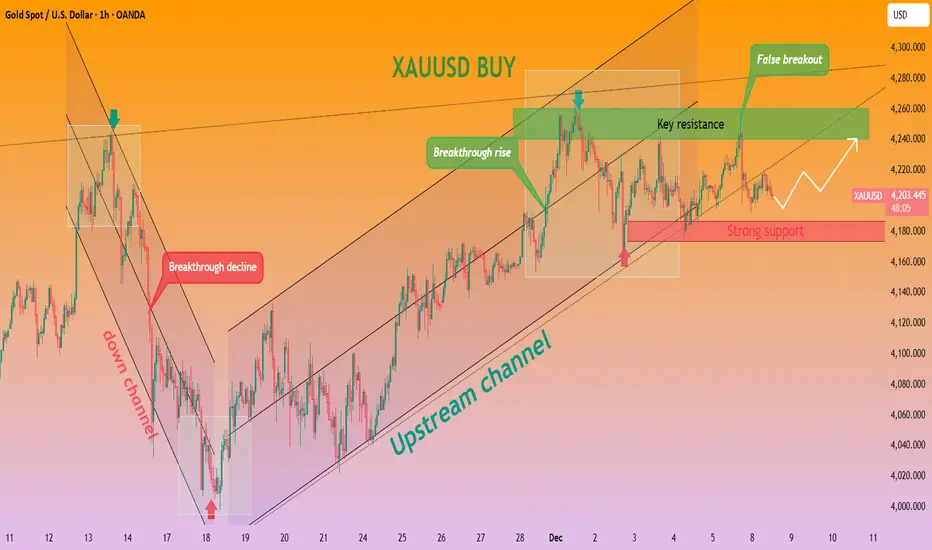
Dec 11, 2025 - XAUUSD GOLD Analysis and Potential Opportunity📊 Summary:
The combination of rate cuts and renewed bond-buying is strongly bullish for gold.
The primary plan remains buying pullbacks into support, as long as key support zones hold.
However, in an extreme scenario where price breaks 4170, and especially 4164, it would invalidate today’s bullish bias and require a full reassessment.
For today, the two most important supports to watch are 4220 and 4207:
• A break below 4220 may trigger a short-term pullback.
• Above these levels, the bullish trend remains intact, and I continue to favor long setups.
🔍 Key Levels to Watch:
• 4255 – Resistance
• 4250 – Resistance
• 4245 – Resistance
• 4239 – Resistance
• 4230 – Resistance
• 4220 – Key intraday support
• 4207 – Key support
• 4198–4200 – Support zone
• 4189 – Support
• 4182 – Support
📈 Asia Session Intraday Strategy:
SELL: If price breaks below 4220 → target 4216, with further downside toward 4211, 4207, 4205
BUY: If price holds above 4230 → target 4232, with further upside toward 4235, 4239, 4245

XAU/USD (Gold) – Market Structure & Liquidity OutlookGold is currently trading in a well-defined consolidation range within my marked blue zone, showing signs of balance after the impulsive move into this area. Price action over the recent sessions indicates compression, with multiple equal highs and lows forming — a classic sign that liquidity is building.
Key Levels
• Current Price Area: ~4,228
• Range High / Liquidity Pool: 4,255 – 4,265
• Range Low / Support: 4,195 – 4,205
• Higher Timeframe Demand (H4 Zone): 4,155 – 4,165
• Invalidation / Stop Loss: Below 4,175
Trade Bias
My bias remains bullish as long as price holds above the H4 demand zone.
The market has respected the blue range multiple times without a clean breakdown, suggesting stronger hands are accumulating positioning below resistance. I’m expecting price to first sweep the resting buy-side liquidity resting above the recent highs around 4,255–4,265, followed by a decisive break and acceptance above the blue zone.
A strong close above 4,265 would confirm a breakout from consolidation and open the door for continuation toward higher highs.
Execution Plan
• Entry Zone: Within the blue consolidation range on confirmation
• Target 1 (Liquidity Sweep): 4,260
• Target 2 (Continuation): New highs above 4,270
• Stop Loss: Below 4,175 (protecting against a deeper H4 demand sweep)
Risk Thesis
A sustained break and close below 4,175 would invalidate the bullish structure and suggest a deeper retracement into the H4 demand zone near 4,160.

XAUUSDDO YOU KNOW WHATS BEHIND THIS OR OTHER IDEAS?? in bio..
Preferably suitable for scalping and accurate as long as you watch carefully the price action with the drawn areas.
With your likes and comments, you give me enough energy to provide the best analysis on an ongoing basis.
And if you needed any analysis that was not on the page, you can ask me with a comment or a personal message.
Enjoy Trading ;)

XAU / USD 1 Hour ChartHello traders. I did not take the trade,but I just wanted to post that my analysis was spot on for the scalp trade. That is about all I got. Not gloating, just thankful to BIg G. Be well and trade the trend.

The decline of gold is clear.Gold Short Strategy Analysis: Fundamental Weakness + Technical Bearishness, Downside Momentum Building
(I) Fundamental Side: Geopolitical Safe-Haven Failure, Short-Term Supply-Demand Imbalance
Geopolitical support for gold has completely collapsed: Events such as the Japan earthquake and border clashes between Cambodia and Thailand failed to trigger effective safe-haven buying. The market’s sensitivity to geopolitical risks has significantly declined, and coupled with progress in Gaza ceasefire negotiations, the geopolitical risk premium has continued to unwind.
The supply-demand dynamic shows short-term imbalance:
Short-term jewelry demand has dropped 19% year-on-year, leaving investment demand as the dominant driver. However, the withdrawal of speculative capital is weighing on overall demand.
While Russia announced restrictions on gold bar exports starting in 2026, long-term supply tightening expectations are unable to offset near-term selling pressure.
(II) Technical Side: Triple Top Divergence + Resistance Pressure, Bearish Structure Formed
A "triple top divergence" has emerged on the daily chart: Gold prices fluctuate at highs, but the MACD green momentum bars are expanding, the KDJ indicator lines are diverging downward, and the 5-day moving average (MA5) and 10-day moving average (MA10) show signs of a death cross after converging — signaling clear short-term correction pressure.
On the 4-hour chart:
Gold prices pulled back after hitting resistance at $4,207, failing to break the short-term resistance of $4,210. The Bollinger Bands have contracted and tilted downward, matching the "breakdown pattern after weak rebound" technical setup.
Key Levels: Multi-Layered Resistance vs. Fragile Support
Resistance Zones (Reinforced Layer by Layer)
Immediate resistance: $4,210 (intraday rebound high + MA5 suppression);
Strong resistance: $4,218–$4,220 (previous high-volume trading zone), a level tested multiple times without a breakthrough. Yesterday’s rally to $4,218 was followed by a sharp pullback, validating its effectiveness;
Critical resistance: $4,230 (upper edge of recent consolidation range).
Support Zones (Breakdown Risks Loom)
Immediate support: $4,190. A break below this level will trigger accelerated declines toward $4,170 and $4,150.
Gold trading strategy
sell:4220-4210
tp:4200-4190-4170
sl:4230

XAU / USD 1 Hour ChartHello traders. My bad for not posting this morning, got sidetracked. We had some JOLTS news today, and tomorrow we have potential rate cuts when the Fed speaks here in the US. Saying that, the one hour chart is marked with my area of interest. Volume is dying down, so for me, I am just watching. Watching to see if we reject or push up a bit more. Patience is key. Big G gets a shout out. Wishing everyone a great day. Tomorrow is the day i will be looking for a potential trade if I can time it. Let's see how things play out. Be well and trade the trend.

GOLD SELL NOW!!!!!!Gold just hit my poi with a rejections am going shorts from this zone holding till price make a big drop to the sell side.....

Premium Rejects. Discount Reacts. GOLD Obeys.TVC:GOLD continues to respect the same liquidity structure I mapped in last week’s analysis.
The 4,240 to 4,250 premium zone rejected perfectly again, triggering a clean redistribution and sending price back toward discount arrays.
My OG Indicators reacted flawlessly:
* 🔻 Sold off directly from the premium Trend Zone
* ⚡ FlowMaster showed exhaustion at the HH sweep
* 🎯 ScalpMaster printed early reversal signals
* 📉 TrendMaster acted as dynamic 1H resistance
The roadmap played out almost point to point.
⏳ 1H Short Term View
Structure still leans bearish while price stays under the premium band.
* 🐼 Bears remain in control below 4,210
* 🎯 Short targets: 4,196 → 4,188 → 4,175
* ❌ Invalidation: reclaim of 4,225 to 4,230
Discount arrays near 4,180 are attracting buyers, but we still need clean confirmation for a stronger bounce.
📆 1D Mid Term View
Macro structure stays bullish as long as the 4,100 to 4,020 demand zone holds.
This zone continues to absorb sell-side liquidity and maintain the upward structure.
* 🟢 Bulls remain in control above 4,100
* 🎯 Mid term targets: 4,265 → 4,300 → 4,335
* ⚠️ Breakdown zone: 4,100 → 4,020
Momentum cooled off, but the higher timeframe trend is still intact.
📌 Summary
Short term weakness continues, mid term support remains solid.
Premium zones keep giving clean sells, discount zones keep giving clean reactions, exactly how the OG Zones and Indicators mapped it.
The market is rotating smoothly inside the levels and offering controlled, high probability setups.

Golden Reversal from FVG Zone [XAU/USD]OANDA:XAUUSD Golden Reversal from FVG Zone
Signal: BUY
Entry: 4189.00
TP1: 4203.70
TP2: 4218.10
TP3: 4229.00
SL: 4178.00
Insights:
Price retraced into the 0.618–0.705 Fibonacci zone, overlapping with a Fair Value Gap and high VRVP node—strong confluence for reversal.
RSI is recovering from oversold (44.90), MACD histogram shows bullish divergence with signal line crossing up.
Market structure shows BOS to the upside, suggesting a shift from distribution to accumulation.
#FVGReversal #GoldScalp #HunterSetup#LiquiditySweep #SmartMoneyEntry #BreakoutMomentum
🌟 Trade Like Hunter
✅ High-Probability Setup: Confluence across VRVP (high volume node), MA support, RSI bounce, and MACD crossover.📊 Risk-Reward Ratio: Approx. 1:2.5 to TP3🔑 Liquidity Zone Confirmation: Entry aligns with imbalance zone and prior demand sweep🧠 Market Psychology: Traders likely shifting sentiment toward bullish continuation post-structure break⚡ Probability Score: 80% High Probability📈 Scalability: Setup aligns with H1 and H4 structure—ideal for intraday and swing scalpers🔒 Risk Disclaimer: Always use proper lot sizing and SL discipline. Market conditions can change rapidly.

Multi-indicator Resonance Bullish ViewGold Technical Strategy: Bullish Structure Intact, High-Cost-Effective Long Opportunities Available
On the daily chart, gold trades within an ascending channel with short-term moving averages in a bullish alignment. The 20-day moving average converges with the ascending trend line to form resonant support, reinforcing the upward bias.
The 4-hour chart reveals a triangular consolidation pattern around the $4,200 level — a classic continuation signal of an uptrend, indicating accumulation of bullish momentum before the next move.
Clear Key Levels
Resistance Zones:
Short-term resistance: $4,230–$4,240 (upper edge of the triangle + previous high-volume trading zone).
Support Zones:
Immediate support: $4,180 (lower edge of the triangle + 5-day moving average).
Strong support: $4,170 (previous stabilization level, with solid buying interest).
Indicator Signals Confirm Bullish Bias
MACD: Remains above the zero line; although momentum has slightly contracted, there are no signs of a trend reversal, indicating sustained bullish dominance.
RSI: Trades in the neutral range, suggesting limited room for pullback and balanced market sentiment.
Current price levels offer favorable risk-reward for long positions, with clear support levels to limit downside and a consolidation pattern signaling potential upside momentum.
Gold trading strategy
buy:4190-4200
tp:4210-4220-4240
sl:4180
XAUUSD: Bulls Profited Friday — Sell the Rebound TodayLast week, gold moved largely within a choppy range. Early in the week, price surged to 4264 but failed to break higher and pulled back. Mid-week, gold traded in a narrow band around 4220, and on Friday it spiked to 4259 before rapidly reversing downward, closing at 4196—losing the key 4200 level directly.
The supportive factors for gold remain intact: the market is pricing in nearly a 90% chance of a Fed rate cut in December, and easing expectations tend to suppress real interest rates. In addition, geopolitical risks in the Middle East and the Russia-Ukraine conflict, along with strong global central-bank gold purchases, continue to provide support. However, stronger-than-expected U.S. non-farm payrolls pushed the dollar higher, weighing on gold. Friday’s spike-and-fade also showed profit-taking from the bulls, suggesting short-term downside tests of support may continue.
Before Thursday’s data release, gold may continue its choppy consolidation. Upside momentum will only be renewed if price breaks above 4260; a successful breakout could open the path toward 4300 and potentially 4350. Early in the week, price is likely to remain within a range. Key levels:
Near-term strength/weakness zone: around 4210
Minor resistance: 4225–4230
Higher resistance: 4245 and 4265
Supports: 4190, 4175, and 4160
At the moment, gold continues to dip and bounce repeatedly. Bullish momentum is still insufficient for a breakout, and without major catalysts, price is likely to remain range-bound. The market is waiting for Wednesday’s Fed rate decision, which will guide the next directional move. In the first half of the week, expect continued sideways action—ideal for short-term “sell high, buy low” trading. Trend trading favors selling rallies for now, with both high-sell and low-buy opportunities available.
Last Friday’s long setup based on the PCE data played out perfectly, and the post-pullback short-term long position also delivered profits.
Today’s trading plan:
Go long if price stabilizes above 4215; watch resistance at 4230. If it fails to break, consider selling.
Watch support near 4190; if it holds, look for buying opportunities.

XAUUSD SHORT Hello
My prediction of Spot Gold
Midterm is short to 3880 us dollar
Long term is long up 4500 us dollar
Today is possible key price 4150 us dollar

XAUUSD 4h
Gold has broken the dynamic resistance line and is currently holding above it. We can see an important resistance at the 78% Fibonacci level, which the price has touched twice after breaking the dynamic resistance. Previously, the market also reacted to this same area during an earlier attempt to break the dynamic structure.
We would be waiting to see a strong candle break the blue resistance area and hold above it. then we can expect price to see the previous top area which was around 4380.
Stay tuned for our next updates.

XAUUSD Facing Resistance Near Key Supply ZoneGold has moved into a previously active price area where selling pressure has appeared in the past. Recent candles show hesitation after the upward move, suggesting possible exhaustion around this level.
If the market fails to stay above the mid-range area, a retracement toward the lower support zone may develop. A firm hold and clear acceptance above resistance would shift focus back toward the upper range.

Gold Analysis & Trading Strategy | December 5–6✅ 4H Chart Trend Analysis
1️⃣ Strong spike then rapid reversal – forming a false breakout
A long upper shadow above 4259 indicates overheated bullish sentiment followed by aggressive selling → bullish momentum exhausted
2️⃣ Moving averages turning bearish
Price has fallen back below MA5 & MA10
➡️ Uptrend correction confirmed → short-term rebound ended
3️⃣ Price loses the Bollinger mid-band
Trading below the middle band shifts the structure into a weak consolidation zone
📌 As long as price fails to reclaim 4241–4245,
the mid-term outlook remains corrective, not bullish.
📊 1H Chart Trend Analysis
1️⃣ Sharp drop from highs with consecutive bearish candles
All previous bullish signals fully invalidated → bear trend established
2️⃣ Short-term MAs in bearish alignment
Price remains below MA5 / MA10 / MA20
➡️ Any bounce = sell opportunity
3️⃣ Lower Bollinger Band opening downward
→ Downward momentum still extending
🔴 Resistance Levels
4218–4222 (short-term rejection zone)
4235–4241 (major resistance — primary short entry zone)
🟢 Support Levels
4198–4202 (first support)
4185–4180 (break = accelerated downside)
4165–4163 (next key downside target)
🎯 Trading Strategy Reference
🔰 Main Strategy: Sell the Rebound (trend-following)
📍Entry Zone: 4218–4222
🎯Targets: 4205 / 4192 / 4185
⛔Stop-loss: Above 4230
🔰 Secondary Strategy: Breakout Short Entry
📍If price breaks 4198 with volume
🎯Targets: 4185 → 4165
⛔Stop-loss: Above 4208
⚠️ Not recommended to bottom-buy blindly
Any long trades must wait for a clear reversal signal.
📌 Trend Summary
Price fails to recover above 4235 Bearish bias remains — sell rallies
Price breaks below 4198 with volume Downside opens toward 4185–4163
Price reclaims 4241–4245 Trend may shift into stronger recovery
📌Current phase: Bull trap confirmed → corrective downtrend in progress

GOLD End-of-Week Trend Exhaustion on XAUUSD My AnalysisXAUUSD (Gold) has been bearish all week, and as we head toward the end of the week, we need to stay cautious. 📉⚠️ When the weekly trend is already pushing lower, institutional traders often start winding out of their short positions. This can cause unexpected pullbacks or even full retracements. And remember — trends don’t move in one direction forever. They weaken, especially toward the end of the week. 😮💨
So the real question becomes: do you really want to trade with the trend right as it’s hitting potential exhaustion?
Looking at the chart, Gold has traded lower and broken through a key level. When we check the volume profile, the Point of Control (POC) is sitting right above current price — and that level is stacked with previous order flow. 🧱📊 That makes it a strong resistance area, and for me personally, it’s not an area I’d want to be buying into.
Because today is Thursday, a sell setup could still be valid if we see price pull back and then break structure to the downside again. But as mentioned earlier, be careful — late in the week we often see profit-taking, which can push price back up before the weekly close. 🕒🔄
Trade smart and manage risk.
Not financial advice.

XAUUSD | Gold Signal |Dec 11,2025Trend Analysis: The price of XAUUSD is currently facing a downtrend, with a clear bearish structure visible on the chart. The trend is supported by the price moving below several key EMAs (34, 89, and 200), which signal a potential continuation of the downtrend. The 200 EMA appears to be the strongest resistance.
Price Action & Volume Profile:
The price is testing the lower range, particularly around 4,198.685, a significant support zone. The market structure suggests that the price may bounce upward, especially if it manages to hold above this support level.
The volume profile shows a higher concentration of activity at around the 4,211.906 level, which is likely to act as a strong resistance. If the price approaches this zone, watch for a possible reversal or continuation, depending on how volume behaves there.
Key Levels:
Support: The critical support area lies around 4,198.685, as indicated by the horizontal blue line. If this level holds, there could be a potential reversal.
Resistance: The price is currently facing resistance around 4,214.210. The volume profile suggests that this area could present a barrier for upward movement.
Indicators:
The EMAs (34, 89, 200) are all aligned in a bearish manner, with the price being below the EMAs. This suggests that the bearish trend is likely to continue, but any reversal will depend on how the price interacts with these key levels.
The market seems to be forming a triangular consolidation pattern, indicating potential indecision. A breakout from this pattern will be key to determining the next major move.
Overall Sentiment: Bearish bias is prevailing, but the price is at a crucial support zone. A breakout above the resistance at 4,211.906 may lead to a short-term bullish retracement. Watch for price action at the support and resistance levels to gain more insight into the next move.

XAU/USD BEARISH SETUP ON 4H CHART PATTERN ..The market is respecting a strong downtrend, with price continuously rejecting the descending trendline. After another rejection at the major resistance level, sellers pushed price back below the Ichimoku cloud, confirming bearish momentum.
Two downside zones are highlighted:
Target 1: First support area where price may pause or react
Target 2: Deeper support level aligned with previous structure and volume gaps
As long as price stays below the resistance zone and inside the bearish channel, the momentum favors continuation toward these targets.

Gold – Potential Choppy Price Action AheadThe market got what it wanted from the Federal Reserve last night when a widely anticipated interest rate cut of 25bps (0.25%) was announced, a move which as a rule is positive for Gold prices as it is an asset that doesn’t bear any interest itself. Initially this was the case, with the popular metal trading from opening levels at 4210 before the Fed decision on Wednesday up to a one week high of 4248 early this morning. However, that is where the positive story ended and Gold prices have since traded back down to 4210 again at the time of writing (0700 GMT).
On a longer-term basis, the drivers underpinning prices still seem to remain in place, namely central bank buying dips, concerns over swelling government debt and an uncertain geopolitical outlook, but in the short-term Gold prices could be at the mercy of general risk sentiment, which is wavering after a disappointing Q3 earnings release from Oracle overnight, and positioning readjustment. This situation isn’t helped by the reality that there is little in the way of scheduled risk events for traders to focus on until the release of US Non-farm Payrolls next Tuesday, December 16th (1330 GMT) and the interest rate decisions from the Bank of England, European Central Bank (December 18th) and Bank of Japan (December 19th).
This backdrop could suggest potential for some choppy price action ahead which may require traders to keep monitoring important support and resistance levels that could impact the direction of Gold moving forward.
Gold Technical Update: Watching the 4245/4265 Resistance Band
Since posting the 4381 October 20th high and 3887 October 28th low, Gold has entered a more balanced phase of sideways trading between these extremes. The over‑extended upside price conditions seen after the recent sharp acceleration higher are currently being unwound by this activity.
This current balance between buyers and sellers is evident in the chart below, but it also highlights that no successful closing breakout has yet materialised in price.
Gold’s initial response to the Fed interest rate cut and subsequent press conference yesterday was more positive, with fresh price strength emerging. However, there is still no evidence of a successful breakout to the topside on a closing basis.
As such, maintaining an awareness of both key support and resistance levels could be important in gauging whether the recent sideways trading range is nearing an end.
Possible Resistance Levels:
As the chart below highlights, there is a combination of potential resistance levels situated just above current price activity. This zone reflects both the downtrend line connecting price highs back to October 20th, which sits at 4245 and the December 1st high at 4265. Having previously marked areas where selling pressure has emerged, traders may now be focused on how this resistance band is defended on a closing basis.
Closing breaks above 4245/4265 could lead to a fresh phase of price strength, marking an upside break in Gold from its sideways activity. While not a guarantee of sustained gains, such a move could open potential to challenge the 4381 October 20th extreme and possibly extend further if that level also gives way on a closing basis.
Potential Support Levels:
For now, the 4245/4265 resistance band remains intact. While this area continues to cap attempts at price strength on a closing basis, risks may shift toward the downside, bringing the Bollinger mid‑average at 4155 into play as a potential support level to monitor.
Closing breaks below this support at 4155, if seen, could suggest scope for continued declines toward 3998, the November 18th low. If this level also gave way, it may open the path toward 3887, the October 28th downside extreme.
The material provided here has not been prepared accordance with legal requirements designed to promote the independence of investment research and as such is considered to be a marketing communication. Whilst it is not subject to any prohibition on dealing ahead of the dissemination of investment research, we will not seek to take any advantage before providing it to our clients.
Pepperstone doesn’t represent that the material provided here is accurate, current or complete, and therefore shouldn’t be relied upon as such. The information, whether from a third party or not, isn’t to be considered as a recommendation; or an offer to buy or sell; or the solicitation of an offer to buy or sell any security, financial product or instrument; or to participate in any particular trading strategy. It does not take into account readers’ financial situation or investment objectives. We advise any readers of this content to seek their own advice. Without the approval of Pepperstone, reproduction or redistribution of this information isn’t permitted.

Could we see a bounce from here?Gold (XAU/USD) is falling towards the pivot and could bounce to he 1st resistance which acts as a multi swing high resistance.
Pivot: 4,200.44
1st Support: 4,167.93
1st Resistance: 4241.96
Disclaimer:
The opinions given above constitute general market commentary and do not constitute the opinion or advice of IC Markets or any form of personal or investment advice.
Any opinions, news, research, analyses, prices, other information, or links to third-party sites contained on this website are provided on an "as-is" basis, are intended to be informative only, and are not advice, a recommendation, research, a record of our trading prices, an offer of, or solicitation for, a transaction in any financial instrument and thus should not be treated as such. The information provided does not involve any specific investment objectives, financial situation, or needs of any specific person who may receive it. Please be aware that past performance is not a reliable indicator of future performance and/or results. Past performance or forward-looking scenarios based upon the reasonable beliefs of the third-party provider are not a guarantee of future performance. Actual results may differ materially from those anticipated in forward-looking or past performance statements. IC Markets makes no representation or warranty and assumes no liability as to the accuracy or completeness of the information provided, nor any loss arising from any investment based on a recommendation, forecast, or any information supplied by any third party

XAUUSD Delivered Excellent [ 610 PIPS] PROFITsAs I discussed throughout my TODAY'S Commentary
What was my stance & Postions:
I took buy in my early trade from at London session also shared my Setup and target was 4215 which XAUUSD delivered
Second hiting my first Target i have waited for Gold to deliver decent pullback and respect the previous BOS at $4200 - $4195 Belt I found such on $4194-4195 bos test. I have engaged big Lot set of Buying orders again along (#4185 Stop loss ) and closed my orders on $4220 .
I want to take this moment to congratulate the traders who followed my calls and patiently held their orders. Great job — enjoy the profits and have a great weekend.
Massive win of Day

XAUUSDDO YOU KNOW WHATS BEHIND THIS OR OTHER IDEAS?? in bio..
Preferably suitable for scalping and accurate as long as you watch carefully the price action with the drawn areas.
With your likes and comments, you give me enough energy to provide the best analysis on an ongoing basis.
And if you needed any analysis that was not on the page, you can ask me with a comment or a personal message.
Enjoy Trading ;)
