XAUUSD 15M — Trend Continuation SetupOANDA:XAUUSD
The current move suggests continuation as long as price stays above the rising trendline. A pullback into the highlighted support area may act as the next bullish re-entry before continuation toward upper liquidity levels.
Key Scenarios
✅ Bullish Case 🚀
If price retests the 4205–4213 support area and shows bullish confirmation:
🎯 Target 1: 4235
🎯 Target 2: 4255
🎯 Extended Target (Liquidity Grab Zone): 4275–4285
❌ Bearish Case 📉
Break below 4193 may invalidate the bullish structure and shift momentum back toward deeper support.
Current Levels to Watch
Support 🟢: 4193–4213
Breakout Confirmation ⚡: Above 4230
Liquidity Target 🎯: 4275–4285
⚠️ Disclaimer: This analysis is for educational purposes only — not financial advice.
Trade ideas

GOLD IS OVERBOUGHT|SHORT|
✅XAUUSD After sweeping liquidity above the supply zone, price is about to retest the rejection point in a premium area. A draw on liquidity toward the next inefficiency is favored as the market seeks a balanced repricing leg. Time Frame: 3H.
SHORT🔥
✅Like and subscribe to never miss a new idea!✅

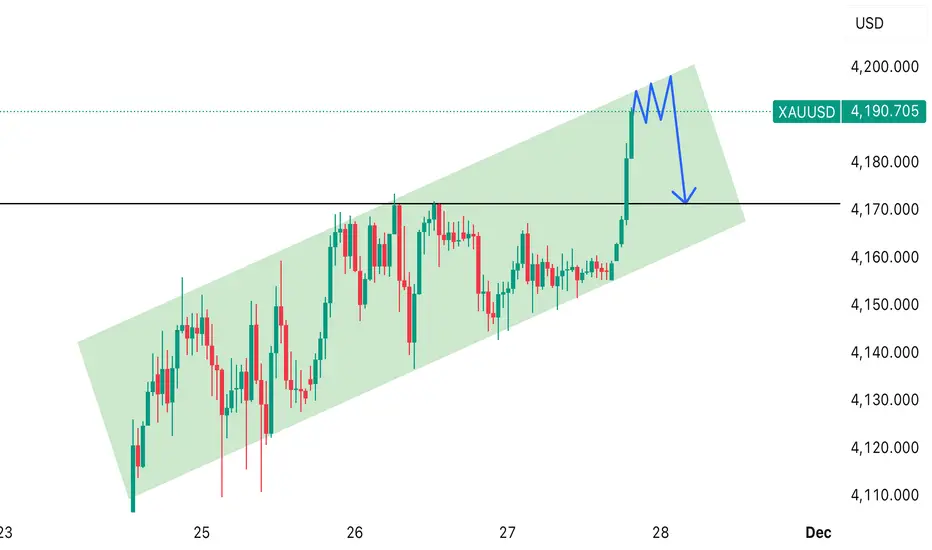
Gold is at the top of the channel and showing rejection, indicatGold (XAUUSD) is moving inside an upward channel. The price has reached the top of the channel and is showing rejection. The blue M-pattern suggests a possible pullback downward, targeting around the 4,170 zone
The odds of making a profit by going long on gold are high.Three Core Bullish Logics: Consolidating the Foundation for Upside
(I) Policy Dividends: Strengthened Rate-Cut Expectations, High Certainty of Easing
Dovish signals from the Federal Reserve continue to emerge, with core officials including New York Fed President John Williams hinting at a policy shift toward easing. Market expectations for a 25-basis-point rate cut in December have become the mainstream consensus. Weak U.S. employment data further confirms the economic cooling trend, providing fundamental support for accommodative policies.
Historical data shows that during phases dominated by rate-cut expectations, gold’s allocation value as a non-interest-bearing asset stands out—with a short-term upside probability exceeding 70%. Policy dividends offer strong support for gold prices.
(II) Capital Flows: Central Bank + Institutional Resonance, Solid Bottom Support
The global central bank gold-buying spree remains unabated: global central banks recorded a net gold purchase of 220 tons in Q3 2025, a quarter-on-quarter increase of 28%. Central banks including China and Poland have continued to increase holdings, and the $4,170–$4,200 range is near the official purchase cost zone, forming a rigid bottom.
Meanwhile, long-term allocation capital has firmly entered the market: global gold ETF holdings surged by 222 tons in the first three quarters, and demand for gold bars and coins has exceeded 300 tons for four consecutive quarters. Institutional capital underpinning limits the room for pullbacks.
(III) Technical Support: Stabilization at Key Ranges, Intact Bullish Structure
On the daily chart, gold prices remain near the 5-day moving average. The $4,170–$4,180 range forms strong support, coinciding with the Bollinger Bands’ lower track and the previous consolidation platform. Multiple tests of this level have failed to break it, verifying the resilience of buying interest.
The 4-hour chart shows that the stochastic indicator has formed a golden cross and is moving upward, while the MACD maintains a bullish structure. Despite short-term volatility, the bullish trend remains intact. The short-term core support is focused on $4,180, with the key resistance level at $4,245—pullbacks within the oscillatory range present buying-on-dip opportunities.
Gold trading strategy
buy:4180-4190
tp:4200-4210-4240
sl:4170

GOLD End-of-Week Trend Exhaustion on XAUUSD My AnalysisXAUUSD (Gold) has been bearish all week, and as we head toward the end of the week, we need to stay cautious. 📉⚠️ When the weekly trend is already pushing lower, institutional traders often start winding out of their short positions. This can cause unexpected pullbacks or even full retracements. And remember — trends don’t move in one direction forever. They weaken, especially toward the end of the week. 😮💨
So the real question becomes: do you really want to trade with the trend right as it’s hitting potential exhaustion?
Looking at the chart, Gold has traded lower and broken through a key level. When we check the volume profile, the Point of Control (POC) is sitting right above current price — and that level is stacked with previous order flow. 🧱📊 That makes it a strong resistance area, and for me personally, it’s not an area I’d want to be buying into.
Because today is Thursday, a sell setup could still be valid if we see price pull back and then break structure to the downside again. But as mentioned earlier, be careful — late in the week we often see profit-taking, which can push price back up before the weekly close. 🕒🔄
Trade smart and manage risk.
Not financial advice.

Dec 4, 2025 - XAUUSD GOLD Analysis and Potential Opportunity📊 Summary:
Bullish momentum has weakened, but bearish momentum has not fully taken over — the market remains in a range-bound, choppy environment.
If price breaks below 4195, bearish momentum strengthens → bias shifts to selling rallies into resistance.
If price reclaims 4245, bullish momentum returns → bias shifts to buying pullbacks into support.
Between 4195–4245, structure is messy and levels are mixed. Trade cautiously, use strict stops, and focus on selling high/buying low until a clear breakout occurs.
🔍 Key Levels to Watch:
• 4265 – Resistance
• 4257 – Resistance
• 4245 – Key resistance
• 4230 – Resistance
• 4216 – Resistance
• 4206 – Support
• 4200 – Round-number level
• 4195 – Intraday key support
• 4182 – Support
• 4174 – Support
📈 Asia Session Intraday Strategy:
SELL: If price breaks below 4203 → target 4200, with further downside toward 4195, 4189, 4182
BUY: If price holds above 4216 → target 4220, with further upside toward 4225, 4230, 4235

GOLD DAILY Gold (XAU/USD) – Technical Analysis (Daily Chart)
1. Main Trend
Gold has been in a strong bullish uptrend for several months.
The price is trading above the:
50-day MA (green)
100-day MA (red)
200-day MA (blue)
This confirms long-term bullish structure.
However, recently the trend has shifted into sideways consolidation after reaching a peak.
2. Current Market Behavior
Consolidation Range
Price is moving inside a large horizontal range, shown in the big orange box.
Several wicks and choppy structure indicate market indecision.
The consolidation started after hitting the high near 4381–4384.
Repeated Rejection at Resistance
The horizontal resistance zone at ~4380–4390 has rejected price multiple times.
This increases the probability of a bearish correction.
3. Fibonacci Levels
The chart includes various Fibonacci retracement levels:
0.25 (4195)
0.5 (3861)
0.75 (3602)
1.0 (3342)
These levels mark potential support zones where price could retrace during a correction.
4. Bearish Setup
The drawn short position shows a planned move:
Entry: near the top of the consolidation
Stop-loss: above the resistance
Target: near the 0.75 to 1.0 Fibonacci zone (3600–3340)
Risk/Reward
The R/R ratio is 6.64, meaning the expected reward is significantly higher than the risk.
Bearish Projection Path
The drawn red path suggests:
Initial drop from resistance
A small bounce
A strong continuation downward
A deeper correction reaching the lower green support zone
Final reversal upward from major support
This scenario is expected to unfold over 28 bars (40 days).
5. Support Zones
Key support areas are highlighted:
3600 – 3860 → first major support
3340 – 3400 → final deep support (target zone)
The green box shows the projected landing zone for the bearish movement.
6. Momentum Indicator
The histogram at the bottom shows declining bullish momentum.
This often appears before a trend reversal or correction.
7. Summary of Interpretation
Gold reached a major top and has entered consolidation.
Resistance remains very strong at 4380–4390.
A bearish correction is likely, potentially deep.
The chart projects a multi-wave drop over the next 40 days.
Long-term trend stays bullish, but a short-term drop is expected.

Gold Puts *I am in no way a financial advisor and you should always do your own due diligence before placing any trade. Do not trade what you are not comfortable with losing. No trade is guaranteed.
Sell down to 4,000 price area

Gold Eyes Support as Fed Cut Bets Fuel Volatility📊 Market Developments
• Gold is trading around ~4,224 USD/ounce, with strong volatility as U.S. bond yields rise slightly → creating downward pressure on gold.
• Expectations that the Fed may cut interest rates soon help gold maintain underlying buying interest.
• The market is awaiting new U.S. economic data to determine a clearer direction.
📉 Technical Analysis
Key Resistance:
1. 4,240 – 4,250 USD (near resistance – recent reaction high).
2. 4,268 – 4,275 USD (extended resistance – breaking above may open the path toward 4,300).
Key Support:
1. 4,180 – 4,200 USD (near support – strong buy zone for bulls).
2. 4,155 – 4,165 USD (mid-term support – aligns with major EMAs; losing this zone may trigger a drop toward 4,130).
EMA:
• Price is hovering around EMA09 on H1/H4 → short-term trend remains indecisive, no clear bullish or bearish confirmation yet.
Candles / Volume / Momentum:
• Volume leans bearish, momentum slightly declining.
• Waiting for confirmation candles: a bullish reversal at 4,180–4,200 or a strong breakdown below 4,165.
📌 Outlook
Gold may retest support with mild downside, especially if U.S. yields continue rising.
However, weak economic data and stronger expectations of Fed rate cuts could trigger a rebound from support.
➡️ Current trend: Neutral – slightly bearish, waiting for reaction at support.
💡 Suggested Trading Strategy
🔻 SELL XAU/USD: 4,242 – 4,245
🎯 TP: 40 / 80 / 200 pips
❌ SL: ~4,248
🔺 BUY XAU/USD: 4,158 – 4,155
🎯 TP: 40 / 80 / 200 pips
❌ SL: ~4,152

Gold Coiled Tight – 4,200–4,214 Breakout LoadingGold (XAU/USD) – Quick 5M Update Price stuck in a super-tight 4,200–4,214 range after repeated rejections at the top, flat 200MA, volume drying up fast. Classic coil setting up for a violent breakout. Bullish trigger: close above 4,216 → fast move to 4,240+
Bearish trigger: close below 4,200 → drop to 4,180–4,170
Fade the edges or wait for the break. #XAUUSD #Gold #BreakoutImminent #RangeCompression #Trading Not financial advice – trade at your own risk.

Gold Bullish Continuation or Pullback MoveXAU/USD is maintaining a strong bullish structure after recovering from the major demand zone area and pushing through multiple resistance levels. Price action shows a clean transition from accumulation to expansion, supported by an upside channel, indicating consistent buyer control.
After the liquidity sweep below the range, the market formed a rounded base and began creating higher highs along the curve line. Even though the curve line was briefly broken, buyers quickly regained momentum, driving price back into the buyer zone near 4,250. This zone remains a critical decision area; holding above it may trigger a continuation toward the upper supply zone and the immediate bullish target around 4,360.
If price rejects from the buyer zone, a corrective pullback toward 4,180–4,140 is possible before another attempt upward. However, as long as the higher-timeframe demand zone remains protected, the main bias stays bullish. Market structure, channel formation, and prior liquidity sweeps all support the likelihood of further upside continuation.

XAUUSD 15m – Bullish Continuation Toward Final TargetOANDA:XAUUSD
Gold swept liquidity beneath the descending channel, then immediately broke out with strong momentum, confirming a new demand zone at the lows. After reclaiming mid-range structure, price is pushing upward toward the next liquidity bracket at $4,230, where a small corrective pullback is likely before continuation. Market sentiment remains bullish as long as price stays above the newly formed demand zone.
Key Scenarios
✅ Bullish Case 🚀
Maintain support above $4,215 – $4,218
Small correction from liquidity target zone
Continuation to:
🎯 Target 1: $4,230
🎯 Final Target: $4,264 (major liquidity + top resistance zone)
❌ Bearish Case 📉
Only valid if price breaks below $4,181
🎯 Downside Target: $4,164 (previous sweep level)
Current Levels to Watch
Resistance 🔴: $4,230 / $4,264
Support 🟢: $4,215 / $4,181 / $4,164
⚠️ Disclaimer: This analysis is for educational purposes only. It is not financial advice.


XAU longs…Okaaay, got some downside here as mentioned…
$4192 people…
Looks to be en route, and should be monitored.
Low ends for me on 79/80, I’m shoot some. Layered through 192. Target projected for 318 minimum and looking to take ATH as extensions!!!!
I do think she can hold off 68 ?!
Safest play for confirmation would be to see some pricing into 79/80 followed up with closures above 192!!!
Last post. See how we go…
If she can’t make 192 and finds her way on an upside again, I believe it’s dead off 31/35 to fulfil !!!
If not long profile should be valid. Just gotta find how you jump on the wave 🌊
Let’s Gooooo’🫨

XAU/USD Intraday Plan| Pullback in Play Below 4232Gold is pulling back below 4232 after failing to reclaim the 4274 resistance yesterday. Price is currently trading around 4212 and has also closed below the MA50, signalling a slowdown in bullish momentum.
Market structure has turned temporarily bearish, and for buyers to regain control we need a clean break above 4232 to reopen the path toward 4274, and if momentum is strong, 4322 next.
If selling pressure persists, price is likely to retest the First Reaction Zone(4185-4141), which aligns with the MA200 — adding confluence as dynamic support. A clean break below this area would open the door for a deeper pullback into the Support Level (4102-4049) and ultimately the HTF Support Zone(4014-3966), where buyers may look for a stronger bullish reaction.
📌Key levels to watch:
Resistance:
4232
4274
4322
Support:
4185
4141
4102
4049
4014
3966
🔎Fundamental Focus:
No high- or medium-impact data scheduled today, so price may move more on sentiment and headlines. Later in the week we have several important U.S. releases that could drive volatility. Geopolitical developments also remain a factor to watch.

XAUUSD – LANA'S VIEW ON ADJUSTMENT PHASE 02/12 ...XAUUSD – LANA'S VIEW ON ADJUSTMENT PHASE 02/12
1. Quick Update
Today, Lana views gold in the context of a short-term adjustment, mainly wave 4 according to Elliott, after a fairly strong previous increase.
The goal is to take advantage of the technical decline to: Short sell to a lower price range
Then buy back at a beautiful support area according to the main trend
2. Technical Analysis
The Liquidity zone 4250–4260 on the weekly frame is a very strong liquidity area according to Market Profile.
Lana sees this as an area prone to a “fake break”: price pushes up to take liquidity and then adjusts down.
Based on Session data, Lana prioritizes the scenario: Price is rejected around the above area
Forming a decline to the 418x area to complete wave 4 adjustment.
After wave 4 is completed, the medium-term uptrend can still continue.
3. Price Areas to Watch
Strong Liquidity / resistance area:
4250 – 4260
Short sell watch area:
4236 – 4241
Buy back area according to trend:
4180 – 4175
4. Trading Scenarios
⭐️ Scenario 1 – Sell according to adjustment phase
Sell: 4236 – 4241
SL: above 4245
Target: 418x (can gradually close around 4180)
⭐️ Scenario 2 – Buy according to trend after adjustment
Buy: 4180 – 4175
SL: 4170
TP: minimum 20 points (everyone can choose the nearest resistance area to gradually close)
Lana's priority: Do not rush to Buy right at the Liquidity area 4250–4260
Be patient and wait for the price to reach the 4236–4241 area to Sell,
then 4180–4175 to Buy according to the trend.
This is Lana's personal view on the adjustment phase on 02/12, everyone should consider carefully and manage risks before entering a trade. 💛

XAUUSD Trendline Rejection – Bullish Momentum Buildi • Price is currently around 4215.90 in the demand zone.
• The confluence of:
• Trendline support,
• Horizontal demand,
• Multiple rejections (wicks)
suggests buyers may defend this level.
• If the price holds above the trendline, a strong bullish move toward 4240–4250 may occur.
⚠️ Bearish invalidation:
If candles close below the trendline + demand zone, the bullish idea becomes invalid and gold may drop further.no

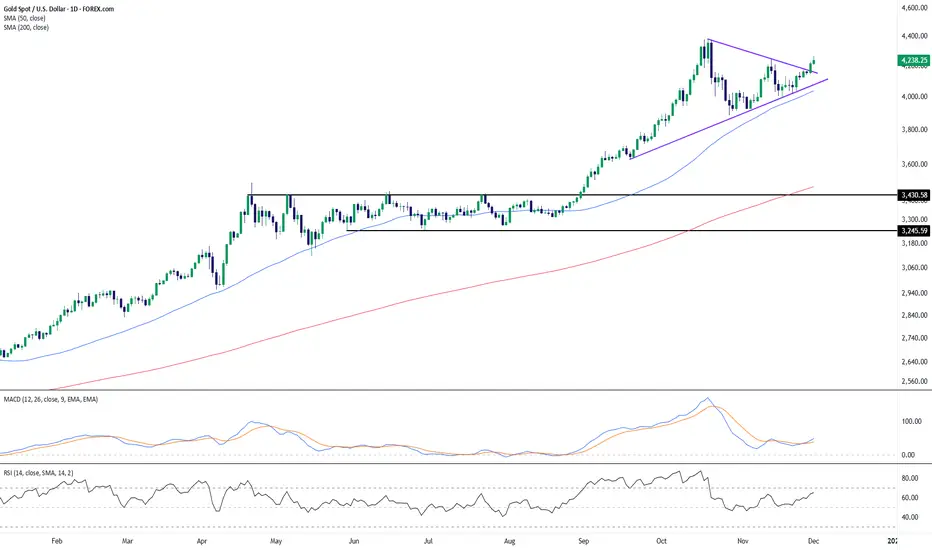
Gold Breaks Out of Triangle Structure as Trend Strength Remains Gold has pushed through the upper boundary of a contracting triangle formation, marking a continuation of the broader uptrend that has been intact since early in the year. The breakout follows several weeks of compression, with progressively higher lows aligning along a rising trendline, while buyers repeatedly tested the upper diagonal boundary.
The moving averages reinforce the constructive bias: price continues to trade well above both the 50-day SMA and the 200-day SMA, with the 50-day maintaining a strong upward slope. This places the current move firmly within a longer-term bullish structure, and the recent expansion in distance from the 50-day SMA highlights renewed upward momentum following the consolidation phase.
Momentum indicators are also showing early signs of improvement. The MACD lines have begun curling higher after a period of easing, suggesting that downside momentum has faded. RSI has climbed back into the mid-60s, reflecting strengthening buying interest without yet indicating overstretched conditions.
Overall, the breakout from the triangle aligns with the prevailing uptrend and indicates a return of bullish pressure. As always, how price behaves on any retest of the breakout area—or near the rising trendline—may provide additional insight into the durability of this momentum shift.
-MW
XAUUSD: Pullbacks are opportunities; remain bullishThe direction I've been aiming for these past two days has been correct, but unfortunately, the limited pullback in gold prices hasn't provided a suitable entry opportunity.
Currently, gold remains in an overall bullish trend. Gold has been consistently hitting new recent highs, indicating continued bullish strength. Pullbacks during the US session present buying opportunities. Now that gold is testing lower levels again, consider buying in the 4220-4230 support zone.
Looking at the 1-hour chart, the moving averages are still in a bullish golden cross and diverging upwards, suggesting further upward momentum and potential for continued gains.
Gold is currently in a bullish trend; pullbacks present buying opportunities. Trade with the trend.
Trading strategy:
Buy gold at 4220-4230
TP1: 4255
TP2: 4280
Set your stop-loss order according to your own situation. Good luck!

GOLDDO YOU KNOW WHATS BEHIND THIS OR OTHER IDEAS?? in bio..
Preferably suitable for scalping and accurate as long as you watch carefully the price action with the drawn areas.
With your likes and comments, you give me enough energy to provide the best analysis on an ongoing basis.
And if you needed any analysis that was not on the page, you can ask me with a comment or a personal message.
Enjoy Trading ;)

Quick sells Monday money *I am in no way a financial advisor and you should always do your own due diligence before placing any trade. Do not trade what you are not comfortable with losing. No trade is guaranteed.

Intraday Buy Below 4220 — Spot On!After gold fell below 4220, it perfectly entered our buying range, and the price subsequently rebounded as expected, bringing us considerable profits again. Currently, you can choose to partially reduce your position to lock in profits, or close all positions to secure gains, depending on your own position size and risk tolerance.
Next, we need to focus on the resistance above 4250. If the price action at this level is unfavorable to the bulls, this will become a new short-term selling opportunity.
However, it's important to note that this is a short-term fluctuation; from a broader perspective, we remain firmly bullish. As I mentioned before, our next target is around 4300.

Gold (XAUUSD) 4H Key Levels & Strategy🔥 Strong Buy Zone: 4385 ➜ Targets 🎯 4500, 5000
❗ If 4385 fails to break → 🔻 Sell toward 4200, 4000
🟢 Buy Zone: Break above 4261 ➜ Targets 🎯 4300, 4350
🟩 Buy Opportunity: Break above 4221 ➜ Targets 🎯 4248, 4260
🔴 Strong Sell: Break below 4180 ➜ Targets 🎯 4150, 4100
⚠️ Major Breakdown Level:
Strong Sell below 4100 ➜ Targets 🎯 4000, 3900
📊 Trend Status:
Market approaching critical resistance zones. Watch for breakout confirmation above 4221 & 4261 for bullish continuation. Rejection can push price back toward 4180 & 4100 levels.
💡 Trading Tip: Always wait for candle close confirmation on 30 M to avoid fakeouts.
🚀 Smart Levels • 📉 Clean Structure • 🔮 Future-Focused Trading
⚠️ NOTICE
This analysis is for educational purposes only. 📚
Not financial advice. 💼
Always do your own research and trade at your own risk. ⚠️
Market conditions can change rapidly — use proper risk management. 🛡️
