XAUUSD | Daily Idea | 1_Dec_20254h is bearish ( Mitigated to POI and takes a huge amount of Liquidity
15m is bullish swing ( there is one clean POI it will only work if there Liquidity build on pullback phase)
15m internal bearish to facilitate 15m swing pullback
Trade ideas

Gold Ready for a Big Move?iew-ready analysis description based on your XAUUSD chart:
📊 XAUUSD – 1H Analysis
Gold is currently testing a major horizontal resistance zone, aligned with a strong ascending trendline that has been guiding price upward for several days. This creates a critical decision point where price can either break out or reject.
🔹 Scenario 1: Bullish Breakout
If price breaks and closes above the resistance zone, we can expect bullish continuation toward the upper target zone around 4,320–4,360.
A retest of the broken level could provide a clean continuation entry.
🔹 Scenario 2: Bearish Rejection
If price fails to break through resistance, a pullback toward the ascending trendline is likely.
A breakdown of that trendline may trigger a deeper correction toward the lower target zone around 4,080–4,120.
📌 Key Levels
Resistance: 4,240–4,255
Bullish Target: 4,320–4,360
Bearish Target: 4,080–4,120
Trendline Support: rising structure from Nov 21
✔️ Bias
Neutral at current level — direction depends on how price reacts to resistance.

ANFIBO XAUUSD – Fibonacci Breakout and Continuation Plan
Hi guys, Anfibo’s here!
XAUUSD Weekly Trading Plan
Overall Picture
On the 4H chart, gold has broken out of the previous descending trendline and is now trending inside a rising bullish channel. Price is pushing toward the upper boundary of this channel, and the next key reaction zone is where:
The new uptrend channel resistance
The old descending trendline (now potential resistance)
And the Fibonacci extension cluster
all line up around the 4240s.
This is where I expect the market to show its hand:
Either give a short-term corrective pullback,
Or consolidate and build energy for a continuation rally toward the higher Fibonacci extensions (2.618 around the 4370–4380 zone).
Macro Context – Why USD Still Matters
From a macro perspective, the U.S. Government and Treasury have a direct impact on the U.S. Dollar Index (DXY) through:
Fiscal policy (budgets, new laws, spending programs)
Announcements from the administration
Treasury funding needs and issuance
At the same time, U.S. GDP data is a core driver of dollar sentiment:
Stronger‐than‐expected GDP → supports DXY → often weighs on gold.
Weaker GDP or slowdown signals → pressures DXY → tends to support gold.
So while the chart is clearly giving us a bullish technical structure, the strength or weakness of upcoming U.S. data will strongly influence whether gold can sustain a breakout beyond these Fibonacci levels or get capped and pull back deeper.
Trading Plan – Using Fibonacci and Structure
For next week, I’m working with one tactical short setup at resistance and one continuation buy setup on the dip.
>>> Scenario #1 – Short-Term SELL at Fibonacci Resistance
If price extends into the confluence zone around 4240+ and shows rejection, I’ll treat it as a counter-trend sell opportunity:
Sell entry: 4241 – 4243
Stop loss: 4248
Take profit levels:4210-4194-4165-4120
Idea: fade the first touch into the Fibonacci + trendline resistance box, targeting a corrective leg back towards mid-channel support and potentially the lower part of the structure around 4120 if sellers step in aggressively.
>>> Scenario #2 – BUY the Continuation from 4194 Support
If the market respects the breakout and only offers a shallow pullback, I’ll look to join the trend from the key support / Fibonacci area:
Buy entry: around 4194
Stop loss: 4185
Take profit levels:
TP1: 4210
TP2: 4235
TP3: higher extension zone toward the 2.618 area (4370+ if momentum continues)
Idea: use 4194 as a continuation buy zone, where broken resistance + Fib support align, aiming to ride the next impulsive leg higher inside the ascending channel.
Key Technical Levels for the Week
Resistance / Sell zone: 4241 – 4243
Intermediate resistance: 4235, then higher at the Fib extension band near 4370–4380
Support / Buy zone: 4194
Deeper supports: 4165 and 4120 (bottom of corrective structure)
As long as price holds above the 4165–4120 block on a closing basis, the medium-term bias remains bullish.
Risk Management
Treat the sell setup as tactical / short-term against higher timeframe bullish structure.
Always wait for clear confirmation (rejection wick, slowdown, or shift in 4H / 1H structure) at 4240s before entering shorts.
Keep Risk:Reward ≥ 1:2 on both scenarios; avoid forcing trades in the middle of the range.
Do not hold opposing positions simultaneously – follow the scenario the market confirms first.
If strong fundamentals (e.g., very strong GDP, hawkish fiscal tone) push DXY sharply higher or lower, be ready to reassess the bias instead of clinging to the plan.
Conclusion
Gold has flipped from a descending structure to a rising channel, and Fibonacci confluences are giving us clear, objective levels to work with next week. Whether price reacts with a short-term pullback from 4240s or respects 4194 as continuation support, we already know:
Where to sell tactically,
Where to buy with the trend,
And how our risk is defined.
LET THE LEVELS GUIDE YOU, TRADE WITH CONFIDENCE, AND STAY DISCIPLINED, GUYS! 💛📈

Gold price analysis November 28XAUUSD – Uptrend Continues
Buyers continue to dominate following positive signals in the previous session, reinforcing the strong uptrend that is forming. The price structure remains above important support zones and especially the newly established short-term trendline – a factor that shows that demand is still very sustainable.
The immediate price target is towards the 4250 area, and if the market continues to maintain momentum, the possibility of extending the uptrend to the ATH area around 4375 is entirely possible.
Priority trading strategy continues to BUY following the trend:
📌 Trading plan
Direct BUY around: 4173
Maintain existing BUY orders according to the old strategy
Watch for BUY at support if there is a strong price reaction in the 4112 - 4090 area
Short-term target: 4250
Extended target: 4375 (ATH)
⚠️ Risk management
The uptrend will face obstacles if the price closes below the important support zone of 4090, then it is necessary to consider preserving profits and re-evaluating the trend.

Gold Analysis & Trading Strategy | December 4–5✅ 4H Chart (H4) Trend Analysis
1️⃣ Pullback from highs continues
Highs are stepping down: 4264 → 4241.55 → 4220
➡️ Bullish momentum is weakening, indicating a bearish consolidation phase.
2️⃣ Bollinger Bands: Bearish bias
Price is trading below the middle band → bears in control
Lower band 4180–4175 tested multiple times → support is being consumed
Upper band is flattening → bulls show no breakout intention
📌 A confirmed breakdown below 4175 will open further downside space
✅ 1H Chart (H1) Trend Analysis
1️⃣ Weak corrective rebound
Price continues dropping from 4241, current bounce is a correction, not a reversal
2️⃣ Bollinger Bands widening downward
Middle band 4202–4212 = first resistance zone
Lower band keeps descending → bearish trend still valid
3️⃣ Candle structure favors sellers
Large bearish candles + small bullish pullbacks
→ bears maintain initiative
🔴 Resistance Levels (Sell Zones)
▪ 4215–4220 (H1 mid-band + MA pressure)
▪ 4231 (structural resistance)
▪ 4250 (H4 major resistance)
🟢 Support Levels (Bull Defense Zones)
▪ 4190–4185 (last short-term bull defense)
▪ 4175 (key support – break = further bearish move)
▪ 4163 (confirmed swing low – break may trigger acceleration)
🎯 Trading Strategy Reference
🔰 Main Strategy: Sell on Rebounds
🟠 Sell Zone 1: 4215–4220
🎯 Targets: 4195 / 4185
⛔ Stop-loss: Above 4228
🟠 Sell Zone 2: 4231-4235 (Strong Resistance Validation)
🎯 Targets: 4185 / 4168
⛔ Stop-loss: Above 4245
🔰 Secondary Strategy: Try Long Only at Key Support (Short-term bounce)
🟢 Buy Zone: 4175–4168
Only if bullish reversal candles appear
🎯 Targets: 4205 / 4215
⛔ Stop-loss: Below 4158
📌 Trend Summary
1️⃣ Lower highs → bears gaining control
2️⃣ Lower band pressing down → support gradually weakening
3️⃣ All rebounds are capped by moving averages → selling rebounds remains dominant
4️⃣ 4202–4210 = short-term directional key zone
5️⃣ Break below 4163 → acceleration toward 4145–4138
6️⃣ Only a strong reclaim above 4230 may restore bullish structure

Gold Trade Set Up Dec 4 2025Price swept PDL and SSL to the left also tapping into 1h and 15m demand zones so i will be targeting higher BSL and PDH for a continuation higher

Gold Support Reaction – Watching for Possible Upside MovePrice is testing support inside the channel. I am watching for a possible bullish reaction as long as this zone holds.
This is not financial advice—only my personal market outlook. Manage risk according to your plan.

Key-Resistance Liquidity Grab → FVG ShortIdea:
Price has reached a key resistance zone — a common place where smart money or institutions may hunt liquidity (stop-losses above resistance before reversing).
There is an unfilled Fair Value Gap (FVG) / imbalance zone drawn below (green “POI / FVG” zone). In price-action trading, these FVGs often act like magnets: after a rapid move, price tends to retrace and “fill” the gap.
The plan: wait for a rejection at resistance (signaling liquidity grab is done), then short — target the FVG/POI zone where the market may come back to fill imbalance.
🎯 Trade Plan (Entry / Exit / Risk-Reward)
Parameter Plan
Entry After a bearish rejection (e.g. long upper-wick candle) near the resistance zone.
Stop-Loss Slightly above the resistance / recent swing high (to avoid being stopped by a false breakout).
Take-Profit (TP) Around / within the FVG / POI zone (green zone on chart) — where imbalance may be filled.
Risk–Reward Aim for at least 1 : 2 — ideally more, depending on how far the FVG is below resistance.
⚠️ What Makes This Setup Valid (and What to Watch)
FVGs mark market inefficiencies / liquidity gaps created by rapid moves, which often get revisited.
A reversal or rejection at a well-defined resistance zone gives signal that the liquidity hunt may be done and a move downward may begin.
But — if price breaks cleanly and strongly above the resistance (with momentum), the short trade becomes invalid.
Also, FVGs don’t always get filled. Entry should ideally wait for a clear rejection or confirmation, not just assume a fill.

GoldXAUUSD
- Completed " 12345 " Impulsive Waves and " ABC " Corrective Waves
- Change of Characteristics
- Break of Structure
- Consolidation Phase as an corrective pattern in Short Time Frame
- Order Block

XAUUSD – Long Bias on the 4H TimeframeXAUUSD continues to show strong bullish momentum on the 4-hour chart, with price action positioning toward the 4,300 level. Recent market liquidity developments, including a reported $13B liquidity injection by the Federal Reserve, have contributed to a softer U.S. dollar, providing additional support for precious metals.
Geopolitical tensions remain elevated, particularly following the recent rejection of a proposed peace agreement in the East, adding to risk-off sentiment and strengthening safe-haven demand for gold.
From a technical perspective, silver has printed new all-time highs, reinforcing bullish sentiment across the metals complex. Gold itself has confirmed a clean breakout and retest, maintaining structure above key support and validating the continuation bias.
Overall, fundamentals and technicals are currently aligned in favor of further upside.

Golden Liquidity Sweep & FVG Reversal [XAU/USD]OANDA:XAUUSD Golden Liquidity Sweep & FVG Reversal
Signal: BUY
Entry: 4,203.560
TP1: 4,236.765
TP2: 4,259.639
TP3: 4,280.000
SL: 4,189.322
Insights:
Price swept liquidity below 4,203.560 (red level) and tapped into the 0.618–0.705 Fibonacci zone, aligning with a Fair Value Gap (FVG) and high-volume node on VRVP.
RSI is rebounding from midline (50), MACD histogram shows bullish momentum building, and price is above the 50-period MA.
Market structure shows BOS to the upside, suggesting bullish continuation after liquidity grab.
#FVGReversal #LiquiditySweep #GoldScalpingSetup#HighRR #SmartMoneyConcepts #BreakoutMomentum
🌟 Trade Like Hunter (for professional edge)
✅ High-Probability Setup: Confluence of FVG, BOS, VRVP support, RSI bounce, and MACD crossover
📊 Risk-Reward Ratio: Approx. 1:2.5 to TP2, 1:4 to TP3
🔑 Liquidity Zone Confirmation: Entry aligns with swept liquidity and imbalance zone
🧠 Market Psychology: Accumulation phase post-sweep, breakout momentum expected
⚡ Probability Score: 80% High Probability
📈 Scalability: Setup aligns across H1 and H4 timeframes for intraday and swing potential
🔒 Risk Disclaimer: Always use proper risk management. Past performance does not guarantee future results.

OUTLOOK XAUUSD 15m Analysis (2nd December 2025)Hello Guys, This is just a trade idea and not a financial advise
BUY/SELL SCENARIOS:
BUYS:
1)Body Candle Close above the 4236.02 level.
2) Retest the 15m Bullish CHOCH at the 4236.02 level.
3) Create a 3/5m Bullish Engulfing Candle to capitalize on BUYS towards the 4264.50 level.
SELLS:
1) Body candle close below the 4219.69 level.
2) Retest the 15m Bearish CHOCH at the 4219.69 level.
3) Create a 3/5m Bearish Engulfing Candle to capitalize on SELLS towards the 4185.50 level.
Trade smart, Trade according to your trading plans always!!

Dec 2, 2025 - XAUUSD GOLD Analysis and Potential Opportunity📊 Summary:
Above 4245, bullish momentum remains strong and the bias is to buy pullbacks into support.
If price breaks below 4220, bearish pressure increases and the bias shifts to selling rallies into resistance.
🔍 Key Levels to Watch:
• 4273–4278 – Resistance zone
• 4258 – Resistance
• 4245 – Resistance
• 4220 – Support
• 4211 – Intraday support
• 4205 – Support
• 4200 – Round-number support
• 4193 – Key support
• 4185 – Support
📈 Asia Session Intraday Strategy:
SELL: If price breaks below 4220 → target 4216, with further downside toward 4211, 4205, 4200
BUY: If price holds above 4221 → target 4227, with further upside toward 4232, 4236, 4240

BUYING GOLD NOW TO 4,256!!!!!Gold made a sharp breakouts off the POC level and run liquidity from the buy side am in on buys holding till price arrives 4,256 area......

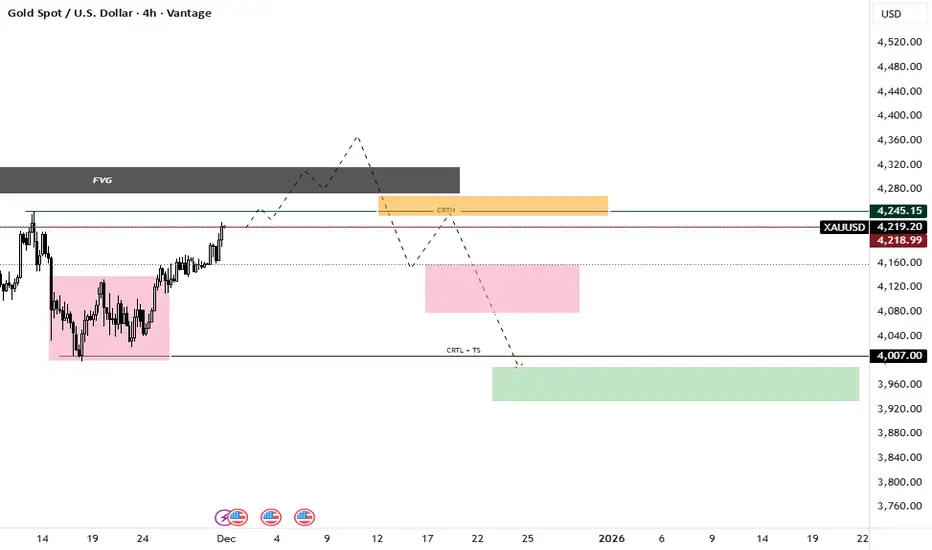
XAUUSD: Decoding the Smart Money Sell Model (MMSM) with CRTThe Narrative: Order in the Chaos Many see this chart as random noise, but through the lens of Candle Range Theory (CRT), we are witnessing a structured institutional narrative. We are currently tracking a classic Market Maker Sell Model (MMSM), where price is engineered to trap retail traders before the true delivery unfolds.
Technical Breakdown:
The Trap (Manipulation Phase): The current price action suggests we are in the manipulation phase. Price is drawing up into the FVG (Fair Value Gap) and the CRTH (Candle Range Theory High). This area acts as a magnet to induce early buyers and purge stops resting above recent highs. This is the "Purge" phase of the CRT cycle.
The Structure (MMSM): As seen in the Smart Money Sell Model, we are looking for the "Smart Money Reversal" (SMR) at these premium levels. We are waiting for price to purge the liquidity at the CRTH, mitigate, and then shift structure to the downside.
The Draw on Liquidity (DOL): Price moves because of liquidity, not just fundamentals. The ultimate target for this setup is the CRTL (Candle Range Theory Low) marked as TS (Turtle Soup). This represents the Sell-Side Liquidity (SSL) that Smart Money intends to harvest during the Expansion phase.
The Execution Plan:
We are not chasing the green candles; we are waiting for the story to complete.
Watch for the Purge: A sweep of the CRTH/FVG area.
Await Confirmation: A "Thick Candle" break or a closure back below Equilibrium (EQ) to confirm the manipulation is over.
Target: The expansion down to the CRTL + TS level.
“The market exists to transfer wealth from the impatient to the patient.”
Disclaimer: This analysis is based on Candle Range Theory and Smart Money Concepts for educational purposes. Always manage your risk.
Greetings,
MrYounity
Long-Term Gold Projection Using the Yearly TimeframeIn my view, gold is setting up for a meaningful correction on the higher timeframes. After an extended bullish run, the structure suggests we could see price retrace deeper and potentially sweep this year’s low near the 2600 region. A liquidity grab below that level would align with a healthy long-term reset before the next major move. While the macro trend remains intact, I expect this corrective phase to play out before gold resumes its broader upward trajectory.

Gold Weekly Review and Outlook: Gold Breaks Through Key ResistanGold Weekly Review and Outlook: Gold Breaks Through Key Resistance, Focus on Next Week's Data Frenzy
Market Review This Week: On Friday, spot gold closed strongly up 1.48% at $4,219.29 per ounce, reaching a high of $4,226.83 per ounce during the session, a near two-week high. It rose 3.80% ($154.39) this week, and 5.42% ($216.81) for November, marking its fourth consecutive month of gains. Spot silver performed even better, surging 5.56% to close at $56.35 per ounce, hitting a new all-time high of $56.519 per ounce during the session, with a weekly gain of 12.72%, its best weekly performance since 2020.
Driven Factors Analysis:
Supply Chain Tightening and Inventory Decline: Tightening physical silver supply and a continued decline in inventory drove prices up rapidly.
Fed Rate Cut Expectations Rise: Market expectations for a December rate cut have surged, and the low-interest-rate environment naturally benefits gold, a non-interest-bearing asset.
Safe-Haven Demand and Structural Demand: Concerns about debt expansion, continued central bank gold purchases, and inflows into the crypto sector are all supporting precious metal prices.
Technical Analysis and Next Week's Outlook
Gold Technical Structure
Daily Chart: Price broke out of the previous consolidation range. The moving average system (MA5-MA20) is in a bullish alignment, the Bollinger Bands are widening upwards, and the MACD golden cross structure is intact, indicating a solid medium-term upward trend. Key support is located at the intersection of the MA20 and the Bollinger Band middle line (4155-4165 area).
Hourly Chart: Price is moving along an upward channel, repeatedly testing the lower edge of the channel before rebounding quickly, showing a clear top-to-bottom reversal pattern. Short-term technical correction is possible, but overall momentum is bullish.
Key Levels Recommended:
Resistance Range: $4245-$4250
Support Range: $4155-$4165
Trading Strategy:
Buy on Dips: Enter long positions in batches around the $4170-$4175 range, with a stop-loss at $4160 and a target of $4200-$4220. A break above this level could lead to $4245.
Sell on Dips: Consider shorting with a small position around the $4240-$4245 range, with a stop-loss at $4253 and a target of $4215-$4195.
Risk Warning: This week is packed with data releases and may trigger high volatility. Strict position control and stop-loss orders are essential to avoid holding losing positions.
Next Week's Focus: Global Data Flood and Policy Signals
Next week (December 2-6) will see the release of several key economic data points, with the most anticipated being the US September PCE Price Index (to be released next Friday). As the Federal Reserve's preferred inflation indicator, its performance will directly impact expectations for the December interest rate meeting. The market expects core PCE to remain flat at 2.9% year-on-year. Better-than-expected data could reinforce the "higher and longer" interest rate stance; lower-than-expected data could trigger expectations of rate cuts.
Other important data includes:
Monday: US/Canada Manufacturing PMI, US ISM Manufacturing PMI
Wednesday: US ADP Employment, Industrial Production, ISM Non-Manufacturing PMI
Friday: Japanese Household Spending, German Industrial Orders, Eurozone GDP, Canadian Employment Report, US Factory Orders, and University of Michigan Consumer Sentiment Index
Macroeconomic Impact: The dense release of data may exacerbate volatility in the foreign exchange and precious metals markets. The direction of the US dollar will be a key indicator of short-term momentum for gold.
Position Recovery Strategies
Handling Deeply Lost Positions:
If your positions are deeply lost (e.g., short positions against the trend), you need to assess whether the trend might reverse. In a clearly trending market, it is recommended to decisively reduce positions or exit the market to avoid long-term capital occupation and risk accumulation. After freeing up funds, you can reposition based on the trend and gradually recover losses through trend-following trading.
Handling Small Losses:
If your losses are relatively small (e.g., just below your stop-loss point), you can use technical analysis to look for rebounds or pullbacks to reduce your position. In volatile markets, range trading can lower your average cost and even turn a loss into a profit.
Correcting Systemic Issues:
If you are repeatedly trapped in losses, it indicates a flaw in your trading system. We recommend improving the following:
Strictly set stop-loss orders and avoid holding onto losing positions;
Strengthen your ability to analyze both fundamental and technical factors;
Control your position size and avoid excessive leverage.
If you are unable to handle the situation yourself, please visit our homepage for further discussion.
Summary: Gold broke through the key resistance level of $4200, and silver reached a new all-time high, indicating that the precious metals market may have ended its consolidation and resumed its upward trend. Next week is packed with data, especially the PCE inflation data, which will be a crucial variable in determining the Fed's policy expectations and the direction of the US dollar. Trading should focus on trend-following long positions, with strict risk control, and seizing structural opportunities.

Gold Trade Plan 28/11/2025Dear traders,
“Considering the holidays on the Forex calendar, I don’t expect heavy volatility from gold. The 4135–4200 zone will be gold’s range area.”
Regards,
Alireza!

Long-term analysis of goldAfter a strong rally, gold is now in a corrective move in the direction of the trend, which itself is a continuation signal. We can see that the price is moving along a trendline and has reacted to this support twice before. There is a good chance it will react to this trendline again, and that in itself counts as a solid trigger. If the price reaches the trendline, we should also be careful about a breakout or a fake breakout of that support.
This is a long-term analysis and may take about one week to ten days to play out, but it gives us a clear outlook on how to open positions on the lower timeframes.


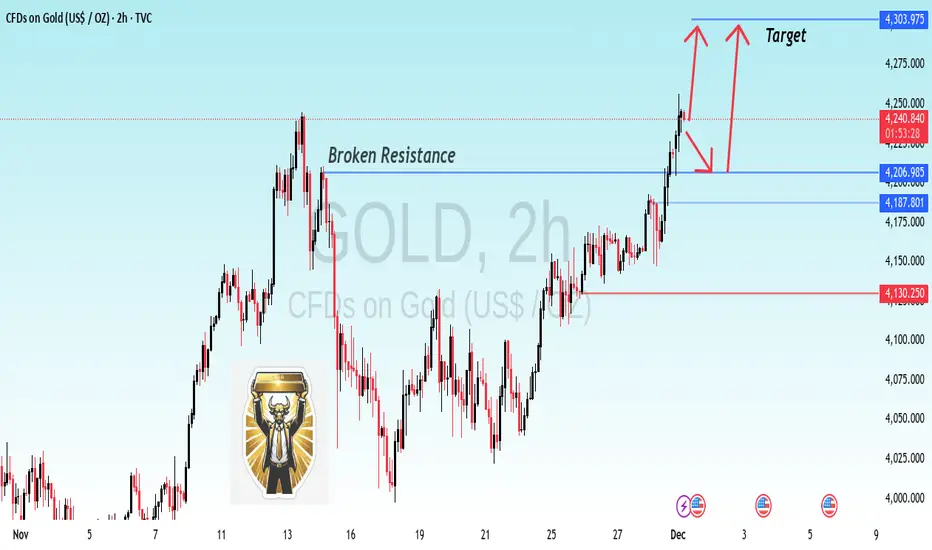
GOLD Breakout Confirmation Bulls trakin ControlUPDATE: Previous GOLD Idea Hit 100% Exactly as Expected! | JT_CHARTsMaster
The last analysis played out perfectly — GOLD followed the exact structure, respected the levels, and completed the move with full accuracy.
Thank you to everyone who supported the previous idea!
---
📌 Current Analysis (2H Timeframe)
Gold has broken the key resistance zone, and price is now retesting the breakout area.
After this clean retest, the market is showing signs of bullish continuation.
Key Points:
✔ Previous resistance now acting as support
✔ Break–retest–continuation structure is active
✔ Market is holding above the breakout zone
✔ Bullish momentum is building toward the next targets
---
📈 Expected Move
As long as gold stays above the breakout level, the probability of a move toward the next targets remains strong.
I’ve highlighted the expected upward move on the chart with arrows for clarity.
---
🙏 Thanks for Your Support
Your boosts, comments, and likes motivate me to share more accurate analyses like this.
👉 If you found this helpful, please Boost the idea and leave a comment — it really helps!
— JT_CHARTsMaster
Be ready for a new rallyAs we can see in Daily timeframe market had already done a breakout for major resistance zone and is getting ready for new high.4151-4155 and 4160-4168 are key levels and if any daily candle close below 4140 then it will pause the rally and enter into consolidation but if any daily candle close above 4250 then consider for a new rally till 5370 atleast.

THE KOG REPORTTHE KOG REPORT:
In last week’s KOG Report we gave the potential path as well as the red box defence to look for any reaction in price. We managed to support the lower red box defence giving us a nice long to start the week then resulting in the higher defence holding and giving us an extremely decent short. It was only during the later part of the week we faced some choppy and whipsawing ranging which we decided wasn’t worth committing too much into, so we returned to scalping the red boxes only for the remainder of the week.
A decent week in Camelot, not only on Gold but the numerous other pairs we trade and analyse.
So, what can we expect in the week ahead?
It’s likely to be another week of choppy price action and potential for a range to develop even smaller than we’ve seen in previous sessions. We have the key level of support below again at 4040 while resistance above sits at key level of 4104. Economic news on Tuesday should bring volume and we would expect one of these levels to break open and the range to have accumulated enough to then move us into a clear direction.
We have added the red box defence up and down, ideally wanting a test of that low, so price going up on the open could represent opportunities to attempt the short unless defence is breached. Otherwise, we’ll look to take this into that 4000-3980 levels before we look for any RIPs.
RED BOXES:
Break below 4060 for 4055, 4050, 4041, 4033 and 4010 in extension of the move
Break above 4081 for 4095, 4103, 4120 and 4130 in extension of the move
Please do support us by hitting the like button, leaving a comment, and giving us a follow. We’ve been doing this for a long time now providing traders with in-depth free analysis on Gold, so your likes and comments are very much appreciated.
As always, trade safe.
KOG
