XAUUSD KEY LEVELS FOR 05-12Greetings
Hello traders, This is the crucial resistance zone for XAU-USD at 30 minute,
based on the movement of the day prior and market trends.
Resistance zone (White line)
Important levels:
4237.76 is the entry
Target: 4227.76
Stop loss: 4247.76
1:1 Risk-Reward Ratio
We are inspired to continue learning and exchanging ideas by your likes and boosts!
Trade ideas

December 3rd - Gold's correction is over, continue to buy!What recent news has influenced gold prices? How should we assess the future direction of gold?
On Wednesday (December 3rd) in early Asian trading, spot gold traded in a narrow range, currently hovering around $4218.69 per ounce. Although there has been a slight pullback due to profit-taking in the short term, multiple positive factors are quietly accumulating, and investors are focused on the upcoming Federal Reserve policy meeting. Currently, spot gold prices are fluctuating around $4200 per ounce, with market sentiment wavering between expectations of interest rate cuts and economic data. Analysts generally believe that this is not just a short-term fluctuation, but rather a prelude to a higher peak. Looking back at Tuesday's price action, gold prices retreated after reaching a six-week high, but rebounded strongly at the end of the session, showing strong buying support on dips. Meanwhile, the surge in global central bank gold purchases, the decline in US Treasury yields, and the escalation of geopolitical tensions have all provided a solid foundation for gold's support.
The Federal Reserve's policy direction is undoubtedly a core variable influencing gold prices. Currently, the market prices in an 89% probability of a 25 basis point rate cut at the Fed's December meeting, a significant increase from 63% a month ago. This is attributed to dovish signals from Fed policymakers and signs of a cooling US economy. Weaker-than-expected manufacturing data released on Monday further increased pressure for a rate cut. Investors are closely watching upcoming key data releases, including Wednesday's November ADP employment report and Friday's September Personal Consumption Expenditures (PCE) index, the Fed's preferred inflation indicator. While these data may not overturn the rate cut decision, they will provide further guidance on the Fed's interest rate path. Combined with today's upcoming releases of the US November ADP employment change, September import price index month-on-month, September industrial production month-on-month, and November ISM non-manufacturing PMI, any data indicating economic weakness, coupled with geopolitical risks, will further amplify the upside potential for gold. In conclusion, while the gold market faces short-term profit-taking pressure, multiple factors, including expectations of a Fed rate cut, strong central bank gold purchases, declining US Treasury yields, a weakening dollar, and geopolitical uncertainties, are collectively driving an upward breakout. Looking ahead, with the new year approaching, the $5,000 target is not out of reach. Investors should closely monitor the Fed meeting results and key economic data.
Gold Trading Strategy Reference:
Short Position Strategy:
Strategy 1: Sell gold in batches around 4260-4265 with 20% of your position. Stop loss at 8 points. Target 4230-4200, with a further target of 4185 if it breaks through. (This strategy is time-sensitive; please check this post for updates.)
Long Position Strategy:
Strategy 2: Buy gold in batches around 4180-4185 with 20% of your position. Stop loss at 8 points. Target 4220-4250, with a further target of 4265 if it breaks through. (This strategy is time-sensitive; please check this post for updates.)

12.01 Euro early-session plan for goldXAUUSD (Gold vs. USD) 1-hour Trading Plan for Today’s Europe & US Sessions (Long-Only)
1. Primary Strategy: Buy on Pullback (Priority Execution)
- Trigger: Price pulls back to the 4218-4225 zone (near the "Support Zone" + 0.382 Fib support on the chart) + bullish candlestick pattern forms (e.g., bullish engulfing, hammer).
- Entry: Go long immediately.
- Stop Loss: Below 4210.
- Targets: First target at 4255; if broken, second target at 4285 (Target Zone 1 on the chart).
2. Secondary Strategy: Buy on Breakout (Supplementary Execution)
- Trigger: Price holds above 4255 + closes as a solid breakout bullish candle (no long upper wick).
- Entry: Go long with a smaller position (60%-70% of the primary strategy’s position size).
- Stop Loss: Below 4240.
- Targets: First target at 4285; second target at 4302 (Target Zone 2 on the chart).
3. Supplementary Strategy: Add Position on Extreme Pullback (Execute Cautiously)
- Trigger: Price unexpectedly pulls back to 4214 (0.382 Fib support) + shows reversal signals (e.g., doji, volume-spiked bullish candle).
- Entry: Add to the position with a small size (total position ≤ 1.5x the primary strategy’s size).
- Stop Loss: Below 4200.
- Targets: First target at 4246 (current price level); second target at 4255.
GOOD LUCK!
LESS IS MORE!

XAUUSD Analysis - Trendline Rejection & Potential Bounce Setup📊 XAUUSD 30-Minute Technical Analysis – Trendline Pressure & Key Demand Zone
This 30-minute XAUUSD chart shows gold currently trading under a clear descending trendline, indicating short-term bearish pressure. Price has rejected the trendline multiple times, confirming sellers are still active in the market.
🔻 Current Market Structure
Gold is forming lower highs and lower lows, respecting the downtrend structure. Recent candles show rejection from the trendline once again, suggesting a potential continuation toward the lower support zone.
🟦 Mini Reversal Zone (MRZ)
A key short-term demand area exists between 4,190 – 4,185 (marked in blue).
This zone has previously acted as a minor support, and the price may attempt a temporary bounce from here.
🟩 Major Demand Zone / Volume Burst Area
The stronger reversal area sits below the MRZ, highlighted in green.
This is where the chart indicates:
High buying volume previously entered the market
Bullish reactions were seen earlier
The next impulsive leg may start once price enters this volume burst zone
This zone will be crucial for spotting bullish reversal patterns, such as:
Bullish engulfing
Pin bar / hammer
Break and retest setups
🔍 What We Need
Inside the marked demand zones, we need a positive bullish pattern to confirm buyer strength. Entering without confirmation may be risky due to ongoing trendline resistance.
📉 Expected Price Path
The projected price movement shows:
A drop from current levels toward the MRZ
A potential short pullback
Final sweep into the Volume Burst Zone
A possible bullish reversal from that deeper area
If a strong bullish pattern forms in the green zone, buyers may push back toward the trendline and possibly attempt a breakout.
⚠️ Important Notes
Trendline remains the immediate barrier for buyers
Bearish continuation is possible until the deeper support zone is tested
Only bullish confirmation patterns can validate a reversal
✅ Short Summary (For Minds / Social Posting)
Gold is still under bearish pressure on the 30M chart, moving inside a descending trendline. Price is expected to test the Mini Reversal Zone and possibly drop deeper into the Volume Burst Demand Zone. A bullish reversal is only valid if a strong positive pattern forms in these areas.

MARKET CONTEXT XAUUSD 30 I 12/02 1. Current Market Context
Gold has just dropped sharply from the 4,245 high and is now trading around 4,206 — sitting below the supply zone and right at the sell neckline you marked earlier.
This clearly indicates:
📉 SELLers are dominating the short-term structure
🔻 Strong rejection from 4,226–4,236
📊 Volume Profile shows the POC above, confirming distribution
Short-term structure has shifted from bullish → bearish on M30–H1.
⸻
📊 2. Key Price Zones on the Chart
🟥 Supply Zone – High-probability SELL area:
4,226 – 4,236
→ Strong rejection, high volume, high likelihood the market will pull back here to continue SELL.
🟥 Gold Sell Neckline:
4,216 – 4,218
→ A retest of this zone = clean SELL setup following the new structure.
🟩 Swing POC Zone – Deep BUY area:
4,165 – 4,168
→ Major support zone with confluence of Volume Profile & H4 Demand.
⸻
🔍 3. Current Price Action (Price 4,206)
Price is consolidating slightly after the strong drop.
❌ No bullish reversal signals yet → SELL remains priority.
📉 H1 is forming lower high – lower low → confirmed short-term downtrend.
From 4,206, price is likely to:
👉 Pull back to 4,216–4,226 and then continue falling
👉 If it drops directly → first target 4,188, deeper target 4,165
⸻
💬 Quick Summary
Gold is currently correcting downward following the new bearish structure on H1/M30.
4,206 is NOT a BUY zone — it’s a mid-range area with high noise.
Best SELL zones: 4,216–4,236
Best deep BUY zone: 4,165–4,168
Trade by zones → follow the trend → avoid FOMO.
Disclaimer: This is not financial advice. Please trade responsibly.

XAUUISD: Market Analysis and Strategy for December 1stGold Technical Analysis:
Daily Resistance: 4330, Support: 4150
4-Hour Resistance: 4265, Support: 4193
1-Hour Resistance: 4256, Support: 4226
The monthly chart's renewed upward movement reinforces the continuation of this year's bull market. Last Friday's strong rally indicates that the short-term upward trend has not been hindered, further strengthening bullish expectations for early December.
The daily chart continues last Friday's upward trend, with the "rounded bottom" candlestick pattern remaining intact. The Asian session also saw a strong upward breakout, with the Bollinger Bands expanding upwards, moving average support moving higher, and the MACD/KDJ indicators turning upwards. Today's accelerated breakout above previous highs is also a bullish signal. Short-term trading should follow the trend! Long-term holders can wait for the Fed's interest rate decision before considering buying opportunities!
Based on the 1-hour chart, gold continued its upward trend during the European session. The candlestick pattern is within an upward channel, and the short-term Bollinger Bands are narrowing upwards. Be aware of potential sideways consolidation followed by a rebound after indicator correction. Resistance is seen around 4260; a break above this level could lead to further gains towards 4300/4330. Support levels are around 4230/4222.
Trading Strategy:
BUY: 4230~4222
Selling should wait for a bearish pattern to emerge in real-time.
XAUUSD_15MGold Analysis
Short Time
Elliott Wave Analysis Style
The market can enter five waves of ascent by crossing the number 4155 and move towards the $4200 area

Gold Alternative RoutesGold updated routes, elliot wave is not one constant but it is variety of possibilities and as we go along we update and eliminate some of the wrong tracks at the end what we get is the right entry and right exit.
So now for our search of next entry there is a buy trade with small stop loss here but the real wave we wanna catch is the big impulse correction so i will be looking into sell when it goes up.
short term targets 3280-3310-3330 mid term targets are down at 4080-3920-3850 and long ter target is at 4700+ i expect it to go above 4700 in next 6-9 months time.

Gold (XAUUSD) Range-Bound After ATH Rejection – Gold (XAUUSD) continues to consolidate in a high-timeframe range between ~$4,200 and $4,247 after failing to sustain above the psychological $4,250 zone. The 15-min structure shows repeated defense of the 4,200 higher-low area, while upside momentum fades quickly into the 4,240–4,247 supply cluster. Volume profile highlights thinning participation near the highs, typical of distribution or profit-taking following the strong November rally. Until a decisive breakout or breakdown occurs, range-bound conditions dominate with alternating impulsive spikes and tight coils.#Gold #XAUUSD #PreciousMetals #TechnicalAnalysis #MarketStructure #NotATradingCall

GOLD fluctuates sharply as labor data weakensSpot OANDA:XAUUSD closed nearly flat at $4,203.06 an ounce, down less than 0.1%, after a volatile session in New York. A significantly weaker-than-expected ADP report sent gold soaring to $4,241.60 an ounce, before profit-taking pressure and a sharp reversal in silver sent prices quickly tumbling back to $4,195 an ounce.
As of writing today, Thursday, December 4, spot gold was trading at $4,202 an ounce, up about $10 on the day.
ADP data showed the US private sector lost 32,000 jobs in November, in stark contrast to expectations for a gain of 10,000, the sharpest decline since March 2023. Win Thin (Nassau 1982) assessed that the ADP index had weakened continuously, reflecting a sustained downward trend in the labor market. Nela Richardson (ADP) noted the widespread slowdown across all business groups, especially the small and medium-sized sector, a sign of more cautious consumers in the context of macro instability.
While gold rebounded in response to the data, silver, which had touched $58.97/ounce in the early session yesterday, then fell sharply to $57.83/ounce, dragging the entire group of precious metals into a short-term correction.
Trump’s unexpected move causes market turmoil: Will the Fed chairmanship change soon?
A new political variable emerged when the White House abruptly canceled the interview schedule for the Fed chairman candidate this week. The Wall Street Journal commented that this move shows that President Trump may have finalized his choice to succeed Powell.
The market immediately raised the possibility that the leading candidate is Kevin Hassett, the White House economic adviser, who is seen as leaning towards a strong interest rate cut stance. The weak USD and recent recovery in gold partly reflect expectations that Hassett may push for a deeper easing cycle after Mr. Powell ends his term in May next year.
Steve Englander (Standard Chartered) said Hassett has an “impressive” track record, but worries about the Fed’s independence under political pressure. The Financial Times said bond investors have expressed concerns to the US Treasury that Hassett may prioritize short-term growth over price stability.
CME FedWatch currently prices an 89% chance of a Fed rate cut at its December 9-10 meeting. Markets are still waiting for September core PCE data, delayed until Friday, a key piece of the inflation puzzle.
Fundamental Outlook: Lower Yields Boost Gold, But Correction Risks Not Over
Given that gold is not yielding, expectations of QE are the central support. However, the combination of weak data, silver volatility and profit-taking pressure suggests that the road ahead for gold will be bumpy.
Macro trends – weak labor, softer USD, and political uncertainty surrounding the Fed Chair – continue to favor price support. But until we break above $4,400/oz with convincing liquidity, the momentum for acceleration will remain at the potential level.
Technical analysis and recommendations OANDA:XAUUSD
Gold is operating in a new bullish cycle: the price remains above the medium-term rising channel, making successive higher lows and closing above the short-term moving averages, indicating active buying.
The important support zone around $4,128–$4,130 (Fibo 0.236) is well defended; if maintained, the short-term bullish structure remains intact.
The RSI has recovered from the neutral zone, implying that the upside momentum is still strong but not overbought. The bullish scenario is complete when the price remains above the short-term MA21, does not break below $3,972–$3,973 (Fibo 0.382) and moves towards challenging the resistance zone of $4,300–$4,380 (channel top/Fibo extension).
Cyclical risk: a break below $3,972 would weaken the structure and could drag the price to a test of $3,846–$3,720.
SELL XAUUSD PRICE 4231 - 4229⚡️
↠↠ Stop Loss 4235
→Take Profit 1 4223
↨
→Take Profit 2 4217
BUY XAUUSD PRICE 4141 - 4143⚡️
↠↠ Stop Loss 4137
→Take Profit 1 4149
↨
→Take Profit 2 4155

ZakopiecFX GOLD XAUUSD TodayXAU/USD Gold Analysis - December 3, 2024
Current Price: Around $2,626-2,630
Intraday Range: $2,606 - $2,656
Technical Analysis
Bearish Signals:
Technical patterns show an Evening Star reversal formation near the resistance level around $2,655, along with a Hanging Man pattern around $2,630, both suggesting a potential price reversal. The MACD indicator has crossed below the signal line and is declining in negative territory, indicating fading bullish momentum. The RSI is also declining around 57, suggesting potential downward movement.
Key Support Levels:
$2,602
$2,557
$2,514
$2,460
$2,406
$2,352
$2,294
$2,220
Key Resistance Levels:
$2,645-$2,650 represents a strong barrier
Further resistance at $2,664-$2,665
$2,677-$2,678
Trading Scenarios
Base Scenario (Bearish):
Short positions below $2,602 with targets at $2,557, $2,514, and lower levels. Stop loss should be placed around $2,630.
Alternative Scenario (Bullish):
Long positions above $2,655 on increased volume, targeting $2,714, $2,774, $2,841, and higher levels. Stop loss around $2,630.
Fundamental Factors
Market Drivers:
Growing expectations of a Federal Reserve interest rate cut in December are supporting gold prices
Markets are pricing in approximately 64% chance of a December Fed rate cut
Geopolitical uncertainties and central bank demand continue supporting the precious metal
Upcoming Events:
Today: November services PMI data
Dec 4: Initial jobless claims
Dec 10: US CPI data and Fed interest rate decision
Market Sentiment
Gold is consolidating near current levels with mixed signals. While technical indicators suggest potential downside pressure in the short term, strong fundamental support from Fed rate cut expectations and safe-haven demand could limit significant declines. The market is showing uncertainty, with key moving averages near current price levels suggesting a decision point is approaching.
Trading Recommendation: Wait for a clear break above $2,655 for bullish continuation or below $2,602 for bearish movement before entering positions. Given the mixed signals, risk management is crucial.
DISCLAIMER: This analysis is for informational purposes only and should not be considered financial advice. Trading in financial instruments involves significant risk, including the potential loss of principal. Past performance does not guarantee future results. Market conditions can change rapidly, and the information provided may not reflect real-time market movements. Always conduct your own research and consider consulting with a qualified financial advisor before making any investment decisions. The author is not a financial advisor and assumes no responsibility for any investment decisions made based on this analysis.

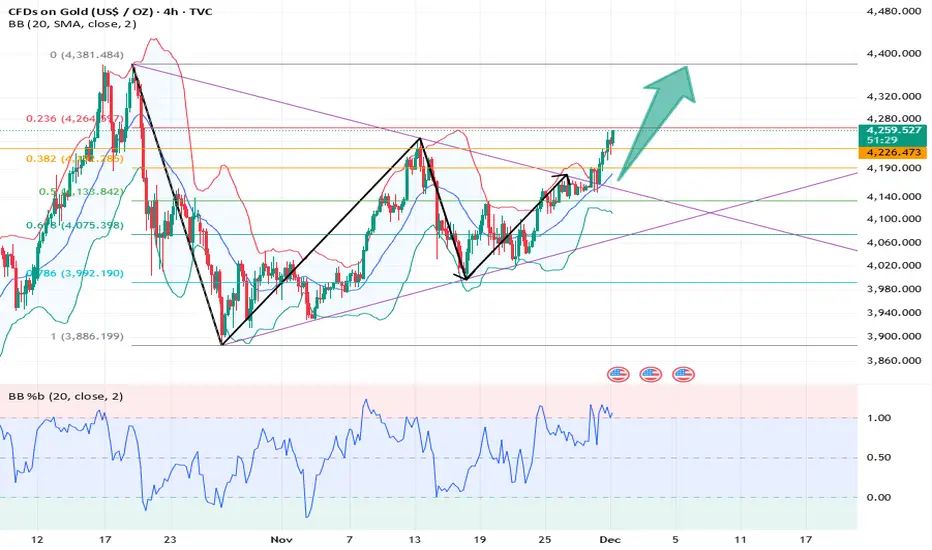
XAU/USD 02 December 2025 Intraday AnalysisH4 Chart:
-> Swing: Bullish.
-> Internal: Bullish.
Analysis and bias remains the same as analysis dated 20 October 2025.
Price has printed as per previous intraday expectation by printing a bearish CHoCH which indicates, but not confirms, bullish pullback phase initiation.
Price is currently trading within an established internal range, however, I will continue to monitor price with regards to depth of pullback.
Intraday expectation:
Price to continue bearish, react at either discount of 50% internal EQ, or H4 supply zone before targeting weak internal high priced at 4,380.990.
Note:
The Federal Reserve’s sustained dovish stance, coupled with ongoing geopolitical uncertainties, is likely to prolong heightened volatility in the gold market. Given this elevated risk environment, traders should exercise caution and recalibrate risk management strategies to navigate potential price fluctuations effectively.
Additionally, gold pricing remains sensitive to broader macroeconomic developments, including policy decisions under President Trump. Shifts in geopolitical strategy and economic directives could further amplify uncertainty, contributing to market repricing dynamics.
H4 Chart:
M15 Analysis:
-> Swing: Bullish.
-> Internal: Bullish.
Price has printed as per analysis dated 14 November 2025 where I mentioned price to trade down to either discount of 50% internal EQ, or M15 demand zone before targeting weak internal high, priced at 4,245.195.
Price subsequently printed a bearish CHoCH, however, as mentioned yesterday, I would closely monitor price with respect to depth of pullback.
Price did not pull back with any significance, therefore, I will apply discretion and not classify an iBOS. I have marked this with red dotted and dashed lines.
Price has since printed another bearish CHoCH.
We are currently trading within an established internal range, however, as per yesterday, I will continue to monitor price with respect to depth of pullback.
Intraday expectation:
Price to trade down to either discount of 50% internal EQ, or M15 demand zone before targeting weak internal high, priced at 4,264.700.
Note:
Gold remains highly volatile amid the Federal Reserve's continued dovish stance, persistent and escalating geopolitical uncertainties. Traders should implement robust risk management strategies and remain vigilant, as price swings may become more pronounced in this elevated volatility environment.
Additionally, President Trump’s tariff announcements, particularly against China, are expected to further amplify market turbulence, potentially triggering sharp price fluctuations and whipsaws.
M15 Chart:

Gold Trade Set Up Dec 1 2025Gold remains bullish making HH/Hl on the 1h and 4h but i want to see internal 5m-15m structure play out first before looking to take buys towards BSL

Gold Is Loading Pressure — The Next Breakout Will Be Violent1. Market Structure Overview
Price is currently respecting a rising channel, showing a consistent sequence of higher highs – higher lows, but with gradually compressed momentum near the upper boundary and the resistance zone.
Key observations:
- Price is hovering near the upper trendline of the ascending channel.
- The resistance zone is directly above current price, causing hesitation and wicks.
- The chart shows a potential indecision → correction → continuation pattern forming.
This reflects a market preparing for a bullish continuation, but only after a controlled pullback.
2. Expected Scenarios for Today
✓ Primary Scenario – Bullish Retest Before Breakout (High Probability)
Price is likely to:
- Pull back toward the midline/lower edge of the ascending channel (yellow zone).
- Form a higher low within structure.
- Execute a clean retest of the ENTRY ZONE highlighted on your chart.
- Break above the Resistance Zone → Continue toward higher targets.
This matches your projected structure perfectly.
Entry Logic:
- Wait for price to retest the rising trendline and show bullish confirmation.
- The ENTRY ZONE is valid and aligns with trend continuation.
Upside Targets:
- TP1: 4,215–4,225
- TP2: 4,250+
- TP3 (extended): 4,280+ if the breakout is impulsive.
✓ Secondary Scenario – Compression Before Break
If price stays inside the channel and moves sideways:
- Market remains bullish but indecisive.
- This builds liquidity for a stronger breakout later.
- No selling is recommended unless structure breaks.
This scenario still favors bulls—just slower.
3. Trend Bias (Intraday)
The dominant trend is:
➡️ BULLISH – Buy the dip, do NOT chase breakouts
Signs confirming bullish bias:
- Higher lows remain intact.
- Structure respects the ascending channel perfectly.
- Resistance is tested multiple times → weakening.
- Volume spikes on bullish waves, fades on corrections.
4. Professional Conclusion
Gold remains in a strong bullish continuation structure inside the rising channel.
Your ENTRY ZONE is positioned perfectly for a high-quality retest trade.
Plan of Action:
- Wait for the pullback to the trendline.
- Confirm bullish rejection.
- Enter long within the zone.
- Target the liquidity sweep above resistance.
Smart, calculated, high-probability setup. 🔥

GOLD H4 Buying Trade idea From the Support LevelHello Traders
In This Chart GOLD HOURLY Forex Forecast By FOREX PLANET
today Gold analysis 👆
🟢This Chart includes_ (GOLD market update)
🟢What is The Next Opportunity on GOLD Market
🟢how to Enter to the Valid Entry With Assurance Profit
This CHART is For Trader's that Want to Improve Their Technical Analysis Skills and Their Trading By Understanding How To Analyze The Market Using Multiple Timeframes and Understanding The Bigger Picture on the Charts

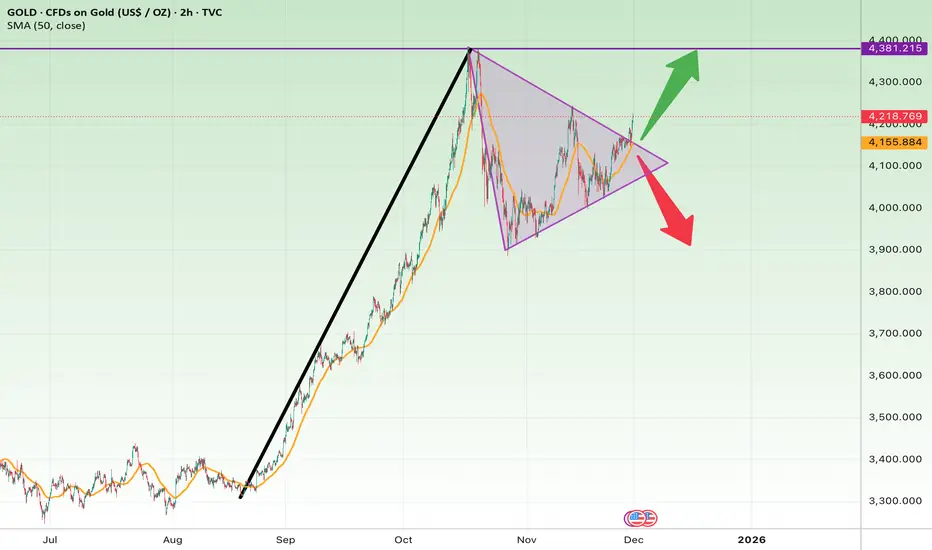
Gold Is Coiling for a Big Move — Triangle Breakout Incoming?Gold has formed a symmetrical triangle after a strong vertical rally.
Price is currently breaking out of the upper triangle boundary, which can signal continuation of the larger bullish trend.
Bullish Scenario (Confirmed breakout)
Upside Targets:
• 4320
• 4380 (major resistance)
• 4450 if momentum expands
Bearish Scenario (Failed breakout / breakdown)
Downside Targets:
• 4050
• 3950
• 3850 (major structural support)
Stop Loss
• Long: below 4160
• Short: above 4230
XAUUSD 4h
as we see on above chart there are two waves one in another, it couldn't broke the Lower low(2) and made a Higher low(4), we are expecting to hit the lower high(3) and if it successfully pass that it will go to the Higher high(1).
Although price broke the dynamic resistance, there are some sellers on lower high (3) area.

Gold H1 – Pre-NFP Liquidity Hunt as US–China Tone Warms🟡 XAUUSD – Intraday Smart Money Plan | by Ryan_TitanTrader (25/11)
📈 Market Context
Gold is approaching a key premium zone while markets react to fresh geopolitical headlines. Earlier today, Donald Trump confirmed he had a “very good call” with President Xi of China, highlighting strong bilateral relations and continued cooperation.
This matters for gold because:
• Warmer US–China relations often reduce geopolitical risk premiums, pressuring gold.
• The timing is critical: markets are entering NFP week, a period where institutions frequently engineer liquidity grabs.
• Traders may see a USD-supportive environment ahead of NFP, especially if risk sentiment stabilizes.
In short, gold is sitting in a zone where liquidity sweeps are highly probable before a larger move develops.
🔎 Technical Analysis (1H – SMC Structure)
• Market Structure
Price is climbing toward a major liquidity cluster around 4170–4172, aligning with previous equal highs and an unmitigated supply block.
Below, the FVG demand zone at 4102–4100 serves as today’s discount reaction zone.
• Premium Sell Zone (1H Supply)
4170 – 4172
• Buy-side liquidity sits above prior highs
• Clear premium zone relative to current swing structure
• Likely target for engineered sweep ahead of NFP volatility
• Discount Buy Zone (1H Demand)
4102 – 4100
• FVG imbalance + BOS origin
• Confluence with discount retracement levels
• Strong RR for bullish reaction after sell-side sweep
• Liquidity Map
• Buy-side: 4172 → 4180
• Sell-side: 4100 → 4092
Expect the classic SMC sequence:
Sweep → CHoCH → Displacement → Retest → Expansion.
🔴 Sell Setup – Premium Reaction
Entry: 4170 – 4172
Stop-Loss: 4180
Take-Profit:
→ 4138 (imbalance fill)
→ 4115 (mid-range liquidity)
→ 4102–4100 (discount zone retest)
📌 Must wait for liquidity sweep + bearish CHoCH on M5–M15.
🟢 Buy Setup – Discount Reaction
Entry: 4102 – 4100
Stop-Loss: 4092
Take-Profit:
→ 4135 (intraday reaction)
→ 4160 (premium edge)
→ 4170 (buy-side liquidity sweep)
📌 Valid only after sell-side liquidity is taken.
⚠️ Risk Management Notes
• Expect extra volatility as markets price in US–China optimism ahead of NFP.
• Liquidity traps are common during Asian/London sessions—wait for confirmation.
• Avoid taking positions inside the chop zone 4125–4150 without structure shifts.
• Treat both scenarios as liquidity plays, not trend continuation trades.
📝 Summary
Gold is approaching a major liquidity pocket as geopolitical sentiment improves following Trump’s positive call with President Xi.
With NFP approaching, institutions are likely to sweep liquidity above 4170 or below 4100 before establishing direction.
Key Levels Today
🔴 Sell Zone: 4170–4172
🟢 Buy Zone: 4102–4100
Prepare for the typical pre-NFP pattern:
Accumulation → Sweep → Displacement → Retest → Target.
📍 Follow @Ryan_TitanTrader for daily Smart Money updates.

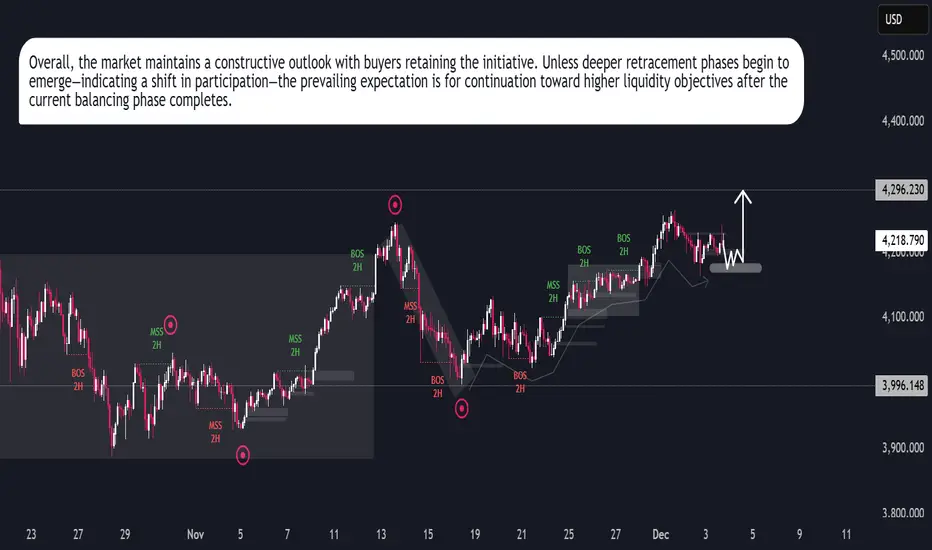
Gold Market Flow Points Toward Higher LevelsGold Market Flow Points Toward Higher Levels
Gold continues to display a controlled upward trajectory characterized by steady accumulation and orderly price expansion. The recent sessions show a consistent pattern of demand absorption, where each corrective phase is met with renewed buyer engagement, preventing deeper retracements. This suggests that the market remains comfortably positioned within a bullish environment, supported by ongoing interest from medium-term participants.
Price flow has transitioned away from the aggressive liquidation seen earlier in the month and is now driven by a more balanced rotation between buyers and short-term profit-takers. Despite this rotation, the dominant pressure remains upward, as visible through the repeated failure of sellers to extend declines. Momentum flows indicate that buyers are gradually reclaiming lost ground after every corrective cycle, signaling stable confidence in higher valuations.
Market behavior also reflects a pattern where liquidity beneath short-term swing points is routinely harvested before upward expansion resumes. This action shows that deeper market participants continue to optimize entry points by collecting orders during brief moments of weakness. Once these orders are filled, price rapidly rotates back upward, revealing that underlying demand remains unshaken.
Current positioning suggests that Gold is in a preparation phase for another expansion leg. Price is stabilizing in a compression zone where volatility temporarily narrows before a directional drive. Historically, such compression within an established upward environment often precedes continuation, especially when buyers demonstrate willingness to defend even shallow pullbacks.
BUY SIGNAL – XAUUSD (GOLD)BUY SIGNAL – XAUUSD (GOLD)
Signal: BUY
Entry Zone: 4210–4215
Bias: Bullish continuation from demand zone
Reasoning:
Price has tapped the highlighted buy zone, showing rejection with bullish candles and increasing volume. Structure suggests a potential continuation to the upside toward the previous high.
Description:
Gold is reacting strongly from a fresh demand zone. A bullish reversal pattern has formed, indicating buyers are stepping in. Buying within the 4210–4215 zone offers a favorable risk-to-reward opportunity toward higher resistance levels.

Going Short On Gold. On my School Fees!Today gold has shown clear bearish pressure. Traders who were focused on bullish structures or planning to buy have mostly been taken out of their positions as price swept those zones. With this current sentiment, gold is still very likely to keep pushing lower. Price continues to form fresh lower lows and many of the previous highs on the five minute chart have already been mitigated, reducing the chances of any meaningful bullish recovery for now.

XAUUSD – LANA PRIORITIZES BUYING ACCORDING TO SWING WAVES AT...XAUUSD – LANA PRIORITIZES BUYING ACCORDING TO SWING WAVES AT THE BEGINNING OF THE WEEK
Fundamental Analysis
The Fed has just announced it will end the QT (quantitative tightening) program from December 1st, accompanied by a target federal interest rate of 3.75–4%.
When the Fed stops QT, the pace of balance sheet reduction slows down, meaning the pressure to withdraw liquidity from the market decreases, which is usually a positive factor for risky assets and gold.
Mechanism:
QE: balance sheet expands, injecting liquidity into the market.
QT: balance sheet contracts, withdrawing liquidity.
The temporary halt of QT leads the market to expect the Fed is being softer with monetary policy, thereby supporting the medium-term upward trend of gold.
In this context, Lana perceives that gold at the beginning of the week still has room to rise, but there will be fluctuations around important liquidity zones.
Technical Analysis
On the H4 chart, the price structure is following an upward Elliott wave, with clear waves (1)–(2)–(3)–(4)–(5). The current upward wave has not yet shown a major reversal signal.
The Swing zone 4190–4195 below is the nearest important bottom, acting as the main short-term support. This is also where Lana prioritizes watching for swing wave buying.
Above, two notable Liquidity zones:
4250–4260: near liquidity zone, potential for fake break/adjustment.
4365–4370: further liquidity zone, coinciding with the old peak, likely a strong profit-taking area if the price continues to expand the upward wave.
Lana's preferred scenario: gold may slightly adjust to the swing zone 4190–4195, then continue to expand the wave to test the upper liquidity zones in turn. However, right at the Liquidity zone, the market is very prone to stop sweeps, fake breaks, so Lana does not encourage chasing Buy at these zones.
Price Zones to Watch
Main Support (Swing & Buy Zone): 4190 – 4195
Resistance / Liquidity Zones: 4250 – 4260
4365 – 4370
Trading Scenario
Buy 4190 – 4195
SL: 4185
TP: 4250 – 4260 – 4365 – 4370

11.28 Asian early-session plan for goldYesterdays' plan has hit both TARGETS.
Current Market Context
1. Rhythm: Thursday (pre-Thanksgiving) sideways consolidation → Friday Asia session breakout (out of the range) → EU/US session expected to trade in a narrow sideways range (pink box in chart), waiting for a breakout next Monday.
2. Key Levels:
- Support Zone: 4171.34 (Asia session breakout launch point)
- Near-term Resistance: ~4190 (current price area, no strong pressure yet)
- EMA Support: 5-period EMA = 4172.45 (aligns with the support zone)
EU/US Session Trading Strategy (Low-volatility environment, light position short-term)
Core Strategy: Range Trading (4172–4190)
- Long Setup (Buy on Pullback to Support):
- Entry: 4175 ± 2 (dip to support zone/5-period EMA; avoid precise "pinpoint" entries)
- Stop Loss: 4168 (below the support zone, abandon bullish bias)
- Targets: 4185 (range upper bound) → 4190 (if EU session leans bullish)
- Short Setup (Sell on Bounce to Resistance):
- Entry: 4190 ± 2 (test current price resistance)
- Stop Loss: 4198 (above the breakout level, abandon bearish bias)
- Targets: 4180 (range lower bound) → 4175 (support zone)
NEXT Exception Handling (If Range Breaks)
- Break Above 4190: Hold long positions, target 4200 (next Monday’s expected breakout level).
**Do NOT chase highs in the EU session* (low liquidity);
**avoid holding positions over WEEKEND.
Core Rules
Today’s EU/US session is "consolidation after breakout" with limited volatility. Cap position size at ≤0.5% per trade; no overholding (no overnight positions, as US markets are closed for Thanksgiving).
GOOD LUCK!
LESS IS MORE!
