GOLD Buying Trade idea From the Support LevelHello Traders
In This Chart GOLD HOURLY Forex Forecast By FOREX PLANET
today Gold analysis 👆
🟢This Chart includes_ (GOLD market update)
🟢What is The Next Opportunity on GOLD Market
🟢how to Enter to the Valid Entry With Assurance Profit
This CHART is For Trader's that Want to Improve Their Technical Analysis Skills and Their Trading By Understanding How To Analyze The Market Using Multiple Timeframes and Understanding The Bigger Picture on the Charts
Trade ideas

Bullish trend gold its still bullish . its consolidation 4190-4200
Next step is 4300-4380 before cut rates .

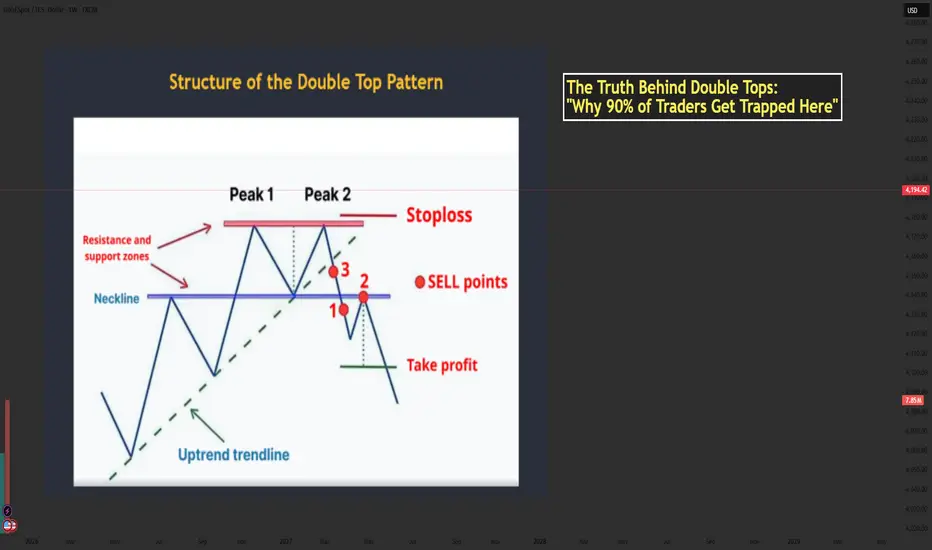
The Truth Behind Double Tops: Why 90% of Traders Get Trapped...📘 Mastering the Double Top Pattern — Structure, Psychology & How Smart Money Uses It
- The Double Top is one of the most powerful reversal patterns in technical analysis. When used correctly, it helps traders catch the transition from bullish momentum → bearish reversal with high accuracy.
- Let’s break down the structure using the chart you provided and enhance it with professional-level insights.
🔶 1. Structure of the Double Top
1️⃣ The First Top
- Price pushes upward strongly during an uptrend.
- Buyers are in full control and create the first peak.
- After reaching resistance, price pulls back → forming the neckline.
This pullback is normal and represents the market taking profits.
2️⃣ The Second Top
- Price rallies again but fails to break above Peak 1.
- This failure is extremely important — it shows bulls are losing strength.
- The second top traps late buyers who expect a breakout.
3️⃣ The Neckline Break
- Once price breaks below the neckline, the structure is officially confirmed.
- This represents sellers overwhelming buyers.
- A break of structure → shift in market control.
📌 Professional traders only consider the pattern valid AFTER the neckline break.
🔶 2. Market Psychology Behind the Double Top
Understanding the pattern’s psychology is what separates beginners from professional traders.
1️⃣ At Peak 1
Bulls believe the trend will continue.
Retail traders buy aggressively.
2️⃣ Pullback to Neckline
A healthy correction occurs; no one expects a reversal yet.
3️⃣ At Peak 2
This is where emotions start to shift:
- Retail buyers expect a breakout.
- Smart Money uses this area as a liquidity zone to trigger buy stops.
- Institutions often sell into this liquidity, creating the foundation for reversal.
4️⃣ Neckline Break
Panic begins:
Buyers trapped at Peak 2 start closing positions.
Sellers enter aggressively.
Momentum shifts — the trend has reversed.
5️⃣ Retest
The retest is a psychological trap:
- Trapped buyers hope for “one more push up.”
- Sellers add positions at better prices.
- When price rejects the neckline → the downtrend accelerates.
💡 This is why the retest is the safest sell entry.
🔶 3. Conditions for a High-Quality Double Top
To avoid fake patterns, check these criteria:
✔️ Must appear after a clear uptrend
✔️ Both tops should be similar in height
✔️ Volume should decrease on the second top
✔️ Neckline breakout must be decisive and clean
✔️ Better if second peak creates a stop-hunt wicking above Peak 1
✔️ Even more powerful when aligned with:
- HTF resistance
- Institutional zones
- Liquidity sweeps
- Overbought RSI
- Divergence
🔶 4. How to Trade the Double Top
1️⃣ Entry (Sell Zone)
Best Entry:
👉 SELL on the neckline retest after the breakout.
This gives:
- Best accuracy
- Best risk–reward
- Confirmation that the market has shifted bearish
2️⃣ Stop Loss Placement
Place SL:
- Above Peak 2
- Or above Peak 1 (more conservative)
🛑 SL must sit outside the structure to avoid fake moves.
3️⃣ Take Profit Target
The classic measurement:
- Distance from Peak → Neckline
- Projected downward
This gives the first TP.
TP2 can be placed at:
Next support zone
- Fib 1.618 extension
- HTF demand area
🔶 5. Real Market Example
Your image shows:
- Two clear peaks forming under a resistance zone
- Neckline support holding price
- A strong break below the neckline
- Sell entries at the ideal points:
+ Point 1 → aggressive breakout trader
+ Point 2 → safest retest entry
+ Point 3 → early anticipation entry (riskier)
The downward projection after the pattern aligns perfectly with the expected target zone.
🔶 6. Trader Psychology: Why People Lose with Double Tops
Most traders get trapped because they:
❌ Sell too early (before neckline break)
❌ Expect the second top to drop immediately
❌ Ignore volume or candle strength
❌ Enter without waiting for retest
❌ Fear missing out and chase price after the big drop
Smart Money uses these emotions:
- Greed → traps buyers at Peak 2
- Fear → forces panic selling at neckline break
- FOMO → attracts late sellers at the worst price
Your job is to stay patient and enter only at the retest, where probability is highest.
🔶 7. Professional Tips to Master the Double Top
✔️ Wait for structure confirmation → neckline break
✔️ Don’t sell inside the range between the two peaks
✔️ Use RSI divergence to strengthen accuracy
✔️ Look for stop-hunt wicks above Peak 2
✔️ Combine with trendline breaks for timing
✔️ Use a top-down approach (H4 + H1 → M15 entry)
✨ Final Message for Traders
The Double Top is not just a pattern it is a reflection of fear, greed, and trapped liquidity.
Master the psychology behind it, and it becomes one of your most reliable reversal tools.
If this helped your trading, drop a comment and share your thoughts!
Let’s grow together. ❤️📈
GOLD Sellers In Panic! BUY!
My dear followers,
I analysed this chart on GOLD and concluded the following:
The market is trading on 4192.4 pivot level.
Bias - Bullish
Technical Indicators: Both Super Trend & Pivot HL indicate a highly probable Bullish continuation.
Target - 4205.9
Safe Stop Loss - 4184.7
About Used Indicators:
A super-trend indicator is plotted on either above or below the closing price to signal a buy or sell. The indicator changes color, based on whether or not you should be buying. If the super-trend indicator moves below the closing price, the indicator turns green, and it signals an entry point or points to buy.
Disclosure: I am part of Trade Nation's Influencer program and receive a monthly fee for using their TradingView charts in my analysis.
———————————
WISH YOU ALL LUCK

Market volatility has intensified. Short first, then go long.Gold prices fluctuated slightly, hitting a low of around 4175 before rebounding to a high of around 4230, forming a bottoming-out and recovery pattern. However, the key levels above and below have not been broken, which may be the short-term stage where the bulls and bears continue to accumulate strength to decide on a breakout.
The daily chart indicates a stalemate between bulls and bears, and external factors may be needed to guide the market in the short term. Therefore, the US PCE data may make the expectation of a Fed rate cut a focus of market attention again, and the gold market may experience sharp fluctuations as a result.
From a trading perspective, the consolidation pattern on the daily chart for gold has become increasingly apparent. The $4,190-$4,200 area has formed a recent area of intense trading and a short-term dividing line between bullish and bearish sentiment. Resistance is seen in the $4240-$4260 area; a decisive break above this level would signal the start of a new upward trend.
Before the data release, pay close attention to the $4230-$4235 resistance level and the $4175-$4180 support level in the short term. You could try shorting around 4230, with a stop-loss above 4245. If the price retraces first, you could consider a long position in the 4190-4200 range.
If the price strongly breaks through 4240 before the PCE data release, abandon the short position immediately; the price may accelerate towards 4260-4270.
I will adjust my strategy flexibly based on market fluctuations and update the channel accordingly.

Gold price analysis May 12Gold continues to maintain an impressive upward momentum in today's session, showing that the bulls are still in control of the market and the immediate target is heading straight towards the 429x resistance zone in the US session. At the moment, BUY setups continue to be the main strategy, as long as the bullish structure is not broken.
Trading plan:
BUY Now: 4220
Buy Trigger: When a price rejection signal appears at the support zones 4170 - 4195 - 4115
Target: 4290
Risk: The trend will weaken if the H4 candle closes below the trendline at 4170. If this happens, it is necessary to pay special attention to the next large trendline zone around 4115.
The trend is still favorable for the buyers, so prioritize BUY entry points until the bullish structure is clearly broken.

GOLD Trade Plan 05/12/2025Dear Traders,
**“The price is currently holding above the 4200 zone, and given the movement inside the channel, I expect the price to rise toward the top of the channel as the first target, which is in the 4260–4280 range.”**
Regards,
Alireza!

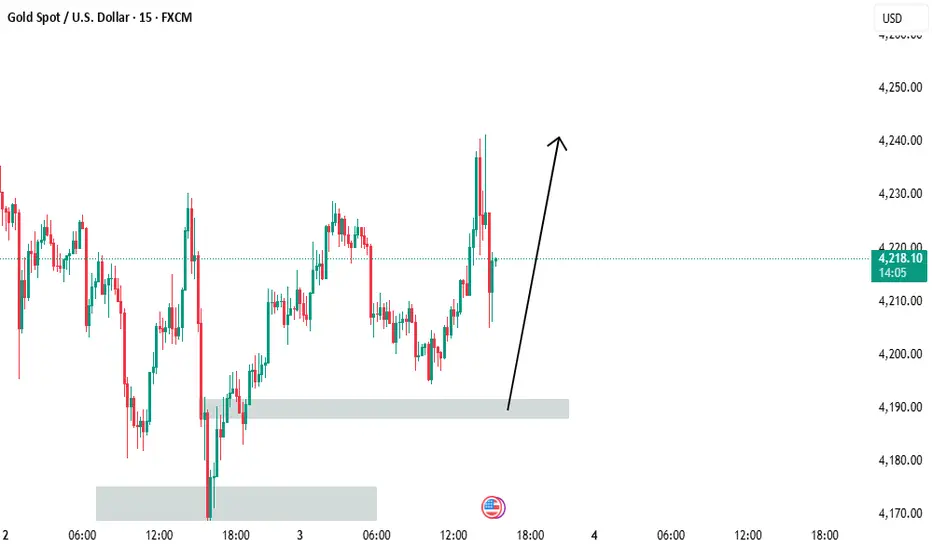
XAUUSD – Watching Key Support Level for Possible Continuation MoGold on the 15-minute chart is approaching an important structure zone.
The upper marked area shows where strong sellers previously reacted, creating a sharp reversal.
Price is now moving toward the lower boundary, which is the key level to watch.
If this level gives way, the chart projection illustrates a deeper continuation path.
This analysis is shared only for chart study and educational purposes.
✅ Analysis (Based on Your Markup)
Price faced clear rejection from the upper area around 4,241.59, showing strong selling interest in that zone.
After the rejection, a series of lower highs and lower lows has formed, suggesting weakening bullish momentum.
The support around 4,164.85 is the major structure level on your chart.
The blue arrow projection indicates a possible scenario where price retests the area above and then continues lower if the support level fails.
The idea highlights how the market could move into a deeper downside expansion once structure breaks.
Overall, the chart represents a bearish continuation concept that depends on price breaking the lower boundary.

Elliott Wave Analysis XAUUSD – 5/12/2025
1. Momentum Analysis
D1:
Daily momentum has begun moving into the oversold zone, indicating that the current corrective phase may be nearing completion. We will wait for a bullish daily candle to confirm the reversal.
H4:
H4 momentum is declining, suggesting that price may continue to drop or move sideways to bring momentum into the oversold area.
H1:
H1 momentum is currently rising, so the market may see a short-term upward move or sideways action at this timeframe.
________________________________________
2. Elliott Wave Structure
D1 – Higher-Timeframe Structure
Price remains within the green ABC structure of wave X.
With D1 momentum entering the oversold zone and preparing to reverse, the market may continue upward for 4–5 days.
The upward momentum range on D1 is quite large, meaning wave C could push higher toward the previous top or even exceed it—potentially forming an expanded flat or even initiating a new uptrend. We will continue monitoring to refine the strategy.
________________________________________
H4 – Medium-Term Wave Count
Price is currently forming green wave 4, developing mostly sideways.
A strong bullish candle will likely confirm that wave 4 is complete, allowing the market to begin green wave 5.
Projected target for wave 5 (green): 4329
________________________________________
H1 – Short-Term Structure
Price is fluctuating inside a major liquidity zone:
• Upper liquidity zone: 4184 – 4245
• Lower thin-liquidity zone: 4144 – 4184
This creates two possible scenarios:
________________________________________
Scenario 1 – Black ABC correction
If price closes below 4184, it will break through the thin-liquidity zone.
In this case:
• Wave C (black) targets 4144, where C = A
• If price drops deeper into the green wave 1 area → the current wave count becomes invalid, and a new structure will be updated accordingly
________________________________________
Scenario 2 – Triangle structure for wave 4
If price fails to break below 4184, the triangle pattern for wave 4 remains valid.
The two red trendlines outline this structure, and price may currently be in wave d or e.
We will wait for a strong bullish candle breaking the upper triangle boundary to trigger a breakout entry.
________________________________________
3. Trading Plan
Triangle scenario
• Wait for a bullish breakout above the upper boundary.
ABC correction scenario
• Wait for price to reach 4144 to trigger the buy setup.
________________________________________
✅ Buy Zone: 4146 – 4144
❌ SL: 4124
🎯 TP1: 4184
🎯 TP2: 4245
🎯 TP3: 4329

Unemployment claims trade ideaOnly looking for buys on gold because the feds will start cutting rates soon. I'm looking for buys above my pink line only if we get stronger U.S unemployment claims. I like this it follows the bigger picture of the feds cutting rates soon and because of the geopolitical tensions in South America

XAUUSD SUPPORT, RESISTANCE & TRENDLINE ANALYSISGood Morning guyzz!!
These are the levels for the day
Go "SHORT" if t stays below 4195.32 with 4180.33 as the first target and sustaining below might lead to 4167.29
Go "LONG" if it stays above 4195.33 with 4224.73 as the first target and it stays above that then go for 4231.39 and above that might lead to 4239.58
Note: Keep a "SHORT" sentiment if it stays below 4220
Keep a "LONG" sentiment if it stays above 4220.

Gold1) Daily Bias: Buy
2) Setup: EW
reason:
a) H1- Correction Wave ( Wave 4)
3) Confirmation entry:
a) H4/H1-trendline & above green line
b) H4/H1-fvg
c) Momentum Candle
4) Minimum Risk : Reward= 1:3

Buy idea!Hello all. how are you? After some months I come back here to share our idea together. Lets start with Gold. it is a buy OPP. be happy(wink)
XAU / USdD 1 Hour ChartHello traders. I have marked my current area of interest for potential scalp buys and sells. he Pre NY volume absolutely corrected the move down from the overnight sessions. So for me, I am waiting to see if I can get in a scalp trade, in either direction. What will happen now is the algorithm trading bots that we spot gold traders trade against will wait to see the orders placed in the order books, and then try to take out leveraged traders in either direction. We, as traders, are trying to ride the institutional wave to win in a trade. Never forget that in order for anyone to win in a trade, someone or some entity has to lose. Be well and trade the trend. Big G gets a shout out. Let's see how this hourly candle closes and how the market reacts as we get closer to the NY open, which may drop gold back down now that most short positions in profit have been eliminataed. All speculation and not based on price action, which is the only wat to trade.

Consider buying at a low point before the data is released.On Monday, gold prices rebounded after hitting a low of around 4163 in the US session, and have since reached a high of around 4228, approaching the previous high of 4235.
Although currently undergoing a minor pullback in the short term, the overall trend remains bullish, and there is a possibility of further upward breakout after a period of consolidation. The current support level will remain around the psychological level of 4200, and there is a possibility that this level will be broken.
However, given the current overall situation, a continuous decline is relatively unlikely. In a sustained uptrend, Monday's pullback serves as a significant indicator of bullish correction. Key support remains around 4190, a level crucial for future price movements.
If the price continues to consolidate above 4200 in the European session, a long position could be considered. Key resistance remains around Monday's high of 4235; a break above this level could lead to further gains.
In the short term, it's advisable to patiently wait for a pullback before going long. Consider buying around 4190-4195, with a target of 4230-4150 and a stop-loss at 4180. This trading strategy will remain unchanged until the US data release. I will also update the channel with information based on market movements.

Gold Price Technical Chart – Support Zone HighlightedThis chart illustrates recent price movements of gold, along with trendlines and a highlighted support area. The shaded green zone marks a region where the price has previously reacted, suggesting it may be an area of interest for market observers. This is for informational and educational purposes only and does not represent financial advice or guaranteed outcomes.

XAUUSD: Buys (30m)R:R = 1.72:1
30M Resistance broken with decent room til the next ceiling. We’re in buys. This is not financial advice.

CLEAR GOLD SELL SETUPEntry: $4,227.63
Stop Loss: $4,245.58
Take Profit: $4,109.70
📉 Reasoning
Price reacted strongly at the intraday resistance zone around $4,244–$4,246, rejecting liquidity and forming a potential lower high. The risk-to-reward ratio of 1:7.4 shows high payoff potential if the move continues toward the demand area below $4,120.
📊 Risk Management
A tight SL above the liquidity sweep protects the setup. Position size controlled — only 14 lots, keeping exposure in line with account rules.
🎯 Objective
Targeting a deeper correction toward the next major demand zone with clear bearish continuation structure.

The downtrend in gold has become apparent.
news:
December 1st in the US marks the official end of the Federal Reserve's quantitative easing (QT) policy (confirmed at the October 29th meeting). This means:
1️⃣ The end of QT = a systemic halt to liquidity injection, shifting the financial market from a "liquidity contraction mode" to a "stability mode."
2️⃣ Marginal easing of US Treasury supply pressure, reduced risk of rising long-term interest rates, and a potential for the yield curve to flatten again.
3️⃣ The rapid decline in bank reserves has ceased, significantly easing liquidity tensions in the overnight financing and repurchase markets.
4️⃣ The "liquidity discount" in risk asset pricing has begun to diminish, which is conducive to the valuation recovery of such assets.
5️⃣ The cessation of QT does not equate to the resumption of QE, but rather a significant turning point signaling the end of the tightening cycle.
6️⃣ The core of market competition will shift from the "intensity of balance sheet reduction" to "when to cut interest rates and whether to restart balance sheet expansion."
7️⃣ The macroeconomic narrative has shifted from "passively deflating bubbles" to "actively stabilizing the market," confirming the policy bottom.
Technical aspects:
Looking at the 1-hour chart,Gold prices consolidated slightly before declining, accelerating their fall after breaking below the previous night's low of 4220. They reached a low near 4180 before rebounding and consolidating. With the price breaking yesterday's low, the downtrend is likely to continue. Short-term resistance is around 4220, while support lies at the 5-day moving average on the daily chart at 4175, which also represents the retracement level of the 4152-4265 upward move.
Strategy Signals:
Buy: 4215-4220 Stop Loss: 4230 Target: 4190-4170

Report 2/12/25The Federal Reserve’s push toward a December rate cut despite an unusually divided committee, and the way that debate bleeds into the dollar, risk assets and global policy spillovers.
The policy setup is unusually binary. Reporting indicates Chair Powell’s allies have laid the groundwork to deliver a third consecutive cut, moving the target range to roughly 3.50%–3.75%, even at the cost of multiple dissents. The preferred path is “cut-then-hold”: cut once, then use the statement to raise the bar for further easing (a replay of Powell’s 2019 playbook). The alternative is to wait for more labor-market and inflation data in January, but that risks several weeks of public discord with no guarantee of resolution. Markets were pricing the cut above 80% late Monday, after New York Fed President John Williams said there’s “room for a further adjustment in the near term,” and Governor Waller again argued for an imminent move. The split reflects a mix of stubborn ~3% inflation and a cooling, but not collapsing, job market that smells a bit like “mini-stagflation.”
The immediate market reaction has favored “duration-sensitive risk.” Stocks bounced as odds of a December move rose, with tech leading the relief bid; the driver wasn’t fresh data so much as a shift in Fed rhetoric and probabilities. Money-market reference points corroborate easier conditions at the front end: effective fed funds sit near 3.88%, SOFR around 4.12%, and the Treasury bill complex now clears ~3.63%–3.91% across 4–26 weeks. Those levels are consistent with a market already leaning into a down-shift in policy restraint.
The dollar impulse is softer but nuanced. The WSJ Dollar Index is down ~5.8% YTD, with the ICE Dollar Index December future near 99.36. Into a “cut-then-hold,” the messaging matters: if the Fed signals a firm pause after December, the knee-jerk USD selloff should fade; if Powell leans toward an easing cycle, dollar weakness can extend, most visibly against higher-carry and growth-sensitive FX.
The strategic base case is that Powell delivers one cut with tight forward guidance. That path recognizes that earlier tariff-related inflation risks have ebbed at the margin while labor-market downside risks have grown. It also re-establishes consensus by trading one final adjustment today for fewer policy surprises tomorrow. Inside the building, this lowers the temperature without committing to a 2026-style easing cycle. If the committee blinks and waits, expect volatility to build across the dollar and front-end rates for another 4–6 weeks, because the same hawk-dove split will simply roll forward.
On fiscal and political optics, a one-and-done cut helps at the margin by easing Treasury’s near-term bill and note funding costs without stoking the criticism that the Fed is “financing” deficits. It also buys room for the Fed to argue it is not overreacting to every data wiggle. But repeated dissent votes would be politically sensitive and could reopen congressional scrutiny of the Fed’s independence, especially with interest paid on reserves in the spotlight as a perceived “bank subsidy” and with remittances to Treasury volatile around a deferred-asset period. That makes a tightly-messaged, minimal-footprint decision more likely. (The money-rate and remittance dynamics are visible in current policy-rate and SOFR prints; the political scrutiny has recurred whenever IORB outlays are large relative to remittances.)
For Europe, the spillover is double-edged. A softer dollar eases imported inflation for the euro area and the UK, but it also tests ECB communication just as the bloc wrestles with structurally weaker growth and a still-restrictive policy stance (policy rate ~2.15%). If the Fed cuts and the ECB stays put, EUR/USD can grind higher into year-end, but any hawkish Fed framing caps the move. European bank equities would like a steeper curve; a softer USD also tends to support commodities priced in dollars, which complicates the disinflation narrative.
Risks to the base case cluster around three nodes. First, an upside inflation surprise on core services would embarrass a December cut and re-price the entire 2026 curve; that’s why hawks prefer to wait. Second, labor-market fragility is asymmetrically dangerous: if jobless claims or payrolls slip, the committee will wish it had eased earlier, precisely why doves want to move now. Third, communications error risk is high. If Powell fails to clearly separate “insurance cut” from “easing cycle,” equities and high-beta credit could over-extend, forcing a rhetorical counter-swing later.
Here’s how this policy event maps to the assets you care about:
Gold (XAUUSD). A cut lowers real short-rates at the margin and tends to weaken the dollar, both supportive for bullion. Given the Fed’s likely “cut-then-hold,” gold’s impulse is a drift higher rather than a breakout: supportive USD headwinds, but capped by a strong “not a cycle” signal. If the Fed surprises by waiting, gold dips initially on a stronger USD but should stay underpinned by geopolitical tail risk and curve-steepening later in the quarter. The metals complex is already firm (copper futures remain elevated), which is typically consistent with resilient global nominal growth and supportive for precious metals beta.
S&P 500 and Dow Jones. One and done favors long-duration growth (mega-cap tech, secular AI) and quality balance sheets, with domestic cyclicals lagging if guidance is hawkish. The latest tape shows indices grinding higher after a choppy November, and valuation metrics remain rich enough that any whiff of “no more cuts” can spark a rotation into value and dividends. A “wait” outcome would probably take 2%–3% off in the first 24–48 hours, concentrated in high-multiple tech.
USDJPY. The cross is a volatility trap. A Fed cut narrows policy-rate differentials and should, in textbooks, support the yen; but if risk rallies, carry demand can keep USDJPY elevated. Japan’s policy rate sits ~1.875% and 10-year JGB yields are still historically high for this cycle, yet the BoJ’s stance remains looser than the Fed’s, making any USDJPY downside grindy rather than impulsive. Should the Fed wait and sound hawkish, the pair can squeeze higher; watch for MoF jawboning if the move is fast.
DXY / broad USD. The cleanest read. With WSJ Dollar Index down ~5.8% YTD and ICE DXY futures in the high-99s, a “cut-then-hold” extends USD softness modestly against pro-growth FX (AUD, NOK) and EM with credible policy. A surprise hold or a hawkish-cut tone stabilizes and possibly lifts the dollar into year-end.
Crude oil. The macro impulse is small but positive: a softer dollar and a less-restrictive Fed support demand expectations and ease financial-conditions headwinds for energy beta. Absent a fresh supply shock, oil’s near-term path is more dollar-driven than inventory-driven around the meeting. Metals & petroleum futures positioning, as reflected in recent settlements, already implies resilient nominal demand.
What to watch next.:
The market will trade three things on decision day: the size and vote count, the forward-guidance sentence about “further adjustments,” and the press-conference tone. A narrow margin with multiple dissents but hawkish guidance should be risk-neutral. A broader majority and softer language would be risk-positive and USD-negative. If the Fed punts to January, expect a higher dollar, a steeper front-end, and a quick factor-rotation out of high-duration equities. Money-rate prints (fed funds, SOFR, bills) will be the first, clean signal of whether financial conditions are easing as intended.
Actionable framing for you. Into the meeting, the asymmetry looks modestly pro-risk: the committee has already socialized the “cut-then-hold” idea, and front-end rates and the dollar are leaning that way. That supports a bias to buy dips in quality growth and to keep a mild long in gold versus the dollar basket. But respect the communication risk: if Powell over-delivers on hawkish guidance, fade any opening-rally exuberance in high-multiple tech and add back USD on crosses most exposed to carry-unwinds.

What do you think about gold’s movement today?Hello traders!
What do you think about gold’s movement today?
Market Context
This morning, the Fed Chair delivered a speech without mentioning any economic updates. Despite that, gold still showed a corrective move, indicating that the SELL side remains dominant at the moment.
Main Strategy for Today
Prefer SELL setups
Stop selling only if price breaks above 4,246 — a key level defended by sellers.
Consider SELL entries at the previous high 4,265.
Additional SELL reaction zone to watch: 4,227 – 4,225.
BUY on deeper pullbacks
Ideal BUY zone: 4,194 – 4,190
closer BUY zone: 4,209 – 4,206
→ Only BUY if strong support reactions or reversal patterns appear.
Risk Management
Stop Loss (SL): 100 pips
Take Profit (TP): 100 pips
→ Maintain consistent risk throughout the session.
Do you think gold will continue to face bearish pressure and break lower,
or will it bounce from these deeper support zones and regain momentum?

Gold 2/12/25Lets see what will happened little bit week but it re recement near fib levels on 4 hour time frame it will continue rally to 4300 hope so. Sign of strength we can see clearly on longer time frame. I am bullish

Gold: Shorts from 4250 Profit — Beware of Shakeouts TodayOn Monday, gold moved higher within a range. It first surged to 4255 but met resistance and pulled back to find support, then consolidated around 4220 before moving upward again. Later, it was once more pressured downward near 4265. Yesterday, I publicly suggested buying below 4220 and watching the resistance near 4250—selling if the structure turned unfavorable. Today, gold pulled back below 4200. After taking profits perfectly during the drop, we executed a new long entry and captured a small gain.
From a technical perspective, based on the triangle breakout projection, the short-term key support zone defining bullish or bearish strength is 4170–4180. Within this zone, the strategy remains to follow the trend and buy. On a larger scale, gold is trading within the 4380–3890 range, which serves as the trend divider: a breakout above 4380 would restart the bullish trend, while a breakdown below 3890 would confirm a bearish trend.
So far, gold has completed its first test of the 4200 area. The short-term pattern continues to reflect a cycle of pushing higher, pulling back, retesting, and repeated consolidation. This level is likely to see more fluctuations. The key focus is whether the market can reclaim 4236–4245 during the next upward move.
Today’s trading plan:
Sell lightly near 4245 on a rebound; if the price breaks strongly, watch the resistance near 4265.
Buy near 4200 on pullbacks; if support breaks, watch the 4179 zone.
