XAUUSD H4 | Bullish Bounce Off Overlap SupportMomentum: Bullish
Price is currently above the ichimoku cloud.
Buy entry: 4,163.66
- Overlap support
- 38.2% Fib retracement
- 78.6% Fib projection
Stop Loss: 4,111.85
- Overlap support
- 61.8% Fib retracement
Take Profit: 4,219.19
- Swing high resistance
High Risk Investment Warning
Stratos Markets Limited (tradu.com/uk ), Stratos Europe Ltd (tradu.com/eu ):
CFDs are complex instruments and come with a high risk of losing money rapidly due to leverage. 70% of retail investor accounts lose money when trading CFDs with this provider. You should consider whether you understand how CFDs work and whether you can afford to take the high risk of losing your money.
Stratos Global LLC (tradu.com/en ): Losses can exceed deposits.
Please be advised that the information presented on TradingView is provided to Tradu (‘Company’, ‘we’) by a third-party provider (‘TFA Global Pte Ltd’). Please be reminded that you are solely responsible for the trading decisions on your account. Any information and/or content is intended entirely for research, educational and informational purposes only and does not constitute investment or consultation advice or investment strategy. The information is not tailored to the investment needs of any specific person and therefore does not involve a consideration of any of the investment objectives, financial situation or needs of any viewer that may receive it. Past performance is not a reliable indicator of future results. Actual results may differ materially from those anticipated in forward-looking or past performance statements. We assume no liability as to the accuracy or completeness of any of the information and/or content provided herein and the Company cannot be held responsible for any omission, mistake nor for any loss or damage including without limitation to any loss of profit which may arise from reliance on any information supplied by TFA Global Pte Ltd.
Trade ideas

XAUUSD – Strong Intraday Rebound as Price Reclaims Key LevelsGold shows a sharp intraday recovery on both the 15m and 5m charts after reclaiming the $4,200–$4,202 zone, flipping it back into support. Buyers stepped in aggressively, pushing price above short-term EMAs and challenging the 200-EMA on the 15m chart.
🔹 Key Technical Highlights
Strong bullish volume spike confirms a momentum shift.
Price has broken above intraday resistance and is stabilizing above $4,202.
On the 5m chart, price reclaimed VWAP and continues forming higher highs.
As long as Gold stays above $4,198–$4,202, bullish continuation remains favored.
🔸 Levels to Watch
Support: $4,198 / $4,202
Resistance: $4,210 → $4,218
📌 Bias: Bullish Above $4,202
Momentum favors buyers with potential for further upside if the structure holds.

Gold Trade Plan 09/12/2025📌 XAUUSD – Gold Analysis (4H)
Gold is still moving inside a short-term range, with price fluctuating between two key levels:
Resistance: 4,265 – 4,285
Support: 4,155 – 4,175
Price has tested the resistance zone several times, and each time it has reacted with a strong rejection and a sharp decline. This indicates that the resistance area remains highly valid, and a major fundamental catalyst may be needed for a clean breakout to the upside.
At the moment, the market structure is sideways, and entering trades within this zone may carry higher risk.
My main expectation is that once price breaks out of this consolidation box, the next major direction will be clearer.
🔎 Scenarios:
If price breaks above resistance: A bullish continuation toward higher highs becomes possible.
If price breaks below support: A deeper correction and further downside movement are likely.
As long as price remains inside this range, the best approach is to wait for a confirmed breakout from either side.
Regards,
Alireza!

XAUUSDPrice Action Trading is a method of financial market analysis where traders make buying and selling decisions solely based on the asset's price movements over time, without relying on technical indicators.
It's essentially the art of reading a "naked" or clean chart to understand the psychology and behavior of market participants.

GOLD ANALYSIS What’s Moving the Market Today? December 09, 2025FX:XAUUSD GOLD ANALYSIS What’s Moving the Market Today? (December 09, 2025)
Welcome back to Trade with DECRYPTERS, where we decode smart-money footprints into clean, actionable buy & sell zones.
Keep it simple. Trust the levels. Follow the plan.
📰 Market Overview
Gold continues to consolidate near the mid-range after reacting from discount levels early in the week. Price is rotating upward inside the 4180–4210 structure while heading toward premium liquidity pockets. Despite slight USD strength, gold remains supported by dovish Fed expectations, geopolitical uncertainty, and persistent central bank accumulation.
The U.S. Dollar Index remains capped below major resistance, helping gold hold its bullish tone. Treasury yields have stabilized, creating a favorable environment for non yielding assets ahead of the December 9–10 FOMC meeting, where volatility is expected.
Smart money continues its rhythm: accumulate at discount → distribute at premium, keeping the broader trend bullish.
🔍 Key Fundamentals Driving Today’s Move
📈 87–90% probability of a December Fed rate cut
→ Lower interest rates strengthen gold’s macro bullish case.
💵 USD softening after weak labor momentum
→ Supports continued upside rotation.
🌍 Geopolitical tensions (US–China + Middle East)
→ Sustains safe-haven demand.
🏦 China extends its gold-buying streak to 13 months
→ Reinforces structural demand narrative.
📊 Bond market volatility cooling
→ Keeps dips shallow and encourages trend continuation.
Gold’s strength remains driven by macro uncertainty + institutional hedging + global de-dollarization.
📰 Insights From Key Sources
“Markets pricing ~88% probability of a 25bp cut in December.”
“Fed officials hint easing will be gradual through 2026.”
Commentary highlights renewed discussions around U.S. debt-driven gold revaluation risks.
BRICS gold-backed settlement talks gaining real traction.
ETF inflows hit their strongest levels in 18 months.
US–China tariff tensions continue boosting safe-haven flows.
Global miners report supply strain and rising exploration costs.
Narrative remains unified: smart money stays net-long, macro stays supportive, dips remain opportunities.
📆 KEY EVENTS TO WATCH
🔸 JOLTS Job Data (Today — 3:00 PM UK)
Weak data → boosts rate-cut expectations → bullish for gold
Strong data → temporary spikes into sell zones → liquidity grabs likely
🔸 Geopolitical Rotations
🌍 Escalation → spikes toward premium zones
🌤️ Calm → controlled dips into discount levels
Trend holds bullish unless deep structure breaks below the buy zone.
🟩 GOLD TECHNICAL LEVELS
Gold continues to rotate efficiently between Smart Money Sell Zones → Discount Buy Zones, perfectly respecting institutional footprints.
Price is currently positioned inside the mid-range, moving between scalp opportunities and major zones.
🟩 📌 SMART MONEY BUY ORDERS: 4149 – 4163
Primary institutional demand zone deep discount liquidity.
Expect:
✔ Strong first-tap reaction
✔ Accumulation wicks & mitigation plays
✔ Higher-low formation for continuation
Break below 4149 → opens drawdown toward 4125 → 4100 liquidity.
🔺 📌 SMART MONEY SELL AREA: 4235 – 4251
Major premium sell zone — high-probability reversal region.
Expect:
✔ Manipulation above prior highs
✔ Liquidity grabs
✔ Swing short setups
Break & hold above 4251 targets:
➡ 4268 → 4284 → 4308
📌 Conclusion
Gold remains firmly bullish as long as the 4149–4163 demand zone holds, with smart money continuing to accumulate every dip. With JOLTS and FOMC approaching, expect controlled volatility before the real move unfolds. Stay focused on the key zones and let structure guide your execution.
🙌 Support the Analysis
If this breakdown added value to your trading:
👍 Drop a like
💬 Comment your levels
📈 Share your charts with the community
Let’s grow together.
Best Regards,
M. MOIZ KHATTAK | Founder — TRADE WITH DECRYPTERS

XAU/USD Price Outlook – Trade Setup📊 Technical Structure
OANDA:XAUUSD XAU/USD continues to fluctuate around the $4,190–$4,200 zone, holding above the key $4,147–$4,165 support area while repeatedly failing to break above the $4,250–$4,268 resistance zone. Recent price action shows a broad consolidation structure, with the metal rejecting the highs but finding persistent buying interest near support.
The overall structure still leans toward an upward bias inside a wider range. As long as Gold holds above $4,147, the downside remains limited and the market may attempt another move toward the upper boundary. A deeper pullback toward the support zone could offer fresh long opportunities before any retest of the resistance band. A confirmed 1H/4H close below $4,147 would invalidate this bullish scenario and indicate a potential shift in momentum.
🎯 Trade Setup
Bias: Buy on dips near the support zone.
Entry: $4,163 – $4,147
Stop Loss: $4,140
Take Profit 1: $4,250
Take Profit 2: $4,268
R:R Ratio: ~1 : 3.62
As long as price stays above the $4,163–$4,147 area, the bullish dip-buy setup remains valid. A clean 1H/4H close below $4,140 invalidates the idea and suggests reassessment.
🌐 Macro Background (Simplified)
Markets widely expect the Federal Reserve to cut rates by 25 bps this Wednesday, with FedWatch probability near 90%. This normally supports Gold because lower rates reduce the opportunity cost of holding a non-yielding asset.
However, traders are increasingly worried about a “hawkish cut” — the Fed cuts once, but signals fewer or slower cuts ahead through its dot-plot and Powell’s press conference. If this happens, the USD could firm up, limiting upside for Gold in the short term.
Before the Fed meeting, the market will watch the ADP four-week average and the JOLTS Job Openings data. Weak numbers would reinforce the case for continued easing and help Gold stabilise; stronger data may briefly pressure Gold lower. Meanwhile, rising geopolitical tension — especially renewed friction between the US and Ukraine — keeps a layer of safe-haven demand in place, helping to cushion Gold on dips.
🔑 Key Technical Levels
Resistance Zone: $4,250 – $4,268
Support Zone: $4,163 – $4,147
Invalidation Level: $4,140 (1H/4H close below)
📌 Trade Summary
XAU/USD remains range-bound ahead of the Fed meeting, holding above key support and below major resistance. The structure favours buying dips near support for a potential move toward $4,250–$4,268. A confirmed break below $4,140 invalidates the bullish outlook and calls for reassessment.
⚠️ Disclaimer
This analysis is for reference only and does not constitute trading advice. Trading involves significant risk, and proper risk management is essential.

The Real Reason Retail Traders LoseA clean explanation for new traders who want to stop trading noise.
Most beginners don’t fail because “trading is hard.”
They fail because they learn the wrong approach from day one.
This idea shows the exact difference between how beginners analyze charts versus how professionals read the market — using your before/after chart as the visual proof.
## 1. Beginner Charts Are Full of Noise
Look at the left chart.
This is how most beginners trade:
Dozens of trendlines
Patterns inside patterns
RSI, MACD, EMAs
Subjective S/R levels
Arrows predicting future price
No liquidity analysis
No volume logic
No defined invalidation
Beginners draw more than they analyze.
The result?
❌ Conflicting signals
❌ Emotional entries
❌ No understanding of why price should move
❌ Random predictions instead of structured planning
A chart filled with drawings creates a false feeling of analysis — but provides no edge.
## 2. Indicators Don’t Predict Price
Retail traders rely on:
RSI
MACD
Stochastics
EMA crossovers
These indicators offer comfort, but:
They lag
They contradict each other
They ignore liquidity
They cannot explain market context
Indicators summarize the past.
They do not anticipate institutional behavior.
## 3. Signal Providers Don’t Trade Their Own Signals
Most retail signal providers earn from subscriptions, not trading.
This is why:
Their entries are late
There is no SL or risk plan
They hide losses
They copy signals
They rarely show real executions
If someone cannot explain the reasoning behind a trade, they likely didn’t trade it themselves.
Follower count means nothing.
## 4. What Professionals Actually Look At
Now look at the right chart.
A professional chart is clean and focused:
VWAP (fair value)
Anchored Volume Profile
Liquidity zones
Imbalance/efficiency areas
Defined invalidation (SL)
Logical target (TP)
No noise
No predictions — just context
Professionals don’t trade drawings.
They trade volume, value, and liquidity.
Price does not move because of trendlines or patterns.
Price moves because of where liquidity sits.
## 5. Evaluate Any Trader’s Idea Before Following Them
Before trusting a trader or a signal:
Ask:
Do they use volume and liquidity?
Do they define invalidation?
Is their chart clean or full of noise?
Do they explain the trade logic?
Does the idea make sense if you remove the drawings?
You can even paste their idea into ChatGPT to test the logic.
If the idea collapses under simple questioning, it was never a valid setup.
## 6. How to Stop Losing Money
A simple framework that works:
✓ Use VWAP and Volume Profile
Understand where value and liquidity sit.
✓ Keep your chart clean
Noise = bad decisions.
✓ Define SL and TP before entry
Not after.
✓ Avoid prediction arrows
Trade reactions, not guesses.
✓ Ignore follower counts
Marketing ≠ skill.
✓ Skip any trade you don’t understand
Simplicity is strength.
## Final Message
Most beginners lose because they trade what they see on the chart.
Professionals win because they trade what moves the chart:
liquidity, volume, value, and structure.
If you stop chasing noise and start studying how price delivers liquidity, you will already be far ahead of most traders.

XAUUSD looking bearishGold formed a H&S pattern while retesting a resistance area.
It just broke out the neckline of the H&S which confirms the bearish direction.

XAUUSD Technical (Bullish Plan)Price is currently holding within a structured support zone, with the bullish entry range at 4128–4124, where buyers have previously shown strong reaction. As long as this support remains protected, the market maintains a bullish bias toward the target level at 4240, which also aligns with the major resistance zone at 4240. A breakout above this resistance can open the door for further upside, while the broader support at 4000 acts as the key defensive level for the bullish structure. Overall, the chart reflects a clean bullish setup with defined entries, a clear target, and well-structured risk levels—ideal for disciplined and educational trading.

XAU/USD – Major Resistance Test With Potential Bearish ContinuatXAU/USD is approaching a major resistance area near 4260, where price has previously shown strong rejection. The recent rising channels on the chart indicate short-term bullish attempts, but each move has been followed by a corrective decline, showing weakening momentum.
If the market fails to hold above the nearby structure, a move toward the 4167 support zone may develop. A clear break below this level could signal a stronger bearish continuation toward lower liquidity levels.
For now, price remains between resistance pressure above and structural support below, making these two zones important for the next directional move.
Key Levels to Watch:
Resistance: 4260
Support: 4167
Bias: Bearish if support breaks, neutral while price ranges

XAU / USD 1 Hour CHartHello traders. We have Pre NY volume that starts to come in about an hour from this post. Here in the US it starts about 7:20am est. I have marked the chart for my potential scalp buy / sell trade areas. I am not getting caught trading in the zone. Looking for a possible 30 to 50 pips in either direction, but timing is everything. Let's see how the 30 min, hourly and 4 hour candles line up, that will help give more direction. Be well and trade the trend. Shout out to Big G. Happy Monday.

XAU-USD15-minute candlestick
It has a descending trendline that needs to be broken 📣🕯
If that trendline breaks, there's a trading cluster above 4220 that it could hit ✔️
You can place a buy there 🔼🔼


XAUUSD | Gold Signal |Dec 8,2025📌 MARKET ASSESSMENT
1. General Context
Gold continues to fluctuate within the medium-term range on the H1 chart with a slight downward correction structure. The price is currently moving between the upper supply zone and the lower support trendline, indicating that the market is waiting for more momentum to break out.
2. Current Trend
The H1 chart maintains an overall uptrend but is in a correction phase.
The supply and demand zones are clearly formed, creating conditions for trading according to the technical reaction zone.
The uptrend trendline plays an important support role and has not been penetrated yet.
3. Important Observation Zone
H1 Supply Zone (Sell Zone): 4225 – 4230
The position of confluence with the recent peak.
If the price approaches and is rejected, it is likely to fall back to the support zones.
Support Zone/Entry Buy: 4167 – 4175
Confluence between the uptrend line + H1 bottom + demand zone.
This is the zone with a high probability of forming a bullish reaction.
4. Trading Scenario
Scenario 1 – Sell at Supply Zone
Entry: 4225 – 4230
SL: Above 4235
TP:
Target 1: 4200
Target 2: H1 Trendline
Scenario 2 – Buy at Support Zone
Entry: 4167 – 4175
SL: Below 4160
TP:
Target 1: 4198 – 4205
Target 2: 4220
5. Conclusion
Gold is approaching important technical zones and is suitable for trading on price reaction instead of chasing the market. Both scenarios are highly plausible given the H1 structure remains intact. Prioritize waiting for the price to touch the supply and support zones to avoid the risk of fluctuations between zones.

Gold Price Outlook – Trade Setup (XAU/USD)📊 Technical Structure
TVC:GOLD Gold continues to trade steadily above the $4,163–$4,147 support zone, holding within a broader consolidation while respecting the mid-term bullish structure. Price has repeatedly rejected the support band, showing that buyers are still defending the lower boundary. On the topside, the $4,251–$4,268 resistance zone remains the key ceiling—this is where sellers have consistently stepped in.
The current 4H structure shows a potential pullback into support before buyers attempt another run toward the resistance zone. As long as gold holds above $4,163, the bullish bias remains intact. A clean break below this level would flip the structure bearish and expose
deeper downside.
🎯 Trade Setup
Idea: Buy from support, targeting a retest of the resistance zone.
Entry: $4,163 – $4,147
Stop Loss: $4,138
Take Profit 1: $4,251
Take Profit 2: $4,268
Risk–Reward Ratio: ≈ 1 : 3.45
Bias stays bullish as long as price holds above the support zone. A 4H close below $4,138 invalidates this upside scenario.
🌐 Macro Background (Simple Version)
Markets broadly expect the Federal Reserve to cut interest rates this Wednesday, with traders pricing in almost a 90% probability of a 25 bps cut. Lower interest rates reduce the opportunity cost of holding gold, so rate-cut expectations naturally support the metal.
At the same time, China continues increasing its gold reserves, marking a 13-month buying streak. This steady central-bank demand adds an extra layer of support beneath gold prices.
U.S. data, such as the stronger-than-expected University of Michigan Consumer Sentiment Index (53.3), briefly lifted the USD, but not enough to offset the broader rate-cut narrative. Overall, the macro tone remains mildly supportive for gold as long as markets believe the Fed will ease policy this week.
🔑 Key Technical Levels
Resistance Zone: $4,251 – $4,268
Support Zone: $4,163 – $4,147
📌 Trade Summary
Gold holds steady above key support as markets wait for the Fed’s decision. With rate-cut expectations high and China continuing to buy gold, dips into support remain attractive for buyers targeting the $4,250–$4,270 zone. The setup stays constructive unless price closes below $4,138.
⚠️ Disclaimer
This analysis is for reference only and does not constitute trading advice. Trading involves significant

$ell XAUUSD*I am in no way a financial advisor and you should always do your own due diligence before placing any trade. Do not trade what you are not comfortable with losing. No trade is guaranteed.
Price weakening on the buy, triple top , price falling, let’s ride the wave.
Conservative tight stop loss for small accounts: 4216
Large stop loss for large accounts: 4236
Take profit: 4005

Dec 8, 2025 - XAUUSD GOLD Analysis and Potential Opportunity📊 Summary:
The 4260 resistance proved strong, and the daily close fell back below 4200. This pullback appears to be driven by profit-taking.
If price trades above 4200, bulls still have strength.
But if price breaks below 4192, bearish momentum will increase significantly.
🔍 Key Levels to Watch:
• 4260–4265 – Resistance zone
• 4241 – Resistance
• 4230 – Resistance
• 4220 – Resistance
• 4205 – Resistance
• 4192 – Intraday key support
• 4182 – Support
• 4174 – Support
• 4164 – Support
• 4154 – Support
📈 Intraday Strategy:
SELL: If price breaks below 4192 → target 4286, with further downside toward 4182, 4179, 4174
BUY: If price holds above 4208 → target 4211, with further upside toward 4215, 4220, 4224

XAUUSD_Trend-Based Entry ZoneClear buy reaction zones based on the current trend, with defined stop and target levels.

$XAUUSD FORCAST BULLISH ANALYSIS ( READ CAPTION )hi traders! today 07 DECEMBER 2k25 here is my today XAUUSD analysis please read it and send me your ideas in comment section for more analysis.
OANDA:XAUUSD pivot point is 4199, XAUUSD long channel support holding buyers target 4300.
structured bullish progression after a period of heavy distribution inside the supply zone. Earlier, gold established wide range between the supply and demand areas, with multiple sharp rejection, forming the top of the structure. eventually, sellers pushed the price lowers initiating a corrective declined that developed into a well-defined Triangle Pattern, market by a descending Triangle demand line. This compression ended with a clean breakout to the upside, signaling the beginning of a new bullish phase. Following the breakout, XAUUSD formed a Pivot point near the mind-range level, where price briefly rejected before continuing its upward trajectory. Another notable phase was the formation of an inverse Head-and-Shoulders structure conforming buyers strength after a fake breakout below the neckline this reversal pattern provided the foundation for current bullish continuation.
Please dont forget like and comment for latest XAUUSD updates
This analysis for informational purposes only. Trade is own your risk.

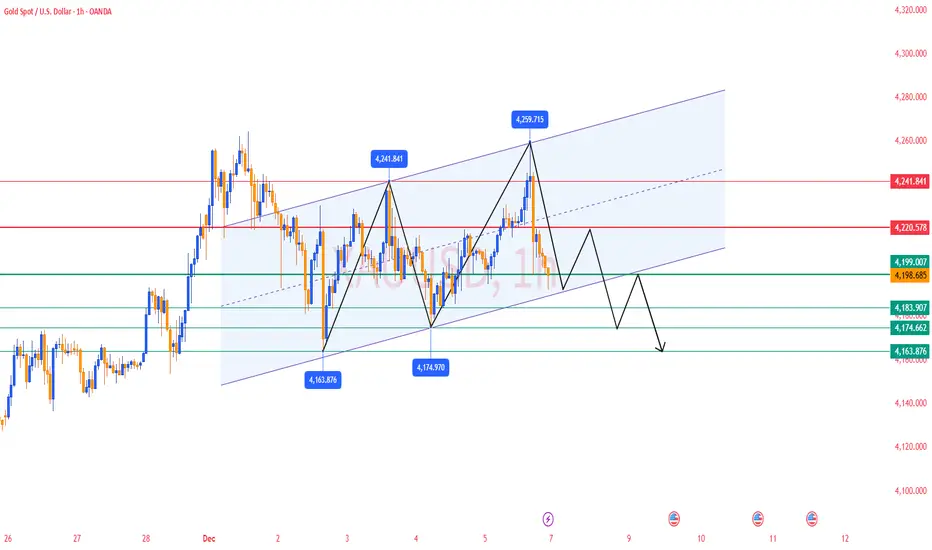
Gold Analysis & Trading Strategy | Next Week Preview✅ Gold fluctuated within a $100 wide range this week, with repeated whipsaws, and finally closed with a doji, indicating ongoing tug-of-war between bulls and bears.
Looking ahead to next week, range trading is expected to continue, and the downward adjustment window may open around mid-December.
→ The primary strategy remains selling the rallies (shorting at highs).
✅ Daily Chart (D1) Trend Analysis
On Friday, gold showed intraday upward movement
Topped near 4259 and then pulled back to the starting point
Daily candle closed as another doji
➡️ Lack of bullish continuation → Upward momentum is still weak
✅ 1-Hour Chart (H1) Structure
Moving averages are crossing back and forth
→ No one-sided momentum, price remains range-bound
Upside still capped below 4265
Support remains focused around 4160
📍 If price pulls back to 4160 and holds → Short-term buying opportunity
📍 If 4160 breaks → Gold may open further downside potential
🔴Resistance Levels
4220–4230 → Short-term rejection zone
🟢Support Levels
4174–4170 → Key support area
4160–4165 → Bull/Bear boundary
✅ Trading Strategy Suggestion
Short-term Focus: Sell the highs as the main strategy, buy the dips as secondary
🔰Look for light short entries around 4220–4230
🔰Look for light long opportunities only if 4160–4165 holds well
⚠️ Risk Reminder
Market remains in a washout consolidation phase
Rapid shifts in sentiment may occur
✔ Use light position sizing
✔ Apply strict stop-loss
✔ Adjust based on real-time price action
Gold risky scalpVery risky scalp am holding. Gold is bullish overall. Counter trend trade.
You can join me if you can. Risk little and manage trade well. Breakeven at 1:3RR

Gold Out Look For Week of 12/7 - 12/13/25Gold Closed Bearish Daily Time Frame Friday 12/5/25
Gold Broke Through 3 Key Lvls and is Now Below 4200
I Think Based On PA Price might want to play out 4200 as S. T. R.
Support Turned Resistance
Maybe Come Back and Setup Buys at 4185 support zone or at 4175 qrt. key lvl

Gold Weekly Summary and Forecast 12/6/2025Gold has closed with another 2W candle with a bullish green bar. I am still expecting it to rise for the next two weeks. Buying is still my main strategy.
For next week, I will expect price to test 4152 and rise from there. Ultimate target will be 4400.
