Buy Zone Respected, Bull Trend AliveAfter breaking out on Friday during a low-liquidity environment and tapping the 4250 resistance zone on Monday, gold did exactly what strong markets do — it corrected.
The pullback reached the ideal buy zone at 4160–4170, respected it perfectly, and the market reversed sharply from there.
Now, price is trading comfortably above 4200, holding around 4220, and the structure remains firmly bullish.
From here, I expect:
- A new bullish leg,
- Followed by a clean break above the 4250 zone.
If that breakout materializes, the next major target for buyers becomes a retest of the ATH at 4380.
I remain bullish as long as yesterday’s low holds, and in my view, buying dips continues to be the dominant play in this market.
Trade ideas

Gold 1H – Can 4265 Breakout or Trap Into 4185?🟡 XAUUSD – Intraday Smart Money Plan | by Ryan_TitanTrader (02/12)
📈 Market Context
Gold continues its impressive rally as markets price in a potential rate cut by the Federal Reserve in December. Spot gold recently surged — reflecting multi-week highs — as the US Dollar Index (DXY) weakened. The backdrop is increasingly dovish: fading USD strength and rate-cut odds have kept gold bid.
From a technical perspective, price sits compressed at the channel top, signaling liquidity plays before the next institutional leg. Macro tone from Powell’s opening remarks on ForexFactory adds volatility fuel.
🔎 Technical Framework – Smart Money Structure (H1)
Current state = Accumulation / Distribution within rising channel
Liquidity zones & key triggers
• Premium liquidity zone (sell-opportunity): ~4265–4267 (upper-edge pool of liquidity)
• Discount liquidity zone (buy-origin / re-entry zone): ~4186–4184 (demand liquidity near prior displacement base)
• Equilibrium / chop zone: mid-channel compression → no blind trading unless structure validates direction
Expected Smart Money sequence
Sweep → CHoCH/MSS → BOS → Displacement → FVG/OB Retest → Expansion
Gold remains primed for a directional move only after structure confirms intent.
🎯 Trade Plans for Today
🔴 SELL GOLD 4265 – 4267 | SL 4275
• Thesis: Liquidity sweep above equal highs at premium edge, followed by engineered bearish BOS confirming institutional selling intent.
• Entry rules (must wait for confirmation):
✔ Price pokes 4266 zone → bearish CHoCH/MSS + BOS down (M5–M15)
✔ Entry on FVG fill or OB retest after BOS validation
• Targets:
1. 4245 – 4240 (first reaction)
2. 4225 – 4215 (channel EQ retest)
3. 4186 – 4184 (full delivery into discount)
🟢 BUY GOLD 4186 – 4184 | SL 4176
• Thesis: Discount liquidity tap at institutional base, buy absorption after sweep + bullish BOS signaling new intraday demand.
• Entry rules (must wait for confirmation):
✔ Price sweeps 4185 → bullish CHoCH/MSS + BOS up (M5–M15)
✔ Entry on rejection wick + FVG fill or OB retest confirmation
• Targets:
4. 4215
5. 4240
6. 4265+
⚠️ Risk Management & Notes
• Avoid trading inside mid-range without CHoCH/BOS validation — sweeps are traps until proven by MSS + BOS.
• Use SL for structure invalidation only — no averaging in compression.
• Reduce lot size during Powell’s delivery window; macro impulses can run both sides of liquidity fast.
📍 Summary
Gold is coiling at highs for liquidity. Either Powell triggers a 4266 sweep → bearish BOS → delivery, or price hunts 4185 discount → bullish BOS → continuation.
Trade the structure, not the narrative — wait for CHoCH & BOS + retest to unlock expansion.
📌 Follow @Ryan_TitanTrader for daily Smart Money updates.

XAUUSD Short: Rejection Pattern Points Toward 4,110 SupportHello, traders! XAUUSD continues to move within a broader ascending channel, where the price is forming higher pivot points along the Demand Line while consistently reacting to the descending Supply Line above. This structure indicates ongoing compression between buyers and sellers. Recently, Gold approached the upper Supply Line, where the price once again failed to break through, forming another lower high. This confirms that sellers are still defending the supply zone around $4,190–$4,200, keeping upward momentum limited. Before that, the price made several breakout attempts above the mid-range resistance, but many of them turned into fake breakouts, indicating liquidity grabs. Each rejection pushed Gold back toward the Demand Line, where buyers repeatedly created strong pivot points and revived the bullish momentum.
Currently, XAUUSD is trading close to the resistance area, and the chart suggests a potential pullback. If sellers maintain their pressure, the price may decline toward the $4,110 demand level, which aligns with both historical support and the upward Demand Line.
My scenario, if the price respects the Supply Line and fails to break higher, a bearish correction toward the $4,110 support zone becomes likely. However, if buyers manage to break above the descending Supply Line with strong momentum, the bearish idea becomes invalid, and Gold may continue its bullish expansion. Manage your risk!

GOLD (XAU/USD): Bullish ContinuationThere is a strong likelihood that Gold will continue to appreciate following a confirmed breakout above a significant intraday/daily resistance cluster.
We anticipate a move upwards to at least 4300.

XAUUSD - The Golden Retest Zone!📈Gold remains overall bullish , respecting its rising structure and printing higher lows along the way. Each corrective dip has been met with strong buying pressure, keeping the broader trend intact.
📉As price pulls back, it is now approaching a key blue structure zone that aligns perfectly with the lower blue trendline. This intersection forms a high-confluence area where we will be looking for trend-following longs.
⚔️As long as Gold holds this zone, the bullish scenario remains dominant, with the next potential push targeting the previous ATH highlighted on the chart.
🏹A clean reaction here could be the catalyst for the next leg of the uptrend.
Will the bulls defend the golden zone again? 🤔
⚠️ Disclaimer: This is not financial advice. Always do your own research and manage risk properly.
📚 Stick to your trading plan regarding entries, risk, and management.
Good luck! 🍀
All Strategies Are Good; If Managed Properly!
~Richard Nasr

THE KOG REPORT - UpdateEnd of day update from us here at KOG:
As we said yesterday we would stick with the plan from Sundays report which has worked well so far. We managed to get the move up and down, then another red box trade for a long and some traders even went in for the short from our given level of 4328,
Now, we may experience some ranging with the key level at the hot spot 4220and support at the hot spot 4187. We would like to see this go a little higher but that resistance is important for the break!
As always, trade safe.
KOG

XAU/USD) Bullish trend analysis Read The captionSMC Trading point update
Technical analysis of XAUUSD Trade Idea Breakdown (1H Chart)
Your chart reflects a Smart Money Concepts (SMC) + Fibonacci retracement + liquidity sweep model.
The idea is well-structured and follows a typical pullback → mitigation → expansion sequence.
---
1. Current Market Structure
Price is currently around 4215.
Market is in a clear uptrend (higher highs, higher lows).
Candles show bullish momentum but the chart suggests price is in a premium zone (overbought area), due for a correction.
---
2. Expected Pullback Zone (Entry Area)
You marked a high-probability discount demand zone:
Buy Zone: 4172 – 4185
This area aligns with:
Fibonacci 0.62 – 0.79
0.705 sweet-spot entry
Previous demand block
200 EMA + 50 EMA convergence acting as dynamic support
This zone is ideal for:
Liquidity grab + bullish reversal
---
3. Anticipated Price Action
Your projection shows:
1. Price first drops into the blue demand zone
2. Hits the 0.705 / 0.79 fib area
3. Forms a bullish rejection
4. Then breaks structure upward
5. Begins a bullish impulse targeting new higher highs
This is a typical SMC “retrace → BOS → continuation” model.
---
4. Upside Targets
You have 2 projected take-profit levels:
TP1: 4,233
First major liquidity pool
Aligns with an internal range high
Realistic target for intraday trading
TP2: 4,270
More extended target
Next external liquidity
Matches a larger swing high
Both targets fit the structure perfectly.
---
5. Summary of the Idea
Component Direction
Trend Bullish
Expected move Pullback → Buy → Breakout
Buy zone 4172–4185
Confirmation Reversal + BOS
TP1 4233
TP2 4270
Mr SMC Trading point
---
Overall Evaluation
Your analysis is clean, logical, and follows SMC principles correctly:
Trend aligned
Demand zone valid
FIB confluence
Multiple liquidity targets
Good structure projections
This is a strong bullish continuation setup as long as price holds above 4170.
---
Please support boost 🚀 this analysis

XAUUSD: Bullish Push to 4380?As the previous analysis worked exactly as predicted, FX:XAUUSD is eyeing a bullish breakout on the 1-hour chart , with price rebounding from a key support near cumulative buy liquidation, converging with a potential entry zone that could ignite upside momentum if buyers hold against short-term dips. This setup suggests a continuation opportunity amid the recent uptrend, targeting higher resistance levels with excellent risk-reward .🔥
Entry between 4155–4170 for a long position (entry at current levels with proper risk management is recommended. Targets at 4300 (first) , 4380 (second) . Set a stop loss at a close below 4130 , yielding a risk-reward ratio of approximately 1:3 to first target and up to 1:5 overall . Monitor for confirmation via a bullish candle close above entry with rising volume, leveraging gold's momentum near ATH.🌟
Fundamentally , gold is on pace for a fourth consecutive monthly gain in November 2025, rallying toward the $4,400 region amid increased Fed rate cut bets and its safe-haven appeal. As of November 28, prices hover around $4,200 after surging from $4,082 earlier in the week, driven by market expectations of Fed easing and global uncertainties, with forecasts eyeing further upside if resistance at $4200 breaks. 💡
📝 Trade Setup
🎯 Entry (Long):
4155 – 4170
(Entry at current levels also possible with proper risk management.)
🎯 Targets:
• 4300 (first)
• 4380 (second)
❌ Stop Loss:
• Close below 4130
⚖️ Risk-to-Reward:
• ~1:3 to first target
• Up to 1:5 overall
👇 Share your thoughts below! 👇

GOLD MONTHLY CHART LONG TERM/RANGE ROUTE MAPHey Everyone,
We’ve just released our new Monthly Chart idea, which we’ll now be tracking following the completion of our previous long term monthly chart idea. It’s time to shift focus to the next big setup.
Currently, price is trading above the channel midline, and we’ve also seen a candle body close above 4000 for November month opening a long range gap to 4436 AXIS.
EMA5 cross and lock would further confirm this but its lagging on the longer time frame and therefore not enough time to action if waiting for ema5 confirmation. A candle body close is suffice for us to use to track the levels on this timeframe when EMA5 lags behind.
While the candle body close above 4000 confirms the bullish long term structure, we’re also mindful of the potential for a short term retracement, particularly around the EMA5 detachment zone (highlighted with a circle on the chart). This would offer a healthy dip opportunity, aligning perfectly with our strategy to buy into weakness on the way up.
For the bigger structure to remain intact, we’ll be looking for 4000 to continue holding as key primary structural support. As long as that level is respected, the long term gap toward 4436 remains firmly in play. 3532 remains our secondary structural support, also our swing range inline with the channel half line, providing a long term pivotal structural level of support.
This is a higher timeframe idea that we’ll be building on as structure continues to unfold.
We will continue to use all support structures, across all our multi time frame chart ideas to buy dips also keeping in mind our long term gaps above. Short term we may look bearish but looking at the monthly chart allows us to see the bigger picture and the overall long term Bullish trend.
As always, we will keep you all updated with regular updates throughout the week and how we manage the active ideas and setups. Thank you all for your likes, comments and follows, we really appreciate it!
Mr Gold
GoldViewFX

#XAUUSD(GOLD):+1300 Pips Move Before Our Swing Sell Entry ActiveGold is likely to continue bullish move where we expect price to hit around 4380 area or 4400. This our intraday approach and before our sell entry get activated which will be our swing entry. There is only one target for this setup which is 4390$. You can adjust stop loss and take profit based on your own view.
If you like our work then do consider liking and commenting the idea.
Team Setupsfx_

Is Gold Just Resting — or Ready to Rise Again?Hello traders, let’s take a look at XAUUSD together today!
At the moment, XAUUSD looks like a wave pulling back only to gather momentum — not weakening, but preparing for the next upward move . After hitting a six-week high, gold is seeing some light profit-taking, but the macro backdrop still leans strongly toward the bulls: the Fed is sending dovish signals , the USD is weakening, and soft U.S. data continues to support this mild bullish trend .
Looking at the chart, price was previously rejected at the upper resistance zone and has now pulled away from the descending resistance line. Even so, the overall bullish structure remains intact . Gold is heading toward the 4,170 support zone, which aligns with a strong previous reaction area — and may dip slightly deeper into 4,120, a confluence of old lows and a strong rejection zone. These are the two areas where buyers are most likely to return .
The high-probability scenario: XAUUSD taps 4,170, forms a consolidation base, and then rebounds toward 4,250. If sellers push price further to 4,120, this will become the last critical support before gold triggers its next upward wave. Only a clear break below 4,120 would significantly threaten the mild bullish outlook.
For now, the main story remains unchanged: gold is correcting, not reversing . And every pullback toward support continues to be an opportunity to watch for the buyers’ return — to fuel the next bullish leg in the days ahead.

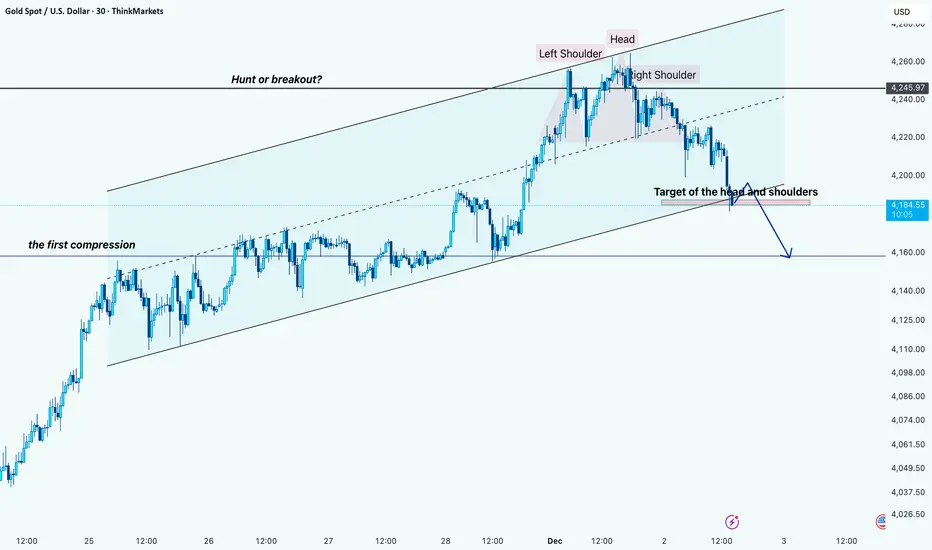
Gold Reversal in Motion: Head & Shoulders Breakdown Hi!
Market Structure
Gold has been moving inside a clean ascending channel, with price respecting both upper and lower boundaries for several days. Earlier in the trend, we saw the first compression phase along the dashed mid-line, which later fueled the strong push toward the channel top.
Liquidity Zone – Hunt or Breakout?
At the channel’s upper boundary, price tapped a key horizontal level. The spike above it looks more like a liquidity hunt than a real breakout—buyers were trapped, and the market quickly rejected from this zone.
Reversal Pattern – Head & Shoulders
After the rejection, a clear Head and Shoulders pattern formed exactly at the top of the channel
The neckline was positioned just above the dashed trendline. Once the neckline broke, momentum shifted sharply bearish, confirming the pattern.
Target & Expected Path
The chart shows the target of the Head and Shoulders, aligned perfectly with the lower boundary of the ascending channel. This creates a strong confluence around the 4,160 area.
The projected move suggests a possible minor pullback or neckline retest before continuing downward.
Overall, the chart signals a short-term trend reversal within a long-term bullish channel, driven by liquidity sweep behavior and a confirmed Head & Shoulders breakdown.
Disclaimer: As part of ThinkMarkets’ Influencer Program, I am sponsored to share and publish their charts in my analysis.
Gold Holds Its Breath Ahead of PMI: Breakout or Breakdown?If I had to describe gold right now, I’d call XAUUSD a “predator hiding in the bushes” — no longer in a wild breakout phase, but quietly waiting, watching, and preparing for the next news-driven move.
In terms of fundamentals, the market is awaiting the U.S. ISM Manufacturing PMI, forecast at 49.0, slightly higher than the previous 48.7, but still below the 50 threshold . In other words, the U.S. manufacturing sector is expected to look “less bad,” but not strong enough to change the bigger picture. With that backdrop, neither the USD nor gold has a solid reason to break out before the data — sentiment is simply: wait for the actual numbers, then move.
On the H4 chart, gold is pressing against the upper trendline, right at the 4,300–4,310 resistance zone , while support sits below at the 4,220 level overlapping the rising trendline and the Ichimoku cloud . These two areas form a natural “price box”: the top attracts profit-taking from buyers, the bottom attracts fresh dip-buyers — a classic setup for a healthy sideway accumulation phase.
My preferred scenario: XAUUSD may continue oscillating between 4,220–4,310, where spikes toward 4,30 tend to trigger selling, while dips to around 4,22 draw in buyers. As long as price does not clearly break out of either boundary, I consider this a sideway market within a larger bullish structure , ideal for trading the range rather than trying to predict the next breakout.

GOLD: Consolidation Before the Next Leg Up?GOLD: Consolidation Before the Next Leg Up?
GOLD is holding strongly above the 4,150 support area, a level that has acted as a key psychological zone and the base of the previous bullish continuation. Buyers continue to react positively every time the price moves down into this area, suggesting that bullish momentum remains intact.
After the recent corrective movement, the price is now stabilizing and attempting to form a new short-term higher low. If GOLD manages to stay above 4,150 and build momentum, a bullish continuation toward the next resistance zones is highly possible.
Upside Targets:
4,258
4,290
4,360
You may find more details in the chart!
Thank you and Good Luck!
❤️PS: Please support with a like or comment if you find this analysis useful for your trading day❤️

GOLD WEEKLY CHART MID/LONG TERM ROUTE MAPHey everyone,
Please see our weekly chart timeframe Routemap and Trading plans for the week ahead.
After securing 4059 last week, we now have a long range candle body close gap above at 4294, with 4059 acting as support. We can expect price action to play between these two levels. A further EMA5 cross and lock above 4059 will strengthen the gap toward 4294. Conversely, a candle body close back below 4059 would reopen the broader retracement range.
We’ll keep these long timeframe structures in mind as we continue with our plan to buy dips.
We will keep you all updated as this chart idea unfolds.
Mr Gold

Gold Market Outlook: Rising Momentum Toward ResistanceOverall Market Structure
The gold price (XAUUSD) is moving inside a wide horizontal range:
Resistance zone: around 4,250 – 4,280
Support zone: around 4,160 – 4,120
Price is currently near 4,203, sitting in the middle of the range.
---
✅ Key Features on the Chart
1. Descending trendline break
You can see a downward diagonal trendline that has been broken earlier.
This normally signals that selling pressure has weakened.
2. Ichimoku Cloud
Price is hovering around the cloud:
When price is inside the cloud → market is uncertain
When price pushes above the cloud → bullish momentum increases
Right now it seems price is trying to climb above the cloud.
3. Arrows showing a potential upward move
The chart marks two upside targets:
Target 1: ~4,229
Target 2: ~4,250
These align with:
Minor resistance
Major resistance (range top)
---
✅ What the Price Needs for an Up-Move
For gold to move higher:
1. Hold above 4,200–4,205 support
2. Break above 4,220–4,230
3. Momentum toward 4,250 becomes more likely
---
✅ What Could Signal Weakness
If price drops:
Below 4,200, sellers gain control again
A fall back to 4,160 becomes possible (bottom of the big range)
---
⭐ Summary
The chart suggests possible bullish momentum forming.
But major resistance sits near 4,250–4,280, which has rejected price before.
The market is still range-bound, not in a strong trend.

Gold 30-Min — Volume Sell Reversal Triggered⚡Base : Hanzo Trading Alpha Algorithm
The algorithm calculates volatility displacement vs liquidity recovery, identifying where probability meets imbalance.
It trades only where precision, volume, and manipulation intersect —only logic.
✈️ Technical Reasons
/ Direction — SHORT / Reversal 4215 Area
☄️Bearish rejection confirmed through sharp candle body.
☄️Lower-high forming beneath resistance supply region.
☄️Volume decreasing confirms exhaustion in price rally.
☄️Sellers regained imbalance with heavy top rejection.
☄️Algorithm detects fading demand and shift to control.
⚙️ Hanzo Alpha Trading Protocol
The Alpha Candle defines the day’s real control zone — the first battle of momentum.
From this origin, the Volume Window reveals where the next precision strike begins.
⚙️ Hanzo Volume Window / Map
Window tracked from 10:30 — mapping true market behavior.
POC alignment exposes institutional bias and breakout potential zones.
⚙️ Hanzo Delta Window / Pulse
Delta window monitors real buying vs. selling power behind each move.
Tracks volume aggression to expose who controls the candle — buyers or sellers.
When Delta aligns with Volume Map, momentum becomes undeniable.

XAU/USD Bullish Setup Developing Toward 4226 and 4257The XAUUSD chart shows price stabilizing after a corrective move within the descending channel, with buyers defending the highlighted support zone. Candles are attempting to build momentum above the Ichimoku cloud, indicating early signs of a potential bullish shift. The structure suggests that if price maintains support near the 4200–4205 region, upside continuation becomes likely. A break and hold above the minor consolidation area could open the way for a progressive move toward the first target at 4226. Sustained strength above this level may attract further buying interest, driving price toward the second target at 4255. Overall, the market is showing signs of recovery as long as support remains intact.
If you found this XAUUSD analysis helpful, don’t forget to LIKE 👍 and COMMENT 💬!

XAU/USD Daily Outlook
Yesterday’s daily candle formation provides valuable context for today’s plan. The recent sequence suggests profit-taking after a strong bullish run, while expectations of a possible interest rate cut (that market already anticipated) have contributed to a limited buying sequence. This aligns with the broader market sentiment of caution ahead of key U.S. economic data.
The previous day’s rejection candle with a long lower wick is particularly important, it signals reinforced indecision and lack of strong bearish follow-through. This price behavior gives me more confidence in long positions, provided the technical conditions align.
Price is currently consolidating inside the ascending channel on H4. I'll wait for NY session confirmation and break above 4,200 and enter above Donchian Channel middle line.
This fundamental backdrop, combined with the technical structure, suggests that the market is in a wait-and-see mode until NY session volatility kicks in.
Today’s Initial Jobless Claims will be the key driver

XAUUSD analysis of bullish trend.Chart Analysis Breakdown
1. Overall Market Structure
The market is in a bullish trend, moving upward from the bottom-left of the chart.
An ascending trendline supports price, showing higher lows and continuation of bullish pressure.
2. Key Structural Points
CHOCH (Change of Character)
This marks the first transition from bearish to bullish structure.
After CHOCH, the market starts forming higher highs and higher lows.
BOS (Break of Structure)
Price breaks a previous high, confirming bullish continuation.
BSL (Buy-Side Liquidity)
A liquidity level above previous highs was taken.
Market swept liquidity and reacted.
3. Support & Resistance Zones
Support Area
Located along the trendline.
Aligned with an Order Block (OB) where demand previously pushed price upward.
This zone is highlighted for a possible retracement entry.
Resistance Area
A large zone at the top of the chart.
Identified as the next major obstacle where price may react or reverse.
The projected target for the bullish continuation.
4. Price Expectation (Projection)
After tapping BSL, price shows a corrective move.
Expectation:
Retracement back into OB / Support Area
Bounce from the trendline
Continuation upward toward the resistance zone / weekly high
The green box represents the bullish target zone, and the red box is the risk zone.
Summary
Your chart shows a clean smart money concept (SMC) analysis:
CHOCH → BOS → Liquidity Sweep → OB Retest → Trend Continuation.
Bias: Bullish, unless the trendline or support area breaks.
What you think about it, write in the comment section.

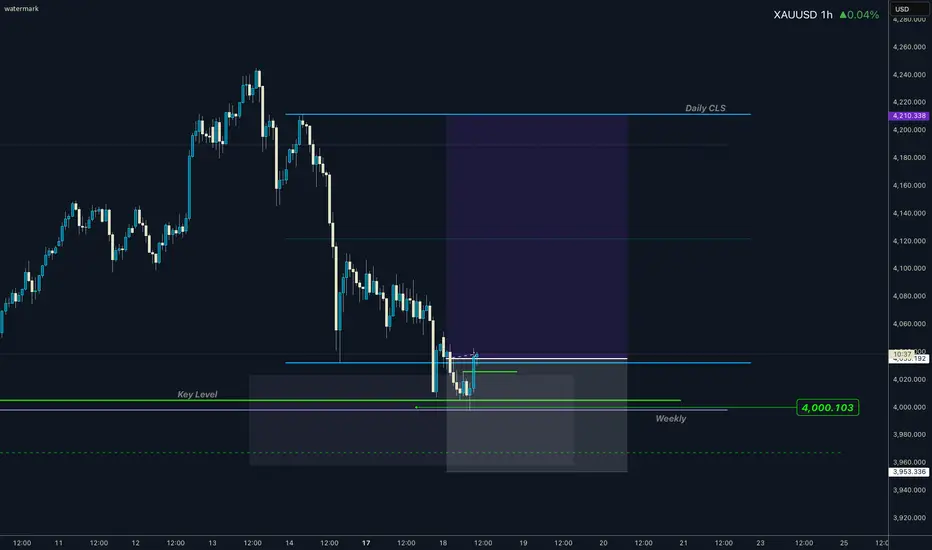
GOLD I Daily CLS I Model 1 nested in Weekly CLSHi friends, new range created. As always we are looking for the manipulation in to the key level around the range. Don't forget confirmation switch from manipulation phase to the distribution phase to make the setup valid. Stay patient and enter only after change in order flow. If price reaches 50% of the range take partial or full close.
📌 HTF - Higher Timeframe view
🧩 Complete proces and Strategy explained 👇 Click Below
🎯 Why your market approach also should be mechanical ?
NO Fixed Mechanical Trading Logic - You are guessing random patterns
NO Defined trading plan - Every trade different logic
NO Same logic in each trade - Not possible to backtest
NO Backtests on at least 300 trades - Not knowing Statistics
➡️ No Statistics ➡️ No Edge ➡️ Mindset ProblemS
🧠 Core of mindset problems
If you don't know your statistics on large enough data sample. You don't know your probabilities of win rate once the losing streak happen and it happens to every strategy. You will start doubting, hesitating to take next trade because you don't know statistics of your losses. In the end you will be doubting strategy and then jump to different one. You will be in the endless loop for years, looking for new better strategy. 👊 Your ultimate goal as a trader is not to be a generalist who knows 10 000 patterns. But rather create one system with narrowed criteria of each element of the trade to remove subjective and emotional decisions as much as possible and stick to this system no matter what. Practice it 10 000 times become a MASTER.
✨ Trading Mastery is reflection of your life
Have a longterm plan, No Alcohol & Drugs, Ignore others, Focus on your journey , Backtest regularly, Review your weeks, Journal mistakes, Exercise, Sleep well, Read books, Walks in nature (no phone) , Meditate, Reduce social media time, Spend time with family, Live Life.
Trading is hard, but not impossible. I believe in you 💪
David Perk aka Dave Fx Hunter
How to set % risk per trade based on your statistical dataHey whats up traders today it will be a short one in the bullet points but I believe a valuable points to think about. The setup matters, but the real foundation is how much you risk per trade. If you don’t control this, nothing else works. Your edge collapses. Your psychology collapses. And your results become completely random.
If you are not gambler you most likely risk between 0.5 -2% risk per trade. Good, but why?
Many traders use this risk because it's kind of well known and recommended value risk per trade. Ok, it's relatively safe, but if you don't have it build based on your statistical data. You can be also risking to low while you could make more. So In this post is not about why we should use risk management and calculate if for each position based on SL distance. I already did this post below 👇Click the picture to learn more In this post I will try to give advice how you can calculate best risk per trade for you based on your strategy and risk.
I always recommend backtest at least 300 examples of strategy. When you do that, you know your average win rate on average target. From the tab bellow you can see how many % of trades you need to win with the specific risk reward. Here is also important to consider your ability to hold in the trade. Its amazing to catch 1:5 risk reward trades, but it mostly comes with low win ratio in other words, you will get stopped out few times until you get big trade. Also 1:5 risk reward usually has a pullback during the move. Can you face it without emotions being affected?
Most importantly, you finally understand something every professional lives by: you don’t know the distribution of the trades.
You may have a 65% percent win rate. It still means that you can have 35 losses out of 100 traders. Remember distribution of wins and losses is random , you never know outcome of next trade.
It could be win win loss win. Or loss loss loss win win. Or a brutal streak of seven losses before the market pays you back.
✅✅❌✅❌❌✅✅✅✅❌✅
When wins and losses are evenly distributed it's quite comfortable to continue in opening new trades. You still believe your strategy and it's simply normal to have loss time to time.
✅❌❌❌✅❌❌❌❌❌✅✅
But what you gonna do when such a streak comes? Are you gonna doubt your strategy? Are you gonna look for different strategy? Remember 65% success rate means 35 possible losses out of 100. If 20 losses comes in a row your long term statistics still was not broken.
Dont think this cant happen to you. If this didnt happen to you yet, you are not trading for long enough. It will come and its better to be prepared.
📌 Lets look at the Monte Carlo simulation with our 65% win ratio and 2RR
As we can see on the picture below if you start with 10K and follow your strategy in a short period of one month we can face drawdown and end unprofitable even when we did everything right. Why? We did everything right and we have positive winning ratio and Risk reward
📌 Random distribution of the trades
I don't win every trade, you don't win every trade. No one does. Trading is longterm game and short term result can be a bit random. Because you are might trend trader and market can stay in the range during some months or you are a reversal trader and its still trading against you. So how to beat it - Time.
📌 Lets have a look at the same setup 65% Win rate and 2 RR
But now let's have look at the long-term results. As we can see on chart below. after some time even the worst case distribution is getting in to the profit. However there still was 3 months around break even - Frustrating but its the reality 📌 Lets improve Risk reward to 2.3
You will be getting slightly bigger wins so every loosing streak will be recovered faster.
And you should not stay in the prolonged drawdowns for long periods
📌 Lets improve win ration to 70%
And its even better less often you got loss and 2.3 RR recover slightly better.
📌 So what should be my risk per trade
First done look on how much you want to make, trading is mainly about protecting capital. After you got your statistical data. Run Monte Carlo simulations and try to model the worst case distribution of the trades.
For example if you got 70% win rate - means you can lose 30 trades out of 100. Be ready that it can happen, even its unlikely and if that really happens it means something is wrong with your strategy or you made too much mistakes. But count with it that it can happen.. Setup your risk per trade in such % that you would be comfortable if that happens.
📍 0.25% Risk - 30x Loss = - 7.5%
📍0.5% Risk - 30 x Loss = - 15%
📍1% Risk - 30 x Loss = -30%
📍2% Risk - 30x Loss = - 60%
📍3% Risk - 30x Loss = - 90%
Define what would you be able to accept and be comfortable even during a loosing streak.
📌 Have more accounts
This will give you flexibility. Im running 3x personal accounts. Each with different risk. with copy trading system to distribute my positions. 🎯 Account 1: Here Im opening all trades which I has well defined risk and its A+Setups. If I open a trade on this account they goes automatically to the other 2 accounts. So I got proportionaly this positions on whole capital with 1% risk.
🎯 Account 2: Here are running copied trades from Account 1 + Im opening another positions when I want to add or increase the risk also used for short terms setups. Its 3% risk only form this one specific account and its not copied to other accounts.
🎯 Account 3: Here are running trades from account 1 + This account is also used mainly for the crypto trades and news trading. Trades are also isolated just for this account and not copied to the whole portfolio.
🎯 Prop Firm Trading
For the prop trading where more strict rules Im using completely different approach which I described in this post below 👇Click the picture to learn more Final tip: Try to have strategy with win rate between 65 - 70% and 2 - 2.5 RR.
If you got anything lower than that you can go thru some dark periods, but you will survive if stick to your plan based on the statistics. If you don't have statistical data of your strategy, stop trading for while , step back and do a bit of backtesting Tradingview has great backtesting features.
David Perk aka Dave FX Hunter

Bonus Gold long Week 01 DecemberVery simple Gold long for week 01 December.
Trade based on Fibonacci levels on the 4 hour chart.
i have added 2 TP first for 750 pips and full TP for over 1000 pips/
With these trades it is recommended to just use small lot size and be prepared to hold in drawdown .
not to be considered financial advice its just a bit of fun with technicals
let me know if you want to see more of these along with the weekly chart
