XAUUSD Strong Rejection From FVG, Watching for Long EntriesGold delivered a clean reaction from the Fair Value Gap (FVG), showing strong buyer interest at the discounted zone. Price also tapped into the Breaker Block, confirming that liquidity below the lows has already been swept.
With this reaction, short-term bullish momentum is building again.
🔍 Key Technical Points
• FVG filled perfectly, triggering an immediate bullish bounce.
• Liquidity sweep below previous lows shows sellers are exhausted.
• Price tapped into the Breaker Block, a strong reversal zone.
• Market has now shifted back above the short-term structure.
Buy Scenario
If price retests the small support zone highlighted on the chart, it may offer a clean continuation long setup.
📌 I will consider buy entries from the retest zone.
Targets remain toward the upper imbalance and recent highs.
🎯 Targets
• First target: Recovery to mid-range
• Main target: 4220+ area (as shown in your projection box)
🛑 Invalidation
A clean break below the FVG zone would invalidate the bullish setup.
Trade ideas

Gold Intraday Trading Plan 11/14/2025Yesterday gold rose initially and got rejected from 4245. After that, it dropped by almost 1k pips and found its support at 4145. I am still bullish in gold while it may go through small period of intraday correction. It could drop from 4190-4200 and may bounce from 4125. If 4200 is broken, it could test 4245 again. Therefore, I will look for buying opportunities from 4125 today.

XAUUSD FOLLOW THROUGHFollowing the success of our intial setup on gold, which you will find attached
Gold Bought and filled our FVG zone, filling up all the inefficiency in that area,
We currently have slow movement in the FVG Zone and with the current taking out of the previous Higher Low, we formed a Change Of Character
Using our FVG Zone, we may expect price to sell to take out or even break with this sell ???
Lets monitor and react as the markets talk to us
DISCLAIMER : This is purely for motivational purposes and the infomation provided is not to be considered as investment advise, Risk Accordingly

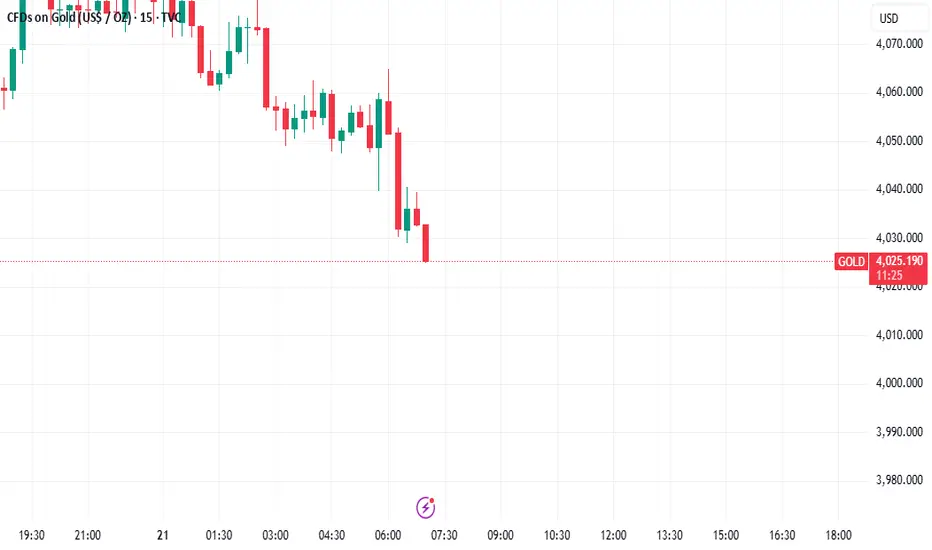
Gold's downward trend was in line with expectations!
On Friday (November 21), gold continued its intraday decline during the European session, currently trading around $4060. Gold prices are under pressure below $4100. Hawkish sentiment surrounding the Federal Reserve is putting pressure on non-yielding assets like gold. Yesterday's non-farm payroll data appeared better than expected, but it was actually filled with details of a deteriorating labor market, only slightly boosting gold's performance. However, the US stock market opened higher and then fell sharply yesterday, coupled with a general plunge in Asian stock markets, affecting market risk appetite and dragging gold down as well. Ultimately, the non-farm payroll data did not significantly increase the probability of a Fed rate cut, and the recent sharp decline in equity assets has led gold to seek a bottom. Whether gold will recover its valuation along with the equity market or resume its upward trend as a safe-haven asset that has been mistakenly sold off remains to be seen and may require technical analysis and further data to provide direction.
The Federal Reserve completed its second rate cut of 2025 on October 29, lowering the benchmark interest rate by 25 basis points, fixing the current policy rate range at 3.75%-4.00%. The minutes of the October Federal Open Market Committee (FOMC) meeting, released yesterday, revealed a significant disagreement among members regarding whether to initiate a new round of interest rate cuts in December. The core point of contention was that while economic indicators remained stable, upward pressure on inflation was a major concern. The minutes specifically highlighted the importance of managing long-term inflation expectations, and consecutive rate cuts could make these expectations difficult to manage, leading to uncontrollable inflation and negating the gains made by the Fed's previous rate hikes in combating inflation. Two members voted against the rate cut decision: one advocated for a 50-basis-point cut instead of 25, while the other advocated maintaining the current target interest rate. All members reiterated their commitment to the Fed's dual mandate—achieving full employment while stabilizing inflation at the 2% policy anchor. A crucial context is that Fed President Jerome Powell explicitly stated after last month's policy statement that another rate cut in December was "not a certainty," leaving room for policy adjustments. When there is disagreement on rate cuts, it naturally negatively impacts gold, a non-interest-bearing asset, increasing the opportunity cost of holding gold.
Gold Price Analysis:
Gold has been correcting since $4381. Last week, it rebounded twice, testing the $4250 level. I have consistently emphasized that this is a rebound, not a genuine upward trend! I am not optimistic about gold breaking new highs in the fourth quarter, and this correction will be prolonged, exceeding most people's expectations. After rebounding and encountering resistance around $4130 this week, gold surged again after yesterday's non-farm payroll data release, encountering resistance around $4106, and is now trending lower. In the short term, this is a downtrend, not a bullish one, and many people are still stuck in a bullish mindset.
Intraday, gold is slightly weak in the short term. This is another decline after the rebound to around $4130 this week. It is highly likely to break below the $4000 level, which is Tuesday's low. Even if it doesn't break through, or if it does, the decline will be limited. The reference point for going long should be around $4000; there is simply no room or value for going long at other levels. Currently, gold is consolidating in the 4000-4100 range in the short term. Whether going long or short, the strategy should be short-term; don't hold positions indefinitely. For a considerable period, the conditions for a large one-sided trend are unlikely; this is crucial to understand.
We have repeatedly emphasized recently that the $4000 mark will be broken, and we also believe that $3886 is not the recent low. Considering an unexpected scenario, if gold breaks upwards through the 4100-4110 area, then we need to be cautious. It will strengthen in the short term, testing Wednesday's high and the upper edge of the converging triangle, before potentially falling again. This is our overall strategy for gold. Currently, looking at the daily chart, within the triangle pattern, we tend to favor a rise followed by a fall. As we mentioned earlier, the key area to watch is 4100-4110. Multiple attempts to break through this level this week have failed, indicating significant selling pressure above. Therefore, until it breaks above 4100, I maintain a bearish outlook. The key support level below is currently very clear, in the 3998-4000 area. Before a break below this level, the bulls will likely offer some resistance and a rebound. However, if this level is broken, I personally believe the uptrend support since $3886 will likely crumble. This means the lower edge of the converging triangle pattern may break down, testing the $4000 level; further downside targets are the 3980-3950-3915 area. In summary, today's short-term trading strategy for gold is to primarily focus on selling on rallies. The key resistance level to watch in the short term is 4100-4110, and the key support level is 4030-4000. Please follow the trading signals closely.

XAUUSDXAUUSD Buy now. Dont miss the opportinuty
XAUUSD Buy now XAUUSD Buy now XAUUSD Buy now XAUUSD Buy now XAUUSD Buy now

Gold key support at 4009The Gold remains in a bullish trend, with recent price action showing signs of a corrective pullback within the broader uptrend.
Support Zone: 4009 – a key level from previous consolidation. Price is currently testing or approaching this level.
A bullish rebound from 4009 would confirm ongoing upside momentum, with potential targets at:
4110 – initial resistance
4150 – psychological and structural level
4220 – extended resistance on the longer-term chart
Bearish Scenario:
A confirmed break and daily close below 4009 would weaken the bullish outlook and suggest deeper downside risk toward:
3975 – minor support
3933 – stronger support and potential demand zone
Outlook:
Bullish bias remains intact while the Gold holds above 4009. A sustained break below this level could shift momentum to the downside in the short term.
This communication is for informational purposes only and should not be viewed as any form of recommendation as to a particular course of action or as investment advice. It is not intended as an offer or solicitation for the purchase or sale of any financial instrument or as an official confirmation of any transaction. Opinions, estimates and assumptions expressed herein are made as of the date of this communication and are subject to change without notice. This communication has been prepared based upon information, including market prices, data and other information, believed to be reliable; however, Trade Nation does not warrant its completeness or accuracy. All market prices and market data contained in or attached to this communication are indicative and subject to change without notice.

GOLD?
HI,
I am hanging on with my double bottom there.
If it breaks
Will consider again.
Looking for buyside from now 4040 appprox
All the best
Not a guru

monitoring bearish trend breaking support target 3860 and 3770
weekly bottomed after 3770
possibly the start of a bearish trend to 3440 on the monthly, but we will see a retracement up on the bottomed weekly first

A POSSIBLE CHANGE OF TREND TO LONG TERM SELLS So gold seems like going to break weekly structure for long term sells to start and a good confirmation will depend on how market closes next week and this could be as a result of institutions liquidating their buy positions from the beginning of the year
First target of the day's ceilingBy collecting all of the day's short positions and stop losses, gold is planning to attack its daily ceiling once and for all.

sideways possibility gold might sideways within this range for a couple of days.
until a clear breakout of 4100 or 4000.

Monthly Gold "The end"🟡 Comprehensive Analysis of Gold (XAUUSD)
In this analysis, we can clearly see that gold is still moving within a strong bullish channel. The price is respecting the structure formed by the upper resistance line and the two support lines (0 and 0.5) below.
🔵 The previous all-time high was around 1,952, and as shown on the chart, the price has broken above that level and continued into a powerful rally, reaching a new all-time high around 4,502.
✨ After this strong upward movement, the price touched the upper boundary of the channel — a zone that typically acts as a point of rejection. The chart illustrates a potential scenario where the price may start a pullback, enter a consolidation phase, and then drop to retest one of the support lines.
✔️ In other words: Gold is currently in a sensitive area. The new all-time high may trigger a correction before the market decides its next major move. However, the overall long-term trend remains bearish.
📉 The oscillator at the bottom shows strong overbought conditions, which increases the probability of a short-term downward correction.
🔔 Summary
Overall trend: bearish
Current position: At major resistance
Most likely scenario: long-term correction toward support (at 3510)
Best opportunities: May appear at lower levels after the market cools down
The Entries:
Downtrend: Until correction could be around (4000-3510)
If the price close under 4000 that mean we are going to 3510,
if the price close above the 4000 that mean we are going to rise maybe more than ATH could be 4800 or 5000.
Have a nice trade fellas.

Gold Trade Secured 350 Pipsprice manipulated higher sweeping BSL to then engulf and BOS to the downside to target SSL

XAUUSD | Prices Await Catalyst from NFPGold Price Technical Analysis (XAU/USD) 🛠️
Gold is currently trending downward (depreciating), but is expected to find strong support near key levels.
1. Bearish Scenario ⬇️
Initial Key Support: Any further decline is likely to find decent support near the 200-period Exponential Moving Average (EMA), currently pegged around $4,018.
Psychological Critical Point: The weekly low, just below the psychological $4,000 mark.
Downside Target: A break below $4,000 could accelerate Gold's decline towards:
- Support at $3,931.
- Retesting the late-October low around $3,886.
2. Bullish Scenario ⬆️
Immediate Hurdle: The Asian session high around $4,110 could act as initial resistance.
Upside Trigger: Continued buying beyond the overnight high, around $4,120, will be seen as a new trigger for bullish traders.
Upside Target: A confirmed uptrend will lift Gold prices towards the next relevant hurdle near the $4,152-$4,155 region.
Ultimate Goal: A further move above will pave the way for a recapture of the $4,200 round figure.

Brian here with the gold outlook for November 20th Good morning everyone, Brian here with the gold outlook for November 20th. The ABC correction phase of gold is nearly complete, and the market is preparing to enter a new wave phase amidst a flurry of USD data today.
Fundamental Analysis
Today's focus remains on the US labor data: NFP (or revisions), Unemployment Rate, and Initial Jobless Claims.
If the data shows a cooling labor market, expectations for the Fed to soon pivot to a rate-cutting cycle will rise, weakening real yields, putting pressure on the USD, and supporting gold prices.
Conversely, "too good" data will strengthen the dollar, allowing for a short-term repricing move, potentially dragging gold down to lower liquidity zones before recovering.
US session liquidity may be thin before the news release, making it prone to spikes due to algorithms and large flows simultaneously adjusting positions.
Overall, the macro backdrop still favors "buying the dip" for gold, but you must accept strong volatility around news time.
Technical Analysis
On the chart, gold has completed an ABC corrective wave within a descending channel, part of a larger uptrend.
The current descending channel only serves as a corrective leg after the previous upward wave; prices are trading above the "mean" area of the bullish structure, indicating the larger market structure remains bullish.
Below is the liquidity zone / demand zone 4013–4015, coinciding with the previous low and the lower channel boundary – if there's another stop-hunt to this area, it is still considered an opportunity to join the upward move, as long as 4008 is not breached.
Above, the 4086–4100 cluster is the decision zone: breaking and holding above here will confirm exiting the corrective channel, triggering an impulsive leg towards resistances 4132–4146 and further to 4187.
In summary, the main bias remains bullish, prioritizing buy strategies at support zones or after breakout confirmation.
Key Price Levels
Resistance: 4086 – 4100 – 4110 – 4132 – 4146
Support: 4040 – 4030 – 4015
Trading Scenarios
Buy Scenario 1 – Continuation Breakout
Entry: 4086
SL: 4078
TP: 4100 – 4120 – 4140
Prioritize when price breaks up and retests 4086–4100 as a new support zone, confirming exit from the descending channel.
Buy Scenario 2 – Deep Liquidity Sweep
Entry: 4015–4013
SL: 4008
TP: 4030 – 4045 – 4070
Watch for strong price reactions at the demand zone, with pin bars or engulfing candles signaling order flow returning to buyers.
Sell Scenario – Sell Reaction at Strong Resistance
Entry: 4144–4146
SL: 4151
TP: 4132 – 4120 – 4100
Short-term sell strategy, leveraging the high supply zone if price rises straight up without sufficient accumulation.
The medium-term upside target if the bullish wave develops as expected remains the 4187 area.
What do you think of this scenario? Remember to follow Brian for daily gold insights and comment your views below to join the discussion.

XAUUSD COMPLETING WAVE 4according to plan, unfold into zigzag correction 12345 - abc - 12345
downward could be an impulse 12345. reentry at wave 2 whan abc completed.

The down wave will continue soonI think the corrective up wave completed in 3 waves which I think was a triple zigzag. The down wave will continue soon.

GOLD HIGH PROBABILITY BUY SOON!!!🚨 XAUUSD HIGH PROBABILITY BUY SETUP 🚨
* Here We Can See Clearly The Next Potential Moves For GOLD Coming Hours.
* Keep Your Eyes Close On Your Trading Positions.
* Happy PIP Hunting Traders.
FXKILLA.

XAU-USDThe hourly timeframe has reacted again to the resistance level at 4100 📊
The scenario on the hourly timeframe here is either a breakout of the mentioned resistance to enter a bullish phase ✌️🔼
Or it has to break the trendline downward to come back to the bottom of the large range box 🚨🔽

gold on sideways until breakout#XAUUSD price today is total sideways, but we monitor those price if decline continues. 4046-4040 shows entry on sell, 2 times breakout above 4055.5 on bullish
4046-4040 on sell limit, target 4026-3995, SL 4055.5.
Below 4026 on H4 need reverse back unless the H1 closes below there before selling can continues. The 4055.5 is a strong range which needs 2 times breakout before buying.

XAU/USD Intraday Plan – Watching Reaction at Support ZoneAfter a brief consolidation yesterday, gold dropped into the Support Zone and is currently trading around 4014. Market structure remains bearish, with price sitting below both the MA50 and MA200. The series of rejection wicks shows buyers are trying to push back, but momentum is still with the sellers for now.
The first resistance is at 4027. For buyers to gain traction, we need a clean break above 4027, followed by a break above 4053 — only then could we see an attempt toward 4078.
If price fails to hold the Support Zone and breaks below 3,996, the next downside target becomes the HTF Support Zone — a major area where buyers have reacted strongly in the past.
📌Key levels to watch:
Resistance:
4027
4053
4078
Support:
3996
3968
3921

XAUUSDImpulsive move down on Friday for XAUUSD, waiting for pullbacks to short the market. The pair is very bullish on the higher timeframes however there are potential short term short positions.

GOLD sellsSells trade Idea./
Reduced chance of rate cut bets.
Trade war optimism.
INflation still high
