GOLD SWING SHORT SETUPGOLD SWING SHORT SETUP: Liquidity Sweep Expected! 📉
High Probability Zone Confirmed: Price has now tapped into the H4 Major Supply Zone, significantly increasing the probability of a move down!
The Structure is Clear: We've confirmed the Break of Structure (BOS) and established a strong Lower Low trend on the Higher Timeframe.
Current Focus: The movement from B to C is purely a corrective pullback designed to sweep liquidity before the main drop. I am keying in on the reaction near the Supply Zone (at C) for the high-probability short entry.
The Target: We are aiming for the previous low (at B) and ultimately projecting a New Lower Low based on the current market structure.
This is a high-conviction swing trade following pure price action and institutional principles.
Trade ideas

Gold: consolidation and the search for directionGold has been trading in a range in recent days, maintaining a balance between buyers and sellers. The movement remains restrained: upward impulses are followed by pullbacks, while the price holds within the consolidation zone.
The chart shows the formation of a structure that does not give a clear advantage to either side. On one hand, interest in safe-haven assets supports demand for gold; on the other, dollar strength limits growth.
The current situation points to a waiting phase: the market is accumulating energy, and the next breakout of key levels will determine the further direction. For now, gold remains in a neutral zone, where both continued growth and the development of a correction are possible.

XAU / USD 1 Hour ChartHello traders. We have FOMC news today here in the US. I just marked the chart for a quick, potential scalp trade. Not looking to do much with the news happening. Pre NY volume is starting to come in, let's see how the current 30 min. chart / hourly and 4 hour chart close. Big G gets a shout out. Be well and trade the trend. Happy Wednesday.

XAUUSD Intraday Plan | Gold Holds Range Ahead of FOMCGold remains range-bound between 4219 and 4185, showing no clear commitment from buyers or sellers. A decisive breakout on either side will be needed to define the next intraday direction.
A break above 4219 would open the path toward 4251, and with strong momentum, potentially 4285.
However, if 4185 fails, price may drift back into the Support Zone. Should selling pressure increase, the HTF Support Zone may come into play as the next major area for buyers to respond.
📌Key levels to watch:
Resistance:
4219
4251
4285
Support:
4185
4144
4102
4049
4014
🔎Fundamental focus:
All eyes are on today’s FOMC decision — the key catalyst markets have been waiting for. Expect heightened volatility as traders react to the rate statement, projections, and Powell’s remarks.

XAUUSDPrice Action Trading is a method of financial market analysis where traders make buying and selling decisions solely based on the asset's price movements over time, without relying on technical indicators.
It's essentially the art of reading a "naked" or clean chart to understand the psychology and behavior of market participants.

Gold continues to consolidate; continue to buy on dips.Gold continues to consolidate; continue to buy on dips.
As shown in the 2-hour chart:
Gold prices are heading towards $4220 per ounce, showing signs of weakening upward momentum.
Today's Asian and European trading sessions will focus on testing the resistance level near $4220 per ounce.
Last night, we went long near $4195 per ounce, profiting nearly 20 points.
I believe that gold prices are likely to fluctuate between $4200 and $4250 per ounce before the Fed finally confirms a rate cut.
I share high-quality free trading signals daily on my channel, with a win rate exceeding 85%. Thank you for your attention. I will do my best to help every trader develop correct trading habits and reduce unnecessary losses.
Current Technical Analysis:
Current Resistance: $4220
Current Support: $4190
Macro Trading Range: $4170 - $4260
First, we need to clarify two points:
1: Gold prices fell on Monday, but formed a valid head and shoulders bottom pattern on Tuesday.
2. Gold prices experienced a false breakout last Friday. Summary: Gold prices have not yet broken out of the current range, and there is no clear trend guiding their movement.
Currently, we categorize it as: sideways consolidation.
Trading Range: $4170 - $4260
Our trading strategy today is very clear:
1: Wait for the price to fall before going long.
2: Set the final stop-loss at $4170, and the intermediate stop-loss at $4190.
Entry Price: $4200-$4210
Stop-Loss Price: $4190/$4170
Take-Profit Price: $4235-$4250
I know many people in the group are eagerly awaiting my updates. But my advice is: please don't view market changes from a static perspective.
Market conditions change rapidly, and rhythms and patterns are constantly evolving. We need to develop corresponding strategies for each stage.
I share and analyze my trading philosophy daily on my channel. You may not be able to keep up with my pace, but once you understand my trading data and habits, you will definitely follow my channel for a long time.

XAUUSD (2H) – Structure, Liquidity & Key Zones | SMC BreakdownMarket Structure:
XAUUSD remains in a short-term bearish structure, with repeated BOS and CHoCH points confirming controlled downside. Recent candles show consistent displacement favoring sellers.
Liquidity Grab:
Price has just taken sell-side liquidity beneath the previous swing lows. This sweep pushes the market into a discount region, a typical reaction for smart-money rebalancing.
Key Demand Zone (Reaction Area):
Price is currently testing the 4,153 – 4,182 demand zone, characterized by:
Prior accumulation block
Imbalance fill
Multiple wick rejections signaling buyer sensitivity
How price reacts here will determine the next structural leg.
Upside Imbalances & Supply Zones:
If bullish confirmation forms inside this demand, the next logical price objectives are:
4,210 – 4,230 intraday supply
4,250 – 4,260 higher-timeframe supply
These zones hold unmitigated inefficiencies from previous impulsive moves.
Outlook (Neutral / Analytical):
Although the short-term trend remains bearish, the price is positioned inside a high-value discount zone where reversals often originate. A confirmed CHoCH upward would indicate potential mitigation.
Failure of this zone, however, may lead to continued bearish expansion.

XAU / USD 1 Hour ChartHello traders. So, the last 30 minute candle, the red one, was what I just traded. I sold from the red line, caught about 40 pips or so and closed out just that fast. I am waiting for Pre NY volume to start in 50 minutes from this post. Let's see how things play out. All that is happening right now is gold is just taking out existing long and short trades. I am waiting for a bit. I felt the trade I took was risky, despite me catching a few pips. I used a micro lot, to minimize loss in case it did not go my way. Big G gets a shout out. Be well and trade the trend.

XAUUSD Facing Resistance Near Key Supply ZoneGold has moved into a previously active price area where selling pressure has appeared in the past. Recent candles show hesitation after the upward move, suggesting possible exhaustion around this level.
If the market fails to stay above the mid-range area, a retracement toward the lower support zone may develop. A firm hold and clear acceptance above resistance would shift focus back toward the upper range.

Update on XAU Swing trade adjust the correction for wave 3. if buyers return to the demand zone.
as is the sell position

GOLD ANALYSIS What’s Moving the Market Today?(December 05, 2025)OANDA:XAUUSD GOLD ANALYSIS What’s Moving the Market Today?(December 05, 2025)
Welcome back to Trade with DECRYPTERS, where we decode smart-money footprints into clean, actionable buy & sell zones.
Keep it simple. Trust the levels. Follow the plan.
📰 Market Overview
Gold continues its upward rotation after reacting perfectly from Smart Money Buy Orders earlier this week. Price is now pushing toward major liquidity pockets and approaching premium sell zones, keeping bulls firmly in command despite mild USD stabilization.
The U.S. Dollar Index remains soft following post-election volatility, hovering near structural lows. Combined with elevated geopolitical tensions and aggressive central-bank accumulation, gold continues to operate inside a macro-bullish environment.
With key U.S. data releases (ADP, ISM Services, PCE) and the December 9–10 FOMC meeting ahead, markets remain cautious but structurally bullish. Gold is respecting the premium discount rotation cleanly, offering multiple low-risk, high-probability setups for disciplined traders.
🔍 Key Fundamentals Driving Today’s Move
📈 88% probability of a December rate cut → lower yield competition boosts gold
💵 USD stabilizing but not strengthening → downside limited
🌍 Geopolitical tensions elevated → strong safe-haven premium
🏦 Central banks remain net buyers (634t YTD) → consistent long-term accumulation
📊 Core PCE at 2.9% → keeps Fed leaning dovish
Gold’s strength remains driven by a powerful combination of macro uncertainty + structural demand + smart-money order flow.
📰 Insights from Key Sources
Spot gold rose 1% to $4,199.19/oz on Nov 28, signaling renewed buying interest and aggressive dip-accumulation.
Bank of America projects gold could reach $5,000/oz by 2026, backed by tight supply, low inventories, and persistent monetary support.
Deutsche Bank raised its 2026 average gold forecast to $4,450/oz (up from $4,000), citing ETF inflows and sustained central-bank demand.
Australian miners are ramping up exploration to capitalize on the rally.
South Africa has opened its first underground gold mine in 15 years (Qala Shallows), aiming to stockpile ore amid record prices.
Structural supply constraints remain a bullish driver, supporting higher long-term price projections.
These insights reinforce the institutional bias: long-term accumulation remains strong, and the upside narrative is supported by both fundamentals and supply-demand dynamics.
📆 KEY EVENTS TO WATCH
🔸 Core PCE Data — Recently Released
A major Federal Reserve–driven volatility catalyst.
Latest Core PCE: 2.9% YoY
Latest Monthly Change: 0.2% MoM
If Core PCE comes in softer than expectations:
✔️ Strengthens the December rate-cut narrative
✔️ Supports a continuation toward premium sell zones (4245 → 4264 → 4284)
✔️ Confirms easing inflation pressure and boosts non-yielding assets like gold
If Core PCE comes in hotter than forecast:
✔️ Sparks temporary USD strength
✔️ Expect a liquidity sweep into discount zones (4203 → 4189 → 4167)
✔️ Real direction usually follows after the stop-hunt, not the initial candle
🔸 Geopolitical Landscape
Geopolitical tensions continue to amplify intraday volatility:
🌍 Escalation → safe-haven spike into premium zones
🌤️ Calm → controlled pullbacks into buy zones
Trend remains bullish, but momentum varies depending on global risk sentiment.
Geopolitics generally strengthens the prevailing smart-money trend rather than reversing it.
🟩 GOLD TECHNICAL LEVELS
Gold continues to respect its rising structure, reacting cleanly from discount zones and rotating toward institutional premium blocks. Price currently sits just below major sell-side liquidity.
🟩 📌 SMART MONEY BUY ORDERS: 4147 – 4167
Primary institutional demand zone with ~$22 million in resting buy-side liquidity.
Expect:
✔️ Strong reaction on first tap
✔️ Accumulation & mitigation
✔️ Higher-low formations inside bullish channel
Break below 4147 opens liquidity toward 4108 → 4075.
🟩 📌 SCALP BUY AREA: 4203 – 4189
Short-term discount zone for:
✔️ Intraday long scalps
✔️ Retracement continuation setups
✔️ Mid-range liquidity grabs
A break of 4189 brings price back into the deeper Smart Money Buy Zone.
🟧 📌 SCALP SELL AREA: 4245 – 4254
Short-term distribution zone ideal for:
✔️ Quick reaction shorts
✔️ Intraday pullbacks
✔️ Stop runs before testing the major premium zone
Rejection sends price back toward 4200–4210 liquidity.
🔺 📌 SMART MONEY SELL AREA: 4264 – 4284
High-probability institutional distribution zone with $33 million in sell-side orders.
Expect:
✔️ Manipulation wicks into premium
✔️ Liquidity grabs above local highs
✔️ Swing reversal setups near range extreme
A decisive break & hold above 4284 opens continuation toward 4310 → 4325.
📌 Conclusion
gold remains firmly bullish as long as the 4147–4167 Smart Money Buy Zone is protected, with price continuing its clean rotation between institutional discount and premium levels. With unemployment data set to inject volatility, expect engineered liquidity sweeps before the true direction unfolds. The broader narrative of dovish policy, geopolitical risk, and heavy central-bank accumulation keeps the upside intact. Stay patient, trust the zones, and let smart-money footprints guide every decision.
🙌 Support the Analysis
If this breakdown brought value to your trading:
👍 Drop a like
💬 Comment your levels
📈 Share your charts with the community
Let’s grow together.
Best Regards,
M. MOIZ KHATTAK | Founder — TRADE WITH DECRYPTERS

Gold still holding a bullish momentum Gold has refuse to break below 4163 it tried yesterday and the early hour of today but it still holding strong i expect Gold to rally back up to 4240 or higher but base on Fundamental please apply some risk management in place ...let watch and see and please comment what you think on gold direction .
Thanks

ASIAN MONEY ZONE SNIPER SIGNALS BASE TEMPLATE One of the most simplest and profitable strategies. This is a base template to use along with Signal Sniper software.

Gold’s Oscillatory SeesawGold is in a consolidative oscillation following a high-level pullback. Short-term volatility remains limited amid profit-taking activities and anticipation of upcoming economic data, while the medium-to-long-term trend is still underpinned by multiple core factors. Today, the price has fluctuated around the critical $4,200 level in a seesaw pattern, displaying distinct characteristics of a high-level oscillation with "limited downside and moderate upside momentum," as long-short divergence remains pronounced.
On the downside: The immediate short-term support remains in the $4,170 – $4,175 range, with key focus on the $4,153 – $4,155 zone. A break below this interval could trigger further downside movement, making it a crucial defensive level for medium-term bulls.
On the upside: The near-term resistance is at $4,220. A successful breakout and hold above this level may pave the way for a rally toward the $4,250 – $4,265 range.
Overall, today’s consolidative pullback in gold represents a short-term correction rather than a trend reversal. Operationally, traders can adopt a range-trading strategy of "buying low and selling high" for the time being, with key attention on the breakout of the $4,200 level. Meanwhile, remain vigilant of the guiding role of subsequent ISM Services PMI and PCE data on the market.
Trading Strategy:
Buy 4175 - 4185
SL 4170
TP 4220 - 4230 - 4240
Sell 4220 - 4230
SL 4240
TP 4190 - 4180 - 4170

XAUUSD- Volume Profile AnalysisAt first glance, the chart may look a bit busy, but the structure is actually quite straightforward once you peel it off layer by layer.
The Fall
We start with the sharp October liquidation on the left. The volume profile over that entire downswing sets up a clean VAH-1, VAL-1, and POC-1, which are our key reference points for everything that follows.
Early November Rally
Early November price action is classic: price bases right around VAL-1, absorbs supply, and then launches into a swift breakout toward VAH-1. Textbook rotation from value-low to value-high.
Importance of VAH
VAH-1, as expected, caps the move and triggers a pullback right into the POC-2 of the November advance, which also happens to overlap with the prior breakout zone. A high confluence area where buyers stepped back in.
The Sharp Pullback to Retest
Price then coils around VAH-2, grinds higher, and retests VAH-1 but only to resist again. That repeated inability to hold above VAH-1 is a sign of pullback.
A Perfect Alignment
POC-3 and POC-4 line up almost perfectly, creating a stacked POC shelf and hence a structurally important zone. Add to that an active ascending trend channel that has been containing the structural swings also aligns with the POC shelf.
Potential Setup
Given this alignment, the 4075–4100 region becomes a potential demand pocket or a zone that could attract responsive buyers on any pullback, offering a comparatively low-risk long setup.
On the flip side, price could simply squeeze higher from current levels, ripping past 4250 into the old highs. But that scenario doesn’t offer favorable risk-to-reward for fresh longs as the risk of breakout failure remains high in an extended market.
But the real question is-
How do you read this tape? Are we staring at the late stages of a tired rally, or shaping up for a classic pullback-and-continuation structure?
Share your thoughts in the comment section below.
Thanks for reading.
📣Disclaimer:
Everything shared here is meant for education and general awareness only. It’s not financial advice, nor a recommendation to buy, sell, or hold any asset. Do your own research, manage your risk, and make sure you understand what you’re getting into.

DeGRAM | GOLD is correcting from the resistance line📊 Technical Analysis
● XAU/USD rejected the upper resistance line three times, forming a clear bearish reaction near 4250. Price is losing momentum and sliding back toward the mid-range support after failing to sustain highs.
● Repeated consolidations along the rising support line show weakening bullish pressure, increasing the probability of a corrective drop toward 4150–4100.
💡 Fundamental Analysis
● Gold softens as U.S. yields rebound and Fed officials signal that policy easing is not imminent, limiting upside appetite.
✨ Summary
● Bearish bias below 4250. Targets: 4150 → 4100. Resistance: 4250. Support: 4150 / 4100.
-------------------
Share your opinion in the comments and support the idea with a like. Thanks for your support!
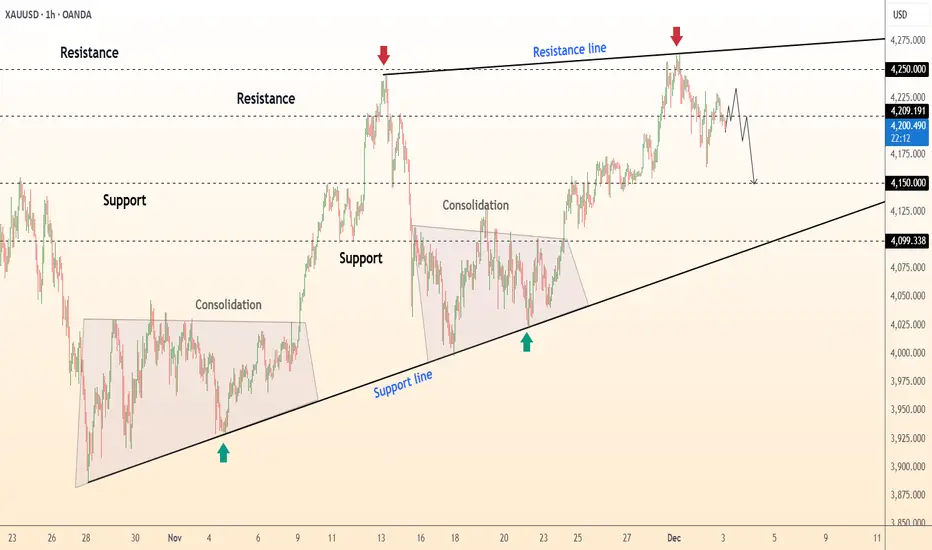
XAUUSD Long: Channel Support Holding — Buyers Target 4,300 ZoneHello, traders! The price auction for XAUUSD has been unfolding within a clearly structured bullish progression after a period of heavy distribution inside the Supply Zone. Earlier, gold established a wide Range between the Supply and Demand areas, with multiple sharp rejections forming the top of the structure. Eventually, sellers pushed the price lower, initiating a corrective decline that developed into a well-defined Triangle Pattern, marked by a descending Triangle Supply Line and a rising Triangle Demand Line. This compression ended with a clean breakout to the upside, signaling the beginning of a new bullish phase. Following the breakout, XAUUSD formed a Pivot Point near the mid-range level, where price briefly rejected before continuing its upward trajectory. Another notable phase was the formation of an inverse Head-and-Shoulders structure, confirming buyer strength after a fake breakout below the neckline. This reversal pattern provided the foundation for the current bullish continuation.
Currently, gold is trading inside a strong Ascending Channel, respecting both channel boundaries with consistent higher highs and higher lows. The latest breakout from the mid-channel zone has kept the bullish structure intact, and after a corrective pullback to the lower channel boundary, price is attempting to resume upward movement. As long as price holds within this channel, the market dynamics favor a continuation toward the 4,300 resistance target, which aligns with the upper boundary of the channel and the previously broken structure.
My scenario for the development of events is bullish, with expectations of a rebound from the lower channel boundary followed by a continuation toward the 4,300 resistance level. In my opinion, maintaining structure within the ascending channel supports further upside as long as buyers defend the 4,110 support region below. Manage your risk!

XAUUSD KEY LEVELS 04-11Greetings
Hi traders, This is the crucial support zone for XAU-USD at 15 minute,
based on the movement of the day prior and market trends.
Support zone (White line)
Important levels:
4175.09 is the entry
Target: 4185.09
Stop loss: 4165.09
1:1 Risk-Reward Ratio
We are inspired to continue learning and exchanging ideas by your likes and boosts!

GOLD fluctuates sharply as labor data weakensSpot OANDA:XAUUSD closed nearly flat at $4,203.06 an ounce, down less than 0.1%, after a volatile session in New York. A significantly weaker-than-expected ADP report sent gold soaring to $4,241.60 an ounce, before profit-taking pressure and a sharp reversal in silver sent prices quickly tumbling back to $4,195 an ounce.
As of writing today, Thursday, December 4, spot gold was trading at $4,202 an ounce, up about $10 on the day.
ADP data showed the US private sector lost 32,000 jobs in November, in stark contrast to expectations for a gain of 10,000, the sharpest decline since March 2023. Win Thin (Nassau 1982) assessed that the ADP index had weakened continuously, reflecting a sustained downward trend in the labor market. Nela Richardson (ADP) noted the widespread slowdown across all business groups, especially the small and medium-sized sector, a sign of more cautious consumers in the context of macro instability.
While gold rebounded in response to the data, silver, which had touched $58.97/ounce in the early session yesterday, then fell sharply to $57.83/ounce, dragging the entire group of precious metals into a short-term correction.
Trump’s unexpected move causes market turmoil: Will the Fed chairmanship change soon?
A new political variable emerged when the White House abruptly canceled the interview schedule for the Fed chairman candidate this week. The Wall Street Journal commented that this move shows that President Trump may have finalized his choice to succeed Powell.
The market immediately raised the possibility that the leading candidate is Kevin Hassett, the White House economic adviser, who is seen as leaning towards a strong interest rate cut stance. The weak USD and recent recovery in gold partly reflect expectations that Hassett may push for a deeper easing cycle after Mr. Powell ends his term in May next year.
Steve Englander (Standard Chartered) said Hassett has an “impressive” track record, but worries about the Fed’s independence under political pressure. The Financial Times said bond investors have expressed concerns to the US Treasury that Hassett may prioritize short-term growth over price stability.
CME FedWatch currently prices an 89% chance of a Fed rate cut at its December 9-10 meeting. Markets are still waiting for September core PCE data, delayed until Friday, a key piece of the inflation puzzle.
Fundamental Outlook: Lower Yields Boost Gold, But Correction Risks Not Over
Given that gold is not yielding, expectations of QE are the central support. However, the combination of weak data, silver volatility and profit-taking pressure suggests that the road ahead for gold will be bumpy.
Macro trends – weak labor, softer USD, and political uncertainty surrounding the Fed Chair – continue to favor price support. But until we break above $4,400/oz with convincing liquidity, the momentum for acceleration will remain at the potential level.
Technical analysis and recommendations OANDA:XAUUSD
Gold is operating in a new bullish cycle: the price remains above the medium-term rising channel, making successive higher lows and closing above the short-term moving averages, indicating active buying.
The important support zone around $4,128–$4,130 (Fibo 0.236) is well defended; if maintained, the short-term bullish structure remains intact.
The RSI has recovered from the neutral zone, implying that the upside momentum is still strong but not overbought. The bullish scenario is complete when the price remains above the short-term MA21, does not break below $3,972–$3,973 (Fibo 0.382) and moves towards challenging the resistance zone of $4,300–$4,380 (channel top/Fibo extension).
Cyclical risk: a break below $3,972 would weaken the structure and could drag the price to a test of $3,846–$3,720.
SELL XAUUSD PRICE 4231 - 4229⚡️
↠↠ Stop Loss 4235
→Take Profit 1 4223
↨
→Take Profit 2 4217
BUY XAUUSD PRICE 4141 - 4143⚡️
↠↠ Stop Loss 4137
→Take Profit 1 4149
↨
→Take Profit 2 4155

A BUY AND HOLD A buy at 4185-80 sl at 4170,
buyers gaining momentum to push up price because market already obeyed yesterday sell setup
GOLD End-of-Week Trend Exhaustion on XAUUSD My AnalysisXAUUSD (Gold) has been bearish all week, and as we head toward the end of the week, we need to stay cautious. 📉⚠️ When the weekly trend is already pushing lower, institutional traders often start winding out of their short positions. This can cause unexpected pullbacks or even full retracements. And remember — trends don’t move in one direction forever. They weaken, especially toward the end of the week. 😮💨
So the real question becomes: do you really want to trade with the trend right as it’s hitting potential exhaustion?
Looking at the chart, Gold has traded lower and broken through a key level. When we check the volume profile, the Point of Control (POC) is sitting right above current price — and that level is stacked with previous order flow. 🧱📊 That makes it a strong resistance area, and for me personally, it’s not an area I’d want to be buying into.
Because today is Thursday, a sell setup could still be valid if we see price pull back and then break structure to the downside again. But as mentioned earlier, be careful — late in the week we often see profit-taking, which can push price back up before the weekly close. 🕒🔄
Trade smart and manage risk.
Not financial advice.

Report 4/12/25Report summary
Global markets are rotating around a single macro hub: Japan. Super-long JGB yields keep pressing higher as the Bank of Japan signals it will “thoroughly discuss” another rate increase at the Dec. 18–19 meeting; 30-year JGBs hit fresh records and 10-year JGBs are referenced near ~1.9%, while the 10-year U.S. Treasury closed about 4.09% earlier in the week. A BOJ that tightens sooner forces a partial un-wind of yen carry, softens the broad dollar, and supports duration and gold. Into today’s close the WSJ Dollar Index is lower on the week (around 96.4–96.8), U.S. equities are firmer, spot gold is near record territory, and oil stays heavy.
Market reactions
The risk complex leaned risk-on even as rates volatility remained elevated. The S&P 500 and Dow added to recent gains (S&P ~6,829–6,849; Dow ~47,474–47,883), while the WSJ Dollar Index slipped (≈96.39–96.82), reflecting yen and euro strength at the margin. Gold futures settled around $4,215–$4,273/oz, maintaining a powerful up-trend. WTI January futures remain under pressure near the high-$50s per barrel (~$58.6), underscoring the demand/discipline standoff in energy.
Japan remains the global swing factor. Tokyo core CPI is running at 2.8% y/y, and BOJ guidance has pulled forward market expectations for another hike. That has driven super-long JGB yields to multi-decade highs and nudged U.S. 10-year yields back above 4%. The key transmission is via reduced appetite for foreign duration by Japanese lifers/pensions and the prospect of a gradual carry-trade un-wind.
Strategic forecasts (1–3 months)
Baseline. A “firm-but-not-frantic” BOJ path and fading U.S. recession odds keep global growth on a modest expansion track. With BOJ normalization proceeding and the Treasury term premium contained, the dollar’s broad trend tilts lower; risk assets oscillate but avoid a disorderly de-risk. In this base case, S&P 500 makes incremental highs on breadth improvement while gold consolidates above the $4,000 handle as real rates top out. WTI stabilizes in a $55–65 range absent new supply shocks.
Upside scenario. If BOJ proceeds cautiously and U.S. data moderate without cracking, the dollar leg lower extends and equities rerate further; Dow leadership broadens beyond mega-cap tech, and gold grinds higher on central-bank demand and currency diversification flows.
Downside scenario. A quicker BOJ hiking cadence or a liquidity air-pocket in global rates could force a sharper carry un-wind (USDJPY lurches lower), tighten global financial conditions, and hit cyclicals and small caps. Oil would likely weaken first on growth angst before rebounding on OPEC+ discipline headlines; gold would catch a haven bid.
Fiscal and political implications
Japan’s mix of rising local yields and hints of additional policy support limits outbound demand for U.S./EU duration at the margin, a quiet tightening of global financial conditions that the U.S. Treasury must navigate through a heavy auction calendar (e.g., steady bill/coupon issuance shown in the WSJ borrowing schedule). If BOJ normalization persists, Treasury will lean more on domestic real-money and banks to absorb supply, keeping the long end range-bound rather than collapsing.
In Europe, the policy mix is still growth-light and bank-friendly at the margin. The BoE’s decision to relax elements of bank capital requirements into 2027 (as reported this week) and constructive commentary around U.K. banks’ earnings capacity reduce the odds of an aggressive fiscal “tax raid” and bolster loan growth optics, supportive for U.K. financials and London listings into 2026.
Principal risks
Policy error at the BOJ remains the near-term macro swing risk. A step-change in Japanese rates could spark a disorderly carry exit and Treasury-market illiquidity just as U.S. refunding needs stay sizable. Secondary risks include any surprise U.S. data that re-accelerate inflation (re-steepening in real rates), or an energy-market supply disruption that turns WTI’s drift into a spike.
Opportunities
Positioning for a softer dollar while hedging rate volatility is the most robust cross-asset expression. That favors quality global equities funded by a modest underweight to the dollar, selective long duration via the belly if 10-year USTs hold ~4–4.25%, and strategic gold exposure while oil is cheap versus history and OPEC+ optionality. In regional terms, selective Japan financials benefit from a steeper local curve; U.K. banks screen better on regulatory optics and earnings leverage after the shift in capital stance.
Asset-by-asset impacts and levels
XAUUSD (Gold). Momentum remains constructive with futures near $4,215–$4,273/oz as the dollar softens and real yields stall. Base case: consolidation above $4,000 with breakout risk if BOJ tightening coincides with any U.S. growth wobble. Risk: a sharp real-rate back-up would cap gains.
S&P 500. The index holds near highs (~6,829–6,849). A softer dollar/benign real-rate path supports earnings translation for multinationals and risk appetite. Watch breadth, small-cap participation, and any funding-stress spillovers from Japan.
Dow Jones. The Dow trades ~47.5k–47.9k, reflecting cyclical leadership and bank strength. If U.K./U.S. bank policy optics keep improving and rates volatility calms, industrials and financials can extend.
USDJPY. The pair trades around ¥156 per dollar this week, with risk skewed to yen strength if BOJ guidance hardens at the Dec. 18–19 meeting. A measured grind toward ¥150 is plausible on carry normalization; a disorderly dash through ¥150 would imply broader deleveraging.
DXY / WSJ Dollar Index. The WSJ Dollar Index is down on the week (≈96.4–96.8), consistent with firmer yen/euro. Baseline is a gentle drift lower if BOJ tightens and U.S. data cool. Upside dollar risk revives with a U.S. inflation surprise.
Crude Oil (WTI). Front-month WTI sits in the high-$50s (~$58.6). Demand concerns and ample non-OPEC supply keep a lid on rallies, but position-cleaning looks advanced; risk/reward improves on dips toward mid-$50s with OPEC+ supply management as the catalyst.

XAU/USD: Buy Gold on Support Retest, Bullish StructureGold continues to fluctuate within a compression model + ascending support, indicating that selling pressure is weakening and the market wants to accumulate before bouncing to the upper supply zones.
Recent data shows USD cooling as the market increases expectations that the FED will be more dovish → creating a support base for XAU/USD's short-term rise.
📊 Technical Analysis – H1 Frame (MMF Flow)
1️⃣ Key Support:
4,187 – 4,188: BUY zone + lower trendline + strong price reaction.
Price just retested and bounced → confirming active buying remains.
2️⃣ Near Resistance:
4,211 – 4,212: mid-liquidity zone → expected to create HL before breaking the downtrend line.
3️⃣ Main Target Zone:
4,236 → strong resistance, confluence multiple times from the market.
Further: 4,254 → large supply zone, is an extended target if price breaks out.
🧭 Trading Scenario According to MMF
Main Scenario – BUY with Trend
BUY again when price retests 4,187 – 4,188 or
BUY when price breaks 4,212 then retests.
TP Targets:
TP1: 4,212
TP2: 4,236
TP3: 4,254
SL: below 4,182.
Idea: price creates an absorption model + HL on trendline → potential to pull up to the upper liquidity zones.
Secondary Scenario – SELL Reaction
Only for scalp traders:
SELL reaction at 4,236 – 4,238
TP: 4,212
SL: 4,243
🎯 Daily Bias Summary
Bias: Bullish on H1 when price holds 4,187.
Priority: BUY at the bottom – SELL at the top only for scalp.
Wait for the downtrend line to break to extend the target to 4,254.
