Gold Analysis Today: Continue Buying at 4210Gold Analysis Today: Continue Buying at 4210
As shown in the chart: Current Strategy:
Buy Price: 4210
Stop Loss: 4195
Take Profit: 4230-4260
Gold prices are currently in a consolidation phase. As long as the price remains above $4195, our current strategy is to buy on dips.
The $4180-$4200 range is undoubtedly a strong support area and will become the fulcrum for the next significant upward move.
I share real-time trading signals daily on my public channel, aiming to provide a learning platform for many confused traders. My trading strategy is very clear. Looking forward to your attention and cooperation.
Trade ideas

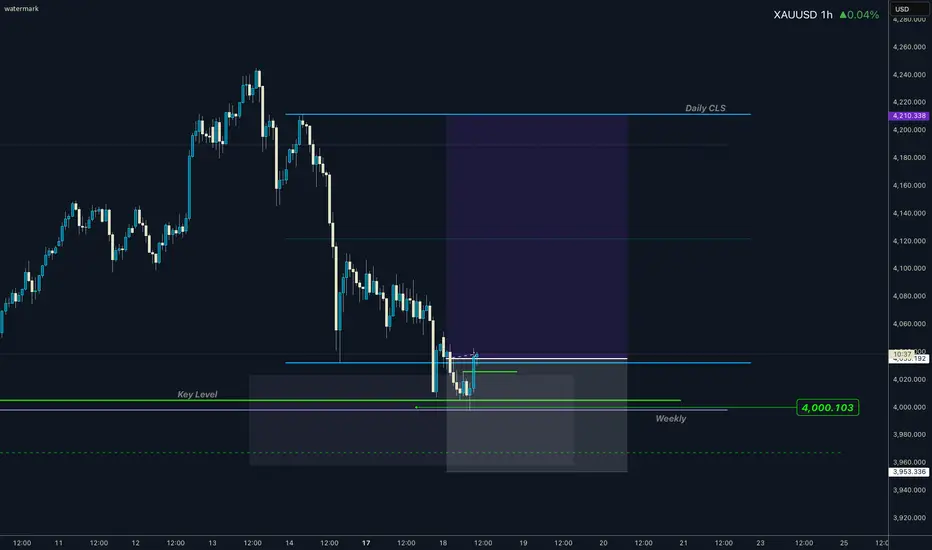
GOLD I Daily CLS I Model 1 nested in Weekly CLSHi friends, new range created. As always we are looking for the manipulation in to the key level around the range. Don't forget confirmation switch from manipulation phase to the distribution phase to make the setup valid. Stay patient and enter only after change in order flow. If price reaches 50% of the range take partial or full close.
📌 HTF - Higher Timeframe view
🧩 Complete proces and Strategy explained 👇 Click Below
🎯 Why your market approach also should be mechanical ?
NO Fixed Mechanical Trading Logic - You are guessing random patterns
NO Defined trading plan - Every trade different logic
NO Same logic in each trade - Not possible to backtest
NO Backtests on at least 300 trades - Not knowing Statistics
➡️ No Statistics ➡️ No Edge ➡️ Mindset ProblemS
🧠 Core of mindset problems
If you don't know your statistics on large enough data sample. You don't know your probabilities of win rate once the losing streak happen and it happens to every strategy. You will start doubting, hesitating to take next trade because you don't know statistics of your losses. In the end you will be doubting strategy and then jump to different one. You will be in the endless loop for years, looking for new better strategy. 👊 Your ultimate goal as a trader is not to be a generalist who knows 10 000 patterns. But rather create one system with narrowed criteria of each element of the trade to remove subjective and emotional decisions as much as possible and stick to this system no matter what. Practice it 10 000 times become a MASTER.
✨ Trading Mastery is reflection of your life
Have a longterm plan, No Alcohol & Drugs, Ignore others, Focus on your journey , Backtest regularly, Review your weeks, Journal mistakes, Exercise, Sleep well, Read books, Walks in nature (no phone) , Meditate, Reduce social media time, Spend time with family, Live Life.
Trading is hard, but not impossible. I believe in you 💪
David Perk aka Dave Fx Hunter
GOLD ANALYSIS 12/04/20251. Fundamental Analysis:
a) Economy:
• USD:
The USD is recovering slightly after a strong decline earlier this week, mainly due to profit-taking flows from gold and bonds. However, the overall trend of the USD remains weak because the market believes the Fed will keep interest rates low and maintain the rate-cutting cycle to support economic growth.
• U.S. Stock Market:
U.S. equities are rising modestly thanks to expectations of a rebound in Q4 corporate earnings and capital rotating back into the tech sector. This reduces safe-haven demand, but the bullish momentum is not strong enough to exert significant downward pressure on gold.
• FED:
The Fed continues to signal a dovish stance, prioritizing economic stability over inflation control. The market is pricing in the possibility of two rate cuts in 2026, providing strong support for gold.
• TRUMP:
The Trump administration is pushing aggressive stimulus packages and trade-protection policies. Uncertainty surrounding tax strategies and pressure on China–Mexico is creating a mild risk-off sentiment, supporting gold.
• Gold ETF (SPDR):
SPDR continued to sell 1.71 tons yesterday → a slightly negative signal, indicating institutional outflows from gold as prices approached all-time highs → mildly bearish for gold.
b) Geopolitics:
• Ongoing instability in the Middle East and Venezuela, with small conflicts occurring frequently.
• U.S.–China tensions persist over technology and trade.
These factors maintain a cautious market tone and form a supportive foundation for gold to rebound.
c) Market Sentiment:
The market is in a mildly risk-on state, but not stable. Funds still move into gold as a defensive asset whenever the USD or equities show signs of profit-taking.
→ Gold continues to trade within a range, but with a bullish bias.
Asian markets are entering the year-end physical-gold buying season → supportive for gold.
2. Technical Analysis:
Trend:
• Price is holding above the rising trendline.
• MA20 – MA50 are about to cross upward → signal of short-term recovery.
• RSI is rebounding from the 30 zone → selling pressure has weakened.
Pattern:
• The U.S. session bottom has formed → price is retesting the trendline and building a new bullish structure.
• Scenario: a pullback to the trendline followed by a bounce.
RESISTANCE: 4,229 – 4,241 – 4,264
SUPPORT: 4,206 – 4,194 – 4,186
3. Yesterday’s Market (03/12/25):
• Gold moved sideways gently within a 45-dollar range.
→ The bearish structure was rejected and left a long wick → a signal that buyers have returned.
4. Trading Strategy for Today (4/12/25):
🪙 SELL XAUUSD | 4232 – 4230
SL: 4236
TP1: 4224
TP2: 4218
🪙 BUY XAUUSD | 4171 – 4173
SL: 4167
TP1: 4179
TP2: 4185

Perfectly captured the intraday gold price trend!Gold Technical Analysis: Gold's volatility today was smaller than expected. It opened near 4200, rebounded, weakened and pulled back after approaching 4230, then rebounded again near 4194. The overall range was less than $50. Recent gold price movements have been volatile, mainly due to the approaching Fed rate cut, market volatility from economic data and official speeches, leading to poor continuity in gold's price action. However, any significant pullbacks have been followed by rapid rebounds. Furthermore, the rising expectation of a rate cut continues to provide support for gold. Therefore, we have been sharing a buy-on-dips strategy recently, and today's opportunities for both long and short positions were accurately captured. Those who are currently out of the market can continue to enter long positions on pullbacks.
On the hourly chart, gold's current trend is one of upward oscillation. During the US session, consider a buy-on-dips strategy around 4200-4180. If the previous high of 4250-4260 resistance fails to hold, then consider shorting. Plan your trade, trade your plan. There are no gods in this world; it's just a matter of seeing one step ahead. In summary, today's gold trading strategy is to primarily buy on dips and secondarily sell on rallies. The key resistance level to watch in the short term is around 4250-4260, and the key support level is around 4200-4180. Please keep up with the pace.

Gold Extends Rally Toward New Highs as Fed Cut Bets IncreaseGold Extends Rally Toward New Highs as Fed Cut Bets Increase
We are following gold from 4030 to the current price and the price has already reached our first major target at 4150.
Currently, gold came out of a strong area near 4130. We can also see that Gold wanted to fall again but stopped near 4110.
After the weaker-than-expected US PPI data, the market is expecting a possible rate cut from the FED meeting in December, thus increasing the chances of gold rising further.
Volume is still low but it may increase during the coming days. Gold appears poised to reach 4,230 and 4,290.
Our analysis did not change because there is nothing to change :)
You may find more details in the chart!
Thank you and Good Luck!
❤️PS: Please support with a like or comment if you find this analysis useful for your trading day❤️

BUY ZONE
✅ BUY SIGNAL – XAUUSD
Signal: BUY
Entry Zone: 4201 – 4207 (marked BUY ZONE on chart)
Reason: Price has retraced into a fresh demand zone after a bullish impulse move. Current candles show slowing bearish momentum, indicating potential continuation to the upside.
Targets:
TP1: 4215
TP2: 4222
TP3:4230
Stop-Loss: Below zone at 4195
Bias: Bullish as long as price holds above the demand zone.

XAUUSD / GOLDGold highlighting a potential bullish continuation setup after a period of consolidation.
Over the past several sessions, price has broken out of a descending trendline, transitioning from a bearish phase into a more constructive, upward-leaning structure. Following the breakout, Gold has consistently respected a newly formed ascending trendline, which now acts as dynamic support.
Multiple horizontal demand zones (grey areas) can be seen beneath the current price, showing where buyers previously stepped in. Price retraced into one of these demand zones and bounced, suggesting ongoing buying interest. After reclaiming this zone, Gold has been forming higher lows, signalling growing bullish momentum.
The chart also displays a projected bullish path, where price may experience a small pullback into the ascending trendline before making another upward impulse. Two clearly marked TARGET zones above the current price indicate potential take-profit areas if bullish momentum continues. These targets align with previous supply zones where price has reacted strongly in the past.
The green shaded region represents the buying area and profit zone, showing the anticipated move toward the upper resistance zone around 4,225. The red region underneath marks the risk zone (stop-loss area), highlighting the level where the bullish setup would be invalidated if price falls below it.
Overall, the chart communicates a structured and disciplined bullish setup:
✔ A breakout from the downtrend
✔ Support formed at an ascending trendline
✔ Demand zones holding
✔ Bullish targets identified ahead
This provides traders with a clear framework of how price may behave if the trend continues upward while also defining the risk in case the market reverses.
If you find it helpful please like and comments for this post and share thanks.

Excellent week closingAs discussed throughout my morning's commentary: 'My position: I have engaged multiple Buying orders throughout yesterday’s session on #4,151.80 test and even though Volume was almost non-existent, I was well aware that Gold is Trading within Ascending Triangle and ready to deliver upside break-out. I have kept my order and on market opening Gold delivered slow but steady break1-out of #4,167.80 Resistance and I closed my set of aggressive Buying orders on #4,172.80 extension. I have re-Bought Gold this morning with #4,167.80 entry point and will continue Buying Gold from my key entry points. Congratulations on Profits and have a great weekend!'
My position: I have waited for Gold to deliver decent pullback and I found such on #4,185.80 Support test. I have engaged big Lot set of Buying orders (#4,177.80 Stop) and closed my orders on #4,202.80 extension. I will use this chance to congratulate Traders who followed my calls and had patience to hold the orders, well done / enjoy the Profits and have a great weekend!

Gold SELL SetupGold has tapped a major supply zone while forming a rising wedge, showing clear bullish exhaustion. Rejection from this zone signals a potential reversal. If price fails to break above the resistance, a sharp downside move is expected once the wedge breaks.
selling at 4205 level with reversal confirmation
TVC:GOLD

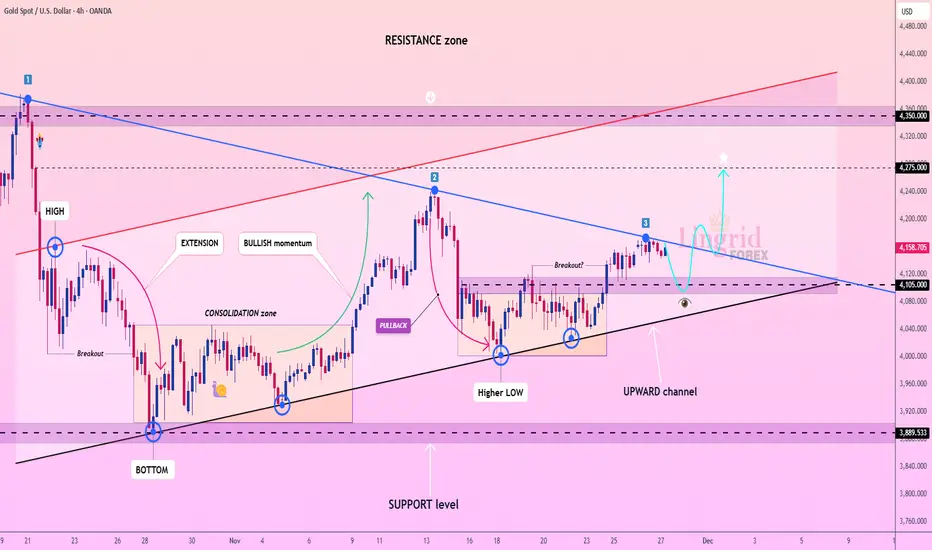
Lingrid | GOLD Trendline Break - Price AccelerationOANDA:XAUUSD is testing the downward trendline for the third touch, a historically significant point where price often attempts a breakout. The market structure has been steadily building higher lows from the 3,900 support level, while buyers continue to defend the bottom of the upward channel. Current consolidation just above 4,100 suggests accumulation rather than exhaustion, especially after price already produced a clean rebound from the channel floor.
If TVC:GOLD breaks and holds above major trendline, momentum may accelerate quickly toward 4,275, the mid-resistance barrier inside the broader supply zone. A successful continuation above this mark opens the way for a deeper squeeze, where major liquidity sits. With USD volatility cooling and safe-haven demand stabilizing, the bullish scenario remains favorable as long as price maintains bullish structure.
➡️ Primary scenario: breakout above trendline → continuation toward 4,275.
⚠️ Risk scenario: failure at trendline → drop back toward 4,000 support.
If this idea resonates with you or you have your own opinion, traders, hit the comments. I’m excited to read your thoughts!
Gold Buyers Regain Momentum — Aiming for 4,240 RetestHello traders! Let’s break down the current XAUUSD structure. Gold is trading within a broad ascending structure after forming a strong local bottom around the Support Line, where buyers entered the market and started to push the price higher. This upward movement follows a long corrective phase, during which the price respected the diagonal Support Line multiple times — confirming the presence of a stable bullish trend. Earlier, XAUUSD broke out of the Buyer Zone (4,110–4,120), retested it, and successfully held above it. This zone now acts as a key demand area and the primary level where buyers continue defending the trend. A previous bearish attempt failed here, forming a fake breakout and leading to a new bullish impulse. The price is now approaching the descending Resistance Line, which has repeatedly pushed gold lower during the recent correction. A clean breakout above this trendline may open the way for the price to move toward the major Resistance Level at 4,240.00, which also aligns with the first take-profit area (TP1). This Resistance Level has acted as a strong reaction zone multiple times, causing sharp pullbacks and marking the boundaries of the Seller Zone. Buyers will likely face significant opposition here once again. If gold respects the Buyer Zone and maintains trading above 4,110, the bullish scenario remains intact, and the price may push toward TP1 → 4,240. A confirmed breakout above this level would signal continuation toward higher targets within the broader bullish structure. However, if XAUUSD fails to hold the Buyer Zone and breaks below 4,110, the bullish outlook becomes invalid. In this case, the price may revisit the lower trendline or enter a deeper correction toward previous support areas. For now, the structure remains moderately bullish, with buyers dominating as long as the price stays above demand and respects the ascending Support Line. Please share this idea with your friends and click "Boost" 🚀

GOLD: Bullish Above 4151 as Fed Cut Odds Hit 80%FX:XAUUSD is trading above 4151, supported by a weaker U.S. dollar and rising expectations of Federal Reserve policy easing.
Recent U.S. data added to this momentum:
-PPI inflation showed signs of slowing
-Retail sales and consumer confidence came in weaker
-Market expectations for a December Fed rate cut have climbed to 80%
However, progress in Russia–Ukraine negotiations is capping aggressive upside movement.
Today, markets focus on jobless claims and durable goods orders, both of which could shape short-term volatility.
Gold is holding steadily above 4151, which supports continuation of the bullish momentum toward 4172 and 4207.
A breakout above 4207 would open the path toward 4236–4237.
If the price closes a 1H candle below 4150, a correction toward 4128 is expected.
Pivot Line: 4151
Resistance: 4172 · 4207 · 4236
Support: 4140 · 4128 · 4113

Gold on excellent break-outAs discussed throughout my yesterday’s session commentary: “ My position: After Profiting on multiple Medium-term Buying orders, I have turned now to more Intra-day calls as announced and am Buying Gold literally from #4,138.80 on multiple occasions and will continue to do so, and will Buy Big if #4,130.80 is delivered. I will not Sell Gold and my practical suggestion is to not Sell Gold at all costs.”
My position : I have engaged multiple Buying orders throughout yesterday’s session on #4,151.80 test and even though Volume was almost non-existent, I was well aware that Gold is Trading within Ascending Triangle and ready to deliver upside break-out. I have kept my order and on market opening Gold delivered slow but steady break1-out of #4,167.80 Resistance and I closed my set of aggressive Buying orders on #4,172.80 extension. I have re-Bought Gold this morning with #4,167.80 entry point and will continue Buying Gold from my key entry points. Congratulations on Profits and have a great weekend!

Decent Profits on re-Buy ordersAs discussed throughout my yesterday’s session commentary: “ My position: After Profiting on multiple Medium-term Buying orders, I have turned now to more Intra-day calls as announced and am Buying Gold literally from #4,138.80 on multiple occasions and will continue to do so, and will Buy Big if #4,130.80 is delivered. I will not Sell Gold and my practical suggestion is to not Sell Gold at all costs.”
My position : I have engaged multiple Buying orders throughout yesterday’s session on #4,151.80 test and even though Volume was almost non-existent, I was well aware that Gold is Trading within Ascending Triangle and ready to deliver upside break-out. I have kept my order and on market opening Gold delivered slow but steady break1-out of #4,167.80 Resistance and I closed my set of aggressive Buying orders on #4,172.80 extension. I have re-Bought Gold this morning with #4,167.80 entry point and will continue Buying Gold from my key entry points. Congratulations on Profits and have a great weekend!

GOLD (1H) – Bullish Continuation Above Support | Premium Market GOLD (1H) – Bullish Continuation Above Support | Premium Market Structure
Gold delivered a strong impulsive rally and is now holding elegantly above a clean support zone. Price behaviour suggests controlled accumulation, with buyers defending structure after the expansion.
Key Zones
Support Zone 1: 4210–4220
Support Zone 2: 4175–4185
Resistance: 4335–4340
Market Structure
The current retracement remains shallow, maintaining higher-low structure. Price has reacted exactly at the first support zone, signalling strength. A sustained break above 4240 may open room for a continuation into the 4330+ resistance band.
Bias
📈 Bullish as long as 4210 holds.
Liquidity is still intact and orderflow favours another leg higher.
Potential Setup (Not Financial Advice)
Entry Zone: 4215–4230
Targets: 4310 / 4335
Invalidation: Below 4175
Summary
Gold retains a premium bullish structure. Support is respected, liquidity protected, and continuation potential remains high unless deeper displacement occurs.
Disclaimer: Educational analysis only.

Gold - This bullrun is now over!🚨Gold ( TVC:GOLD ) won't create new highs:
🔎Analysis summary:
All the way back in 2019, Gold confirmed its rounding bottom formation. This breakout was then followed by a major rally of about +200% over the past couple of years. But at this moment, Gold is retesting a major resistance trendline and will therefore end its bullrun.
📝Levels to watch:
$4,200
SwingTraderPhil
SwingTrading.Simplified. | Investing.Simplified. | #LONGTERMVISION

Accumulated price increase - bulls expect rate cut⭐️GOLDEN INFORMATION:
Expectations of further Fed rate cuts and inflation still above target continue to underpin gold and silver, said David Meger, director of metals trading at High Ridge Futures.
However, China’s physical gold demand has weakened at elevated price levels, which could weigh on the metal. According to the Financial Times, major retail chains have scaled back their presence in mainland China this year, while smaller sellers report that soaring prices and higher taxes have severely hurt sales.
⭐️Personal comments NOVA:
Gold price took H1 4193 breakout liquidity and reacted bullishly, still maintaining the uptrend, continuing to expect December rate cut
⭐️SET UP GOLD PRICE:
🔥SELL GOLD zone: 4274 - 4276 SL 4281
TP1: $4260
TP2: $4245
TP3: $4230
🔥BUY GOLD zone: 4145 - 4143 SL 4138
TP1: $4160
TP2: $4175
TP3: $4190
⭐️Technical analysis:
Based on technical indicators EMA 34, EMA89 and support resistance areas to set up a reasonable BUY order.
⭐️NOTE:
Note: Nova wishes traders to manage their capital well
- take the number of lots that match your capital
- Takeprofit equal to 4-6% of capital account
- Stoplose equal to 2-3% of capital account

SELL NOW XAUUSD
🔻 SELL SIGNAL – XAUUSD (Gold USD)
📍 Entry: 4,205.35
🛑 Stop-Loss: 4,215.29
🎯 Take-Profit: 4,183.90
Description:
Price rejected resistance and formed a lower high. Bearish momentum continues after a breakdown from the recent uptrend. Expect further downside if the candle closes below the entry level.

Selena | XAUUSD 2H — Bullish Continuation SetupFOREXCOM:XAUUSD
Market Overview
Price has built liquidity through multiple sweeps and consolidations, suggesting a possible continuation phase. If price retests the demand zone and holds, buyers may step in to push toward upper structure resistance levels.
Key Scenarios
✅ Bullish Case 🚀
If price holds above 4,157 zone
→ 🎯 Target 1: 4,300
→ 🎯 Target 2: 4,375–4,400 (major resistance / channel top)
❌ Bearish Case 📉
Break and close below 4,052 invalidation zone
→ 🎯 Downside Target: 4,000–3,950 support range
Current Levels to Watch
Resistance 🔴: 4,300 | 4,375–4,400
Support 🟢: 4,157 | 4,122 (demand zone)
Invalidation ⚠️: 4,052
⚠️ Disclaimer: This analysis is for educational purposes only — not financial advice.

The price of gold will rise to new highs!Gold is likely to continue bullish move where we expect price to hit around 4380 area or 4400. This our intraday approach and before our sell entry get activated which will be our swing entry. There is only one target for this setup which is 4390$. You can adjust stop loss and take profit based on your own view.

Gold1) Daily Bias: Buy
2) Setup: EW
reason:
a) H1- Correction Wave ( Wave 4)
3) Confirmation entry:
a) H4/H1-trendline & above green line
b) H4/H1-fvg
c) Momentum Candle
4) Minimum Risk : Reward= 1:3

XAUUSD(GOLD): View Remain The Same Major Swing Sell! Gold dropped to $4030 today, filling up the liquidity gap. However, it reversed nicely. Looking at smaller time frames, we notice heavy selling pressure, which is likely to push the price down towards our target one or two, if fundamentals support the view. Furthermore, we believe the price still has a high chance of going around our top entry around $4380. That area remains a key level if the trend is bearish in the longer term. We advise you to wait for further correction before making any decisions.
Good luck and trade safely!
Team Setupsfx_🏆❤️

GOLD ANALYSIS What’s Moving the Market Today? November 28, 2025OANDA:XAUUSD GOLD ANALYSIS What’s Moving the Market Today? (November 28, 2025)
Welcome back to Trade with DECRYPTERS, where we decode smart-money footprints into clean, actionable buy & sell zones.
Keep it simple trust the levels, follow the plan.
*📰 Market Overview*
Gold continues to hold strong inside the rising channel after reacting beautifully from the Smart Money Buy Orders (4086–4099) the exact zone that ignited the latest impulsive push. Despite a firmer USD rotation earlier in the week, buyers have returned aggressively as volatility compresses near equilibrium.
The Dollar Index remains anchored near the 100.20 region, limiting aggressive upside continuation but still allowing steady bullish rotation fueled by geopolitical uncertainty and consistent central-bank demand.
With high-impact macro data delayed due to the recent U.S. government shutdown, markets are positioning cautiously ahead of the December FOMC, keeping gold in a structured premium discount cycle.
*🔍 Key Fundamentals Driving Today’s Move*
📈 DXY steady near 100.20 → caps bullish momentum temporarily
🏦 Fed divided on rate cuts → softer expectations for December
🌍 Geopolitical tensions remain elevated → Middle East & Ukraine risk premium
🏛 Central banks continue accumulating → long-term bullish foundation
📊 ETF inflows cool → controlled month-end profit-taking
The push-and-pull between a cautious Federal Reserve and persistent global uncertainty keeps gold rotating cleanly between your smart-money levels.
*📆 What’s Ahead Key Events to Watch*
🔸 Flash PMIs — This Week
Manufacturing expected near 49
Services around 51
Weak PMI → boosts cut expectations → gold bullish
Strong PMI → DXY lift → gold retests demand zones
🔸 US Q3 GDP & Jobless Claims
First major releases after the data backlog.
Strong GDP = delays cuts → pullback into buy zones
Weak data = safe-haven flows → bullish continuation
🔸 FOMC Meeting — December 16
Market sees a pause, but weak labor prints could revive hopes for a 25bp cut.
Hawkish tone → tests 4146 EQ → 4099 → 4086
Dovish tone → pushes 4165 → 4219 → 4244
🔸 Geopolitical Premium
Any escalation = instant safe-haven spike
Calm + strong USD = controlled retracements
*🟩 GOLD TECHNICAL LEVELS*
Gold continues to respect the rising channel, tapping premium zones for sells and discount zones for accumulation.
The latest impulsive move from 4086–4099 has lifted price into the next liquidity zone around 4146–4165, matching your structural breakout.
*🎯 EQUILIBRIUM (EQ): 4144 – 4148*
This is today’s directional pivot.
✔️ Hold Above EQ
Momentum strengthens toward:
➡️ 4165 → 4184 → 4219
✔️ Drop Below EQ
Weakens flow toward:
➡️ 4099 → 4086
Deep sweep possible if macro data disappoints.
*🟩 📌SMART MONEY BUY ORDERS: 4086 – 4099*
Your primary institutional demand zone.
Perfect for:
✔️ Intraday dip-buys
✔️ First-tap reactions
✔️ Discount rotations inside the channel
A clean break below opens liquidity toward 3955–3964.
*🟩 📌 SCALP BUY AREA: 4147 – 4137*
Your micro-discount reaction area.
Expect:
✔️ Fast scalps
✔️ Partial liquidation
✔️ High-volatility wicks
Deep sweeps toward here usually appear only during macro-driven flushes.
*🟥 📌 SCALP SELL AREA: 4184 – 4196*
Consistent intraday rejection zone.
Ideal for:
✔️ Low-risk scalping shorts
✔️ Liquidity grabs
✔️ Wick-heavy reactions
A clean break above 4196 opens path into major distribution.
*🔺 📌 SMART MONEY SELL AREA: 4219 – 4244*
Your main institutional distribution block.
Expect:
✔️ Manipulation wicks
✔️ Stop-hunt behavior
✔️ Swing-level reversals
A break & hold above 4244 = continuation into 4279–4293.
*📌 Conclusion*
Gold continues to rotate smoothly between premium and discount zones, with 4144–4148 EQ acting as the decisive intraday pivot. A sustained hold above this level favors continuation into 4184–4196 and the 4219–4244 distribution block, while rejection brings price back toward 4099–4086 for fresh accumulation. With delayed macro data and elevated geopolitical tensions shaping sentiment, expect controlled, level-to-level movement driven by smart-money flow. Stay disciplined and trade only where liquidity is building.
Stay patient.
Execute only where smart money is active.
Let the levels do the work.
*🙌 Support the Analysis*
If this helps your trading, show some support with likes & comments it motivates deeper daily breakdowns.
Share your charts, levels, and predictions. Let’s grow together.
Best Regards,
M. MOIZ KHATTAK | Founder TRADE WITH DECRYPTERS
