Gold Builds Bullish Momentum After Liquidity SweepGold Market Analysis — Bullish Momentum After Liquidity Sweep
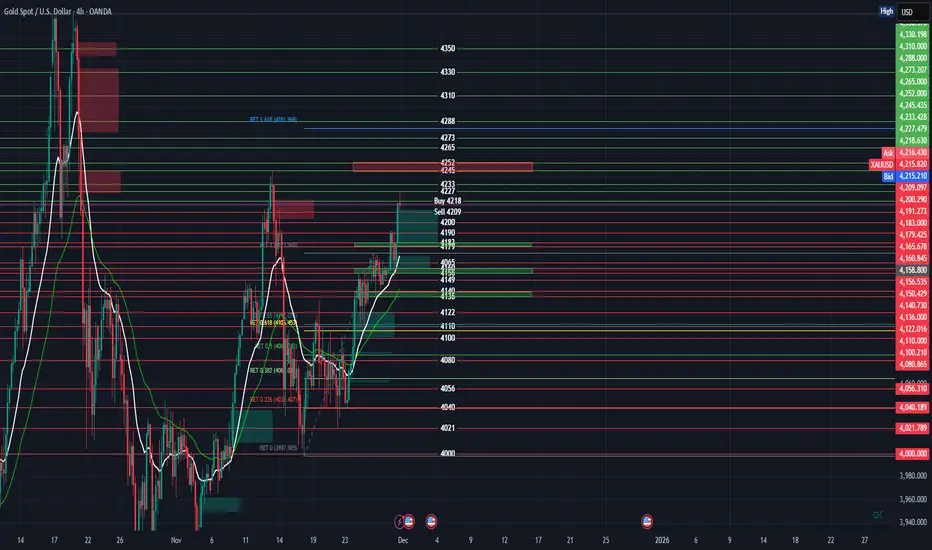
Gold is currently trading around the 4190 area, holding steady after sweeping liquidity near today’s low around the 4174 support zone. This reaction shows renewed bullish strength, as price recovered quickly from the downside liquidity grab.
My key levels remain:
Support: 4174
Resistance: 4216
Bullish Target: 4250
As long as gold continues forming higher lows above support, the bullish structure stays intact. A clean break above 4216 may open the path toward the 4250 region.
This analysis is shared only for learning and discussion, based on market structure and price behavior.
Trade ideas

1203 Gold (XAUUSD) 4-Hour Chart Trading Plan for EU/US SessionsHello there,
The bearish butterfly pattern has been confirmed (Point D at 4260). The high liquidity during the London Session amplifies price fluctuations. For the EU/US sessions, focus on short positions when prices face resistance at key levels. Long positions are not recommended. Strictly adhere to pattern rules and stop-loss disciplines.
I. Confirmation of Pattern and Market Environment
1. Core Structure of the Bearish Butterfly Pattern
• The complete X-A-B-C-D structure has been formed. Point D (4260) serves as the pattern's reversal high, meeting the requirements of the 1.618 extension of the XA segment and the 1.618 extension of the CD segment.
• Key Ratio Verification: The AB segment retraces 78.6% of the XA segment, the BC segment retraces 38.2% of the AB segment, and the CD segment precisely reaches the 1.618 extension of the BC segment, indicating high pattern validity.
2. Characteristics of the London Session
• It is currently the post-opening period of the London Session. Market liquidity surges (daily trading volume exceeds 200 billion USD), leading to expanded price volatility and a higher likelihood of rapid stop-loss hunting. However, this also provides clear signals for pattern confirmation.
• The London Session is the "direction-setting phase" for EU/US session trends. Focus on capital game signals at the pattern's key levels.
II. Key Support and Resistance Levels (Combined with Pattern + Fibonacci)
• Core Resistance: 4226-4242 range (0.382-0.5 retracement of the D-C segment, a critical resistance zone for pattern confirmation).
• Primary Support: 4155 (Fibonacci 0.5 + pattern-equivalent support level of Point C).
• Secondary Support: 4128 (Fibonacci 0.618 + 0.618 equivalent of the XA segment, a classic target level for the butterfly pattern).
III. EU/US Session Short Trading Strategy (Sole Direction)
1. London Session Entry (Priority Option)
• Entry Condition: Prices rebound to test the 4226-4235 range, accompanied by bearish signals such as bearish engulfing candlesticks or MACD divergence.
• Entry Price: Enter positions opportunistically within the 4226-4230 range.
• Stop-Loss Setting: 4270 (10 pips above the high of Point D to avoid pattern invalidation risks, in line with butterfly pattern stop-loss rules).
• Target Plan:
• Primary Target: 4155 (reduce 50% of positions upon reaching, and adjust stop-loss to break-even).
• Secondary Target: 4128 (hold the remaining positions; do not exit early without additional signals).
2. London Session Direct Breakdown Entry (Supplementary Option)
• Entry Condition: Immediately after the London Session opens, prices break below 4200 and confirm the trend continuation with a closing bearish candlestick.
• Entry Price: Lightly chase short positions within the 4195-4200 range.
• Stop-Loss Setting: 4215 (pullback resistance level after the breakdown to control stop-loss hunting risks during the London Session).
• Target Plan: Consistent with the priority strategy (4155 → 4128).
3. US Session Entry (Complementary Option)
• Entry Condition: No entry signals appear during the London Session; prices fluctuate between 4200-4226 before the US Session opens, and do not break above 4242 after the release of ADP data.
• Entry Price: Enter positions within the 4215-4220 range.
• Stop-Loss and Targets: Consistent with the priority strategy.
IV. Risk Control and Response to Pattern Invalidation
• Pattern Invalidation Criterion: If prices break above 4270, it indicates that the reversal at Point D is invalid and the butterfly pattern has collapsed. Immediately cease all short-position operations for the day and wait for the pattern to reorganize.
• Data Risk Response: After the release of the evening ADP data, if gold surges and breaks above 4242, strictly exit short positions upon hitting the stop-loss; do not hold positions against the trend.
• London Session Discipline: Avoid aggressive entries within the first 30 minutes after the opening. Wait for 1-2 4-hour candlesticks to confirm the direction and avoid false signals amid high liquidity.
V. Position Management Rules
• Position Control: The size of a single entry should not exceed 10% of total capital to avoid excessive concentration of risks.
• Stop-Loss Execution: Immediately exit positions when the stop-loss level is hit; do not adjust the stop-loss to expand risks.
• Target Adjustment: If the 4155 support holds and triggers a valid rebound, the remaining positions can be held until reaching 4128 without taking profit midway.
GOOD LUCK!
LESS IS MORE!

Gold Support Reaction – Watching for Possible Upside MovePrice is testing support inside the channel. I am watching for a possible bullish reaction as long as this zone holds.
This is not financial advice—only my personal market outlook. Manage risk according to your plan.

Accumulation and recovery - resistance 4275⭐️GOLDEN INFORMATION:
Gold (XAU/USD) extends Tuesday’s rebound from the $4,164 zone in Wednesday’s Asian session, gaining fresh momentum and edging back toward Monday’s two-week high. The metal remains supported by expectations of another Fed rate cut next week, while speculation about a dovish successor to Chair Powell keeps the US Dollar subdued near a two-week low, further boosting the non-yielding asset
⭐️Personal comments NOVA:
Buying power remains above 4200, gold price recovers and grows. The market is waiting for today's ADP-NF results to continue increasing in price.
⭐️SET UP GOLD PRICE:
🔥SELL GOLD zone: 4275 - 4277 SL 4282
TP1: $4260
TP2: $4245
TP3: $4230
🔥BUY GOLD zone: 4193 - 4191 SL 4186
TP1: $4208
TP2: $4220
TP3: $4235
⭐️Technical analysis:
Based on technical indicators EMA 34, EMA89 and support resistance areas to set up a reasonable BUY order.
⭐️NOTE:
Note: Nova wishes traders to manage their capital well
- take the number of lots that match your capital
- Takeprofit equal to 4-6% of capital account
- Stoplose equal to 2-3% of capital account

Gold 30-Min — Volume Buy & Sell Reversal Triggered⚡Base : Hanzo Trading Alpha Algorithm
The algorithm calculates volatility displacement vs liquidity recovery, identifying where probability meets imbalance.
It trades only where precision, volume, and manipulation intersect —only logic.
✈️ Technical Reasons
/ Direction — LONG / Reversal 4218 Area
☄️Bullish momentum confirmed through strong candle body.
☄️Structure shifted with higher-low near key demand base.
☄️Volume expanding confirms order-flow alignment upward.
☄️Buyers reclaimed imbalance with sustained clean break.
☄️Algorithm detects rising momentum under low liquidity.
✈️ Technical Reasons
/ Direction — SHORT / Reversal 4325 Area
☄️Bearish rejection confirmed through sharp candle body.
☄️Lower-high forming beneath resistance supply region.
☄️Volume decreasing confirms exhaustion in price rally.
☄️Sellers regained imbalance with heavy top rejection.
☄️Algorithm detects fading demand and shift to control.
⚙️ Hanzo Alpha Trading Protocol
The Alpha Candle defines the day’s real control zone — the first battle of momentum.
From this origin, the Volume Window reveals where the next precision strike begins.
⚙️ Hanzo Volume Window / Map
Window tracked from 10:30 — mapping true market behavior.
POC alignment exposes institutional bias and breakout potential zones.
⚙️ Hanzo Delta Window / Pulse
Delta window monitors real buying vs. selling power behind each move.
Tracks volume aggression to expose who controls the candle — buyers or sellers.
When Delta aligns with Volume Map, momentum becomes undeniable.

XAU / USD 4 Hour ChartHello traders. Been a week or so since I took a trade or posted a chart. Been spending time buying dips on BTC and ETH. So I am looking to see if a scalp postion comes around in either direction. Watching the current 4 hour candle. I will see how the overnight session bring. This is just an idea, and not a reason to take a trade. DYOR before clicking that button. Nothing worse than being a new trader, using leverage and taking a trade in hopes that it goes your way, that is not trading that is gambling. Be well and trade the trend. Let's see how things play out. Big G gets a shout out. I will not be renewing my subscription on tradingview when it is up in a few months. Thanks for these last few years, it's been a wild, amazing ride.

GOLD DAILY Gold (XAU/USD) – Technical Analysis (Daily Chart)
1. Main Trend
Gold has been in a strong bullish uptrend for several months.
The price is trading above the:
50-day MA (green)
100-day MA (red)
200-day MA (blue)
This confirms long-term bullish structure.
However, recently the trend has shifted into sideways consolidation after reaching a peak.
2. Current Market Behavior
Consolidation Range
Price is moving inside a large horizontal range, shown in the big orange box.
Several wicks and choppy structure indicate market indecision.
The consolidation started after hitting the high near 4381–4384.
Repeated Rejection at Resistance
The horizontal resistance zone at ~4380–4390 has rejected price multiple times.
This increases the probability of a bearish correction.
3. Fibonacci Levels
The chart includes various Fibonacci retracement levels:
0.25 (4195)
0.5 (3861)
0.75 (3602)
1.0 (3342)
These levels mark potential support zones where price could retrace during a correction.
4. Bearish Setup
The drawn short position shows a planned move:
Entry: near the top of the consolidation
Stop-loss: above the resistance
Target: near the 0.75 to 1.0 Fibonacci zone (3600–3340)
Risk/Reward
The R/R ratio is 6.64, meaning the expected reward is significantly higher than the risk.
Bearish Projection Path
The drawn red path suggests:
Initial drop from resistance
A small bounce
A strong continuation downward
A deeper correction reaching the lower green support zone
Final reversal upward from major support
This scenario is expected to unfold over 28 bars (40 days).
5. Support Zones
Key support areas are highlighted:
3600 – 3860 → first major support
3340 – 3400 → final deep support (target zone)
The green box shows the projected landing zone for the bearish movement.
6. Momentum Indicator
The histogram at the bottom shows declining bullish momentum.
This often appears before a trend reversal or correction.
7. Summary of Interpretation
Gold reached a major top and has entered consolidation.
Resistance remains very strong at 4380–4390.
A bearish correction is likely, potentially deep.
The chart projects a multi-wave drop over the next 40 days.
Long-term trend stays bullish, but a short-term drop is expected.

Gold weekly chart (4 hour) with buy and sell entriesChart Overview: XAU/USD 4-Hour
Current Trend: The market is in a corrective phase (bearish pullback) following an aggressive parabolic rally to a high of ~4381.
Momentum: Bearish. The White Moving Average (likely a shorter period, e.g., 20 or 50) has crossed below the Green Moving Average (likely a longer period, e.g., 200), signaling downward momentum.
🔴 Potential Sell Entries (Red Zones)
Major Resistance / Supply Zone: 4245.00 - 4252.00
Technicals: This red shaded box represents a Bearish Order Block (Supply Zone). Price previously broke down from this level with impulsive red candles, leaving trapped buyers. When price retraces to this area, these buyers often sell to break even, and institutional sellers reload shorts.
Secondary Sell signal (Text on chart): The label "Sell 4209" suggests a breakout trade. If price loses the 4209 local support, it confirms a continuation of the lower-low structure.
Suggested Take Profits (TP):
TP 1: 4165 (First Green Zone)
TP 2: 4136 (Second Green Zone)
TP 3: 4105 (0.618 Fibonacci Golden Pocket)
🟢 Potential Buy Entries (Green Zones)
Zone 1: 4160.00 - 4165.00
Technicals: This is the first area of structural support. It aligns with previous consolidation tops before the massive breakout. It acts as a "flip zone" (resistance turned support).
Zone 2: 4136.00 - 4140.00 (Stronger Support)
Technicals: This is a stronger Demand Zone. It sits just above the significant Fibonacci levels. If the correction deepens, this is the area where institutional algorithms often step in to defend the larger uptrend.
Text Signal "Buy 4218": The label "Buy 4218" on your chart suggests a momentum reversal trade—essentially waiting for the price to reclaim the immediate resistance before going long.
Suggested Take Profits (TP):
TP 1: 4210 (Local deviation)
TP 2: 4245 (Testing the bottom of the Red Supply Zone)
TP 3: 4280 (continuation of trend)
Summary Strategy
Short Term: The bias is Bearish as long as price is below the Moving Average crossover. Look for rejections at the 4245 red box to Sell.
Medium Term: Watch for bullish reversal patterns (doji, hammer candles) inside the green 4136 - 4165 zones to catch the next leg up of the macro bull run.
Gold Pending Buy -4154 -4145 range target 4209expecting buy gold from 4154 to 4145 range,
Goldbach number
Goodluck

GOLD Demand Zone Rejection & Bullish Reversal pullback Price is retesting the strong demand zone 4195 4190 and showing signs of a potential bullish reversal toward the upper supply area 3240 4245

XAU/USD – Long on pullback in structural uptrendW1 uptrend very strong, dovish Fed, clear D1 supports; estimated WR ~60%, R:R ≈ 2:1
Direction: Long
Time Horizon: 3–8 weeks
Setup Type (Scenario): Return to key support + trend continuation
Main Motivation (Macro/Fundamental)
Gold near all-time highs, ~+60% Y/Y, with 2025–26 targets from various investment banks revised upwards (4,500–5,000 area).
Implied probabilities of a Fed rate cut in December >80% compress US real yields and weaken the dollar → structurally bullish context for gold.
Relatively more "hawkish" ECB (on hold) and widespread geopolitical risks maintain demand for safe-haven assets.
Technical (D1/W1 + H4)
W1 Trend: clean upward channel, higher highs/higher lows; 4,000 has become psychological support.
D1: breakout and hold above old resistance at ~4,180; the 4,120–4,180 area has acted several times as a consolidation/buffer zone.
Next resistance in the 4,350–4,380 area (52W peak 4,381).
Operational Setup (indicative prices)
Entry Detail
Entry Setup (H4) Wait for a return to 4,180–4,120 $/oz. Ideal entry ~4,170 after a bullish reaction H4 candle (pin/engulfing) that closes back above 4,180.
Stop Loss (SL) 4,030 $/oz, below the cluster of recent lows and below the "4,050–4,060" threshold: if the price closes D1 below there, short-term structure broken.
Take Profit 1 (TP1) 4,450 $/oz, just below a realistic extension above recent highs (4,350–4,380) and below the psychological area of 4,500.
Risk/Reward Ratio (indicative)
Entry: 4,170
Risk: 4,170 – 4,030 = 140
Reward: 4,450 – 4,170 = 280
R:R ≈ 2.0 : 1
Operational Trigger (H4)
Setup valid only if:
XAU/USD enters 4,180–4,120;
Prints H4 rejection candle (long spike below, closing above 4,180);
In parallel, the DXY retreats and the probabilities of a Fed rate cut remain >80%.
Risk Validation (Otherwise)
Setup invalidated by a solid D1 close below 4,000 (full body, not just spike), which would open space for correction towards 3,700–3,800.
Disclaimer!!! The content of this article is for informational, educational, and entertainment purposes only. It does not constitute financial advice, investment advice, or a recommendation to buy or sell securities, cryptocurrencies, or other financial instruments. The author is not a professional financial advisor. Investing in the financial markets involves high risks, including the possible loss of all capital. Before making any investment decisions, you are strongly advised to do your own research (DYOR) and, if necessary, consult a qualified professional. The author assumes no liability for any loss or damage arising from the use of the information contained in this article.

XAUUSD Another correction below 3900 is likely.Last week (November 24, see chart below), we gave a buy signal on Gold (XAUUSD), which has already hit Target 1 at $4180 and is about to hit Target 2 at $4275:
This time we move on to the longer time-frames, namely the 1W, where Gold's 2-year Channel Up suggests that another correction is likely at this point.
The reason is the 1D MA100 (black trend-line), which Gold has hit 3 times out of the 4 corrections it has had within this 2-year pattern. October's pull-back saw it pull-back just above the 1D MA50 (red trend-line) but it didn't break, something that always happened during these past corrections.
At the same time, it is very likely to hit the 0.382 Fibonacci retracement level (has done so 2 out of 4 times) once the 1D MA100 contact is made, which gives us a medium-term Target at $3860. That would make a perfect Higher Low on the Channel Up.
Notice also how during the past 3 corrections, the 1W RSI always hit the Support Zone. If this is get hit before the price reaches $3860, it is technically a good idea to take profit earlier.
---
** Please LIKE 👍, FOLLOW ✅, SHARE 🙌 and COMMENT ✍ if you enjoy this idea! Also share your ideas and charts in the comments section below! This is best way to keep it relevant, support us, keep the content here free and allow the idea to reach as many people as possible. **
---
💸💸💸💸💸💸
👇 👇 👇 👇 👇 👇

XAUUSD How to become successful in forex and stock trading: 1.Master fundamentals and technical analysis. 2,Build and follow a solid trading plan. 3.Apply strict risk management (1–2% rule). 4.Stay disciplined—control fear and greed. 5.Record and analyze every trade. 6.Focus on high-quality setups only. 7.Diversify across assets and markets. 8.Keep evolving—study, adapt, and grow daily.

Gold has entered a short-term consolidation phase.Gold continued its wide-range fluctuations, lacking sustained momentum. The daily chart showed another surge followed by a pullback, closing above the 7-day moving average. The RSI indicator remained above the midline. The 4-hour chart maintained its alternating up and down pattern, with prices consolidating around the Bollinger Band's middle line. The 1-hour chart showed the Bollinger Bands gradually narrowing. After breaking through the 4241 high in the US session yesterday following a significantly bullish ADP report, gold retreated to around 4195, continuing its range-bound consolidation. The trading strategy for gold remains unchanged: buy low and sell high, with quick entries and exits.
Gold prices have been volatile recently, mainly due to the approaching Fed rate cut, market volatility caused by economic data and official speeches, resulting in poor momentum. However, significant pullbacks have been followed by rapid rebounds, and the rising expectation of a rate cut continues to provide support for gold. Therefore, buying on dips and waiting for a breakout to new highs is a viable strategy.
Key Levels:
First Support: 4192, Second Support: 4183, Third Support: 4166
First Resistance: 4238, Second Resistance: 4250, Third Resistance: 4277
Intraday Gold Trading Strategy:
BUY: 4180-4185, SL: 4170, TP: 4200-4210;
SELL: 4240-4245, SL: 4255, TP: 4220-4210;

XAUUSD SMC Outlook - Quick UpdateGold formed a Strong High near 4240 and later shifted downward with a clear CHOCH + BOS.
Price is currently moving around 4194, showing a pause after the drop.
What to look for next: A possible pullback toward 4200-4210. If price respects that zone, we may see continuation toward 4185 → 4160.
Market structure is leaning bearish for now - patience is key.
Caution : This is not a financial advice

XAU / USD 1 Hour ChartHello traders. Taking a look at the hourly chart, I am going to wait for gold to break and close out of the choppy mess. I will check the charts in the morning and see how the overnight sessions went. I try not to get caught up with trades when we are just ranging. Wait for volume to come in and try to ride the wave. Price action, what is happening while you trade is the best way to go and better than indicators. Be well and all my thanks goes to Big G. Let's see how the overnight sessions play out and I will post a chart before the NY open. Be well and trade the trend.

idea for buy one idea for buy . i waiting for price to go down to 4.000. for long positions . at 4.000 is a big support volume , and is a perfect zone for long positions

XAUUSD PredictDisclaimer: Not Financial Advice
The information provided is for general informational and educational purposes only and is not intended to provide specific financial or investment advice. The content presented does not take into account your personal investment objectives, specific goals, or financial situation and needs.
Accordingly, before taking any actions based upon such information, we strongly encourage you to consult with a qualified, licensed financial advisor or other appropriate professional. All investments are subject to risk, and you assume full responsibility for any loss or damage resulting from your use of or reliance on the information provided.
We are not liable for any errors or omissions in this information or for any losses, injuries, or damages from the display or use of this information.

XAUUUSD AFTER BIG FALL TAKING SAME SUPPORTXAUUSD after big fall taking same support of weekly candle 4213
Entry on 4213
Stop reference 4192
Upside target point 4260
Running still bullish channel 4040 to 4264 so gold still on near to high point of weekly candle
this is not financial advice , Chart is for educational analysis only

BUY SIGNAL – XAUUSD (GOLD)BUY SIGNAL – XAUUSD (GOLD)
Signal: BUY
Entry Zone: 4210–4215
Bias: Bullish continuation from demand zone
Reasoning:
Price has tapped the highlighted buy zone, showing rejection with bullish candles and increasing volume. Structure suggests a potential continuation to the upside toward the previous high.
Description:
Gold is reacting strongly from a fresh demand zone. A bullish reversal pattern has formed, indicating buyers are stepping in. Buying within the 4210–4215 zone offers a favorable risk-to-reward opportunity toward higher resistance levels.

XAUUSD – Liquidity Grab Done, Bearish Continuation ExpecteGold (XAUUSD) – Bearish Retracement After Buy-Side Liquidity Sweep
Price has tapped into a major buy-side liquidity zone, clearing the previous highs and triggering liquidity grab. After the sweep, market structure shifted and price started forming a clean descending channel, showing controlled bearish momentum.
Currently, price has pulled back into the premium retracement zone, aligning with the channel’s upper boundary — a strong confluence for a potential short setup.
If the bearish structure continues, I am expecting:
Short-term retracement + bearish continuation
Targeting the next demand imbalance zone marked on the chart
A deeper drop toward the 4,155 – 4,160 zone where strong buy orders may appear
Reasons for Bearish Bias:
• Buy-side liquidity already cleared (reversal signal)
• Clear bearish channel structure
• Retest of broken structure + premium zone
• Multiple imbalance zones below waiting to be filled
This idea remains valid as long as price stays below the highlighted rejection area.

XAUUSD Sell Signal – H1 Chart
📌 XAUUSD Sell Signal – H1 Chart
Entry: 4,252 – 4,254
Stop Loss: 4,256.7
Take Profit: 4,240 – 4,242
📝 Trade Idea Description
Price has reached a **fresh supply zone** after a strong bullish rally. The last candle shows rejection wicks into the resistance area, signaling buyer exhaustion
Additional confirmations from the chart:
✔️ Strong upward impulse → now slowing down
✔️ Lower volume at the top → weakening bullish pressure
✔️ Bearish candle forming inside supply zone
✔️ Market could pull back to retest previous support structure around 4,240 zone
🎯 Strategy Logic
Counter-trend pullback setup
Expecting a correction from the overextended top
Risk-to-Reward ratio: 1:3+ potential
🔔 Signal Status
⏳ Active – Manage risk carefully
❌ Invalidate if price **closes above supply zone**
If you'd like, I can also:
📍 Mark your entry, SL & TP clearly on the chart
📈 Send you updated signals as price develops
🤖 Backtest and optimize this strategy
Would you like me to create a long-term bias overview for Gold as well?

XAU/USD – Top Sweep Completed, Price Now Distributing Inside the📊 Market Structure
• After a strong bullish leg, Gold formed a clear Liquidity Sweep at the highs around 4,261 USD (Fibo Sell) , taking out all liquidity above that zone.
• From that high, price gradually weakened and printed a bearish ChoCH (loss of buying pressure; short-term structure no longer clean).
• Price is currently trading inside the premium zone between 4,190 – 4,241:
– 4,241 = Fibo Sell / liquidity extreme .
– 4,225 – 4,216 = lower premium zone , likely to react before retesting the highs.
– 4,190 = Liquidity Sweep + short-term support : only if price breaks below and retests from underneath will this zone flip into resistance for SELL continuation.
⇒ Current picture: short-term bearish bias , but sells should come from the premium zones (4,216–4,241) or only after a confirmed break of 4,190 — avoid chasing mid-range.
💎 Key Technical Zones
• Fibo Sell Zone: around 4,241.451 → optimal extreme for hunting SELL setups.
• Reaction Levels:
– 4,225.474
– 4,216.171
• Liquidity Sweep Support: 4,190.485 → main short-term support.
• Support / TP Zones:
– 4,163.586
– 4,155.294 (old OB)
– 4,142.755
– 4,116.058 (deeper low – extended target)
🎯 Trading Plan – SELL Priority From Premium
1️⃣ Primary SELL – Fibo Sell 4,241 & Premium 4,225–4,232
Ideal scenario: price retraces into the upper premium zone and prints a clear rejection signal (pin bar / engulfing / rejection volume).
• Entry 1: 4,225 – 4,232 (first scale-in)
• Entry 2: 4,235 – 4,241 (add if price sweeps higher)
• Stop Loss: above 4,250
• TP1: 4,190
• TP2: 4,163
• TP3: 4,155
• TP4: 4,142
• TP5: 4,116
→ Classic “sell the premium” setup: wait for price to return to the swept highs — avoid FOMO in the middle.
2️⃣ SELL Continuation – After Breaking 4,190
Only valid if we get a clear H1 close below 4,190 , confirming the Liquidity Sweep zone has been violated and flipped into resistance.
• Condition: H1 close below 4,190 → wait for a retest of 4,190–4,195 from underneath
• Entry: 4,190 – 4,195
• SL: above 4,205
• TP1: 4,163
• TP2: 4,155
• TP3: 4,142
• TP4: 4,116
→ This setup is only for traders who prefer clean continuation after a confirmed break of support.
3️⃣ Countertrend BUY – Only From Deep Zones
• Aggressive: watch for reactions at 4,163 – 4,155 . If strong rejection appears, consider a technical BUY retracement toward 4,190 – 4,216 (scalp).
• Conservative: wait for a deep test of 4,116 (stronger demand zone) before searching for BUY setups.
→ This is strictly countertrend; only take it if strong confirmation appears. Otherwise, skip and focus on SELL opportunities in premium zones.
🧠 Vincent’s View
Gold is currently “hanging” within premium after a very clean top sweep.
The safest strategy is to let price return to 4,225–4,241 before selling, or wait for a confirmed break of 4,190 to play continuation. Avoid selling directly at 4,190 while it still acts as support.
“Sell the premium, respect the levels – liquidity never lies.” ⚜️
⏰ Timeframe: 1H
📅 Updated: 02/12/2025
✍️ Analysis by: Captain Vincent
