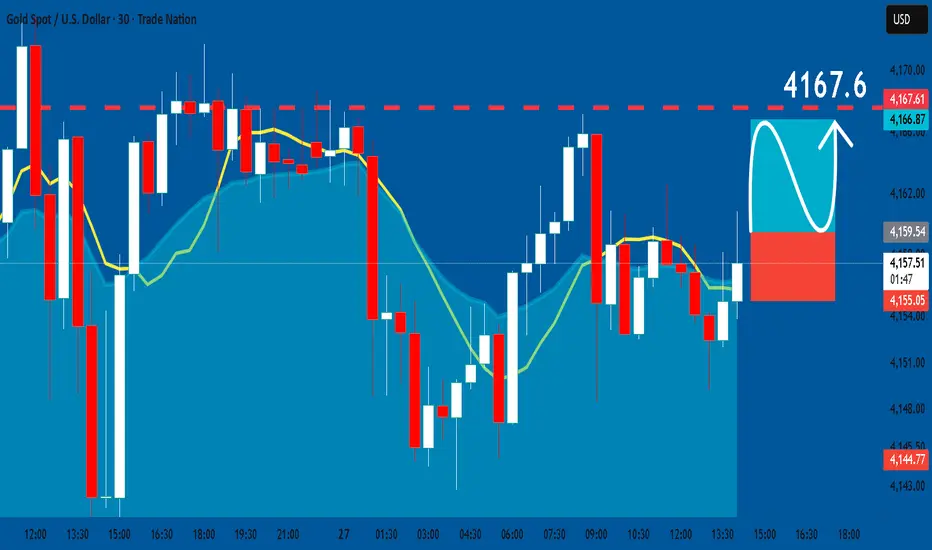
GOLD: Long Trade with Entry/SL/TP
GOLD
- Classic bullish formation
- Our team expects growth
SUGGESTED TRADE:
Swing Trade
Buy GOLD
Entry Level - 4159.5
Sl - 4155.0
Tp - 4167.6
Our Risk - 1%
Start protection of your profits from lower levels
Disclosure: I am part of Trade Nation's Influencer program and receive a monthly fee for using their TradingView charts in my analysis.
❤️ Please, support our work with like & comment! ❤️
Trade ideas
XAUUSD 15m – Bullish Continuation Toward Final TargetOANDA:XAUUSD
Gold swept liquidity beneath the descending channel, then immediately broke out with strong momentum, confirming a new demand zone at the lows. After reclaiming mid-range structure, price is pushing upward toward the next liquidity bracket at $4,230, where a small corrective pullback is likely before continuation. Market sentiment remains bullish as long as price stays above the newly formed demand zone.
Key Scenarios
✅ Bullish Case 🚀
Maintain support above $4,215 – $4,218
Small correction from liquidity target zone
Continuation to:
🎯 Target 1: $4,230
🎯 Final Target: $4,264 (major liquidity + top resistance zone)
❌ Bearish Case 📉
Only valid if price breaks below $4,181
🎯 Downside Target: $4,164 (previous sweep level)
Current Levels to Watch
Resistance 🔴: $4,230 / $4,264
Support 🟢: $4,215 / $4,181 / $4,164
⚠️ Disclaimer: This analysis is for educational purposes only. It is not financial advice.

Bullish Analysis gold-SMCPROFESSIONAL BREAKDOWN
Step-by-step analysis – Gold (XAUUSD)
1. Initial accumulation + Buy-Side Liquidity
Price consolidated and built buy-side liquidity above previous highs—classic institutional preparation for expansion.
2. ChoCH + BOS confirming bullish intention
After sweeping liquidity, market structure shifted with a ChoCH followed by a BOS, validating the bullish scenario.
3. Perfect Fake Out + Precision POI
A clean manipulation (fake out) pushed sellers in, then price returned perfectly into our POI at 4,129, where we executed the entry.
4. Protected RR 1:4
Stop loss placed at 4,103, maintaining a disciplined 1:4 R/R exactly according to plan.
5. 4H FVG mitigation + Clean expansion
Price reacted beautifully and continued to fill the 4H FVG, fueling the bullish expansion.
6. TPs being hit one by one
• First TP – 4,171 ✔️
• Second TP – 4,202 ✔️
• Third TP – 4,230 ⏳ Just a couple pips away…
7. Expected mitigation at the HH
We’re approaching the final Higher High mitigation, the completion of the institutional target.
GREAT JOB TRADERS.. 🫡🖤

GOLD breaks above $4,190, time to exit accumulation4,190 USD/oz is a temporary step forward, with price testing the upper boundary amid thin liquidity (holiday period) and sharply rising expectations of Fed easing. However, confirming an uptrend requires a daily close above the stronger technical resistance zone (around 4,216 USD) and sustaining that level.
Reasons not to rush to confirm a “breakout from the accumulation range”
• The 4,190 USD level appeared during a low-liquidity session, making it prone to “false breaks” caused by thin trading.
• Recent volatility has been driven largely by monetary policy expectations (FedWatch ~80% probability of a December rate cut) rather than any immediate fundamental shift in gold’s supply–demand balance. Expectations can reverse quickly if Fed outlook or economic data changes.
• Geopolitical scenarios (Ukraine, Middle East) and central bank gold demand provide medium–long-term support, but these are “slow” drivers and cannot replace the need for technical confirmation to start a new bull phase.
Elements supporting a breakout (if sustained)
• Dovish comments from Fed officials (Waller, Daly, Williams) continue to reinforce rate-cut bets, while news about the potential Fed Chair candidate (Hassett) increases expectations of easier policy.
• Stable physical demand from Asia (India has recently kept importing strongly at ~14.7B USD) and steady official purchases by central banks.
• Rising global risk sentiment (shift into safe-haven assets) may push gold above 4,200 if accompanied by stronger Fed-easing signals.
Warning factors for a pullback (downside risks)
• Unexpectedly strong U.S. economic data (labor, retail sales) may reduce rate-cut expectations, pushing USD/yields higher and pressuring gold lower.
• Thin holiday liquidity increases the risk of gaps and exaggerated moves.
Outlook:
If policy conditions and geopolitics continue to support (dovish Fed + geopolitical risk), gold has a high probability of breaking out from the accumulation range and starting a true bullish cycle before/early 2026. In the short term (a few sessions to a few weeks), the market remains vulnerable to fake-outs.
Technical Analysis – OANDA:XAUUSD
Gold price has surpassed the 4,190 USD/oz zone—a positive sign but not yet enough to confirm a new uptrend.
Structurally, price remains within the medium-term ascending channel, holding above the trendline and above the short-term MA21 (~4,056 USD).
Notable Fibonacci levels:
• 0.236 ≈ 4,128 USD
• 0.382 ≈ 3,973 USD
The 3,970–4,000 USD zone remains a major support shield.
RSI is recovering from the neutral region (not overbought), showing the uptrend has a foundation but hasn't accelerated.
Necessary condition:
Hold above 3,972–4,000 USD and avoid breaking below the ascending channel trendline.
Sufficient condition (confirmation of a new bullish cycle):
A daily close above 4,216 USD/oz (Fib resistance zone / intraday peak).
Accompanied by:
• RSI breaking above 55–60
• Price holding above MA21 with a successful retest
If these conditions appear together, the probability of moving toward 4,300 — 4,380 USD/oz increases significantly.
Short-term bearish reversal scenario:
Failure to hold 3,972 USD opens the door to a deeper correction toward 3,846 USD (Fib 0.5) and then 3,720 USD (Fib 0.618).
Risk management note:
Volatility is still heavily driven by Fed news and geopolitics. Keep position sizes small, set clear stop-losses, and avoid holding large positions during policy events.
Trade Ideas (as provided)
SELL XAUUSD at 4213 – 4211 ⚡️
• Stop Loss: 4217
• Take Profit 1: 4205
• Take Profit 2: 4199
BUY XAUUSD at 4134 – 4136 ⚡️
• Stop Loss: 4130
• Take Profit 1: 4142
• Take Profit 2: 4148

Elise | XAUUSD 2H — Liquidity Sweep + Retest SetupOANDA:XAUUSD
After sweeping liquidity at every breakout stage, XAUUSD formed clear consolidation boxes acting as accumulation zones. Each breakout has been followed by a retest, confirming continuation. The current move has broken above liquidity pivot zone highs, and price is now expected to retest the level at 4165–4175 before continuation toward major liquidity above.
Key Scenarios
🚀 Bullish Case (Primary Bias)
If price retests and holds 4165–4175 zone:
🎯 Target 1: 4235–4250
🎯 Target 2 (Final): 4310–4350 liquidity zone
Expect sweep of equal highs followed by continuation.
📉 Bearish Case (Invalidation)
Break and close below 4110–4125 zone would weaken bullish structure and potentially send price back toward the lower range zone.
Current Levels to Watch
Retest Buy Zone: 4165–4175
Support Range: 4110–4125
Liquidity Targets: 4235 → 4310+
⚠️ Disclaimer: This analysis is for educational purposes only. Not financial advice.

XAUUSD 1H — Bullish Structure Holding | Retest Setup ActiveGold has moved out of a range market and built momentum toward premium pricing. After a liquidity grab and correction, the market is now retesting the breakout structure. If the retest holds, this will likely serve as the continuation point toward the next liquidity target at 4378.
Key Scenarios
✅ Bullish Case 🚀
If price retests 4156–4175 and holds with bullish reaction:
🎯 Target 1: 4255
🎯 Target 2: 4378 (major liquidity sweep)
❌ Bearish Case 📉
A sustained break and close below 4107 may shift momentum and open deeper corrective downside.
Current Levels to Watch
Support / Retest Zone: 4156–4175
Secondary Support: 4107
Liquidity Target: 4378
⚠️ Disclaimer: This analysis is for educational purposes only. Not financial advice OANDA:XAUUSD OANDA:XAUUSD

Bullish Momentum Builds — XAUUSD Aims for 4300Gold (XAUUSD) is showing bullish momentum, and a potential long opportunity is forming above the 4200 support zone. A buy entry from 4194 aligns with the current uptrend structure, while downside protection is placed at SL: 4160 to safeguard against volatility.
If bullish pressure continues, price could aim for the next major resistance, making 4300 a realistic upside target. This setup favors buyers as long as gold holds above the 4200 zone and continues forming higher lows
Key Levels
Entry 4194
Target 4300
Stop Loss 4160

Gold’s Roadmap: TRZ + Resistance = High-Probability ReversalGold ( OANDA:XAUUSD ) rose to the Resistance zone($4,192 – $4,133) as I expected in the previous idea and reached its target.
Gold is currently moving near the Resistance zone($4,192 – $4,133) and in the Time Reversal Zone(TRZ).
In terms of Elliott Wave theory, it seems that Gold has managed to complete a Double Three Correction(WXY) in the ascending channel during the 7 trading days.
I expect Gold to start falling after the Resistance zone($4,192 – $4,133).
First Target: $4,077
Second Target: $4,037
Stop Loss(SL): $4,195(Worst)
Points may shift as the market evolves
---------------------------------------------------------------------------
In the upcoming hours, the U.S. will release a batch of key economic indicators: Core PPI, PPI, Core Retail Sales, and Retail Sales. These prints directly influence inflation expectations and the interest-rate outlook, which makes gold particularly sensitive today.
My personal outlook on Gold:
If the data comes in hotter than expected, Treasury yields may rise , and the dollar could strengthen, putting short-term downward pressure on gold.
If the data comes in softer than expected, markets may quickly price in lower inflation pressure and a more dovish Fed path. This scenario typically gives gold a strong short-term upside push, especially if PPI and Core PPI print below estimates.
Overall, with the current structure, the market reaction in the first 15–30 minutes after the release matters more than the numbers themselves. Monitoring volatility and price behavior right after the release will help determine the day’s dominant direction.
---------------------------------------------------------------------------
Ukraine appears to have agreed to the terms of the peace agreement.
Why does this kind of news usually push Gold lower?
Gold acts as a safe-haven during periods of war, geopolitical tension, and uncertainty.
When credible news of peace emerges, the demand for safe-haven assets declines → lowering gold demand.
Global risk sentiment improves, and capital flows toward risk-on assets such as equities, stronger currencies, and yield-bearing markets.
If a peace agreement reduces tensions around energy or oil markets, inflationary pressure eases → making gold less attractive.
---------------------------------------------------------------------------
💡 Please respect each other's opinions and express agreement or disagreement politely.
📌 Gold Analyze (XAUUSD), 1-hour time frame.
🛑 Always set a Stop Loss(SL) for every position you open.
✅ This is just my idea; I’d love to see your thoughts too!
🔥 If you find it helpful, please BOOST this post and share it with your friends.

Gold Is Coiling for a Big Move — Triangle Breakout Incoming?Gold has formed a symmetrical triangle after a strong vertical rally.
Price is currently breaking out of the upper triangle boundary, which can signal continuation of the larger bullish trend.
Bullish Scenario (Confirmed breakout)
Upside Targets:
• 4320
• 4380 (major resistance)
• 4450 if momentum expands
Bearish Scenario (Failed breakout / breakdown)
Downside Targets:
• 4050
• 3950
• 3850 (major structural support)
Stop Loss
• Long: below 4160
• Short: above 4230
XAUUSD: Strong Growth and Buying OpportunityWith the prospect of a Fed interest rate cut and the weakening of the USD, XAUUSD is showing signs of a strong growth phase. Based on macroeconomic news and technical charts, we can see that the price of gold continues to hold steady above the uptrend line .
XAUUSD is currently pulling back to instant support at 4,120,000 USD . The uptrend is supported by the EMA (34, 89) indicators and the current upward trend. The strong support at 4,120,000 USD plays a crucial role in maintaining this upward momentum.
Short-Term Forecast:
XAUUSD could continue to rise to higher levels if it holds above 4,120,000 USD, with the next target being the TP1 level at 4,200,000 USD , and even the TP2 level at 4,250,000 USD . This is supported by market expectations that the Fed will continue to lower interest rates in December, weakening the USD and boosting demand for gold as a safe-haven asset.
Conclusion:
With a stable upward trend and support from both the market and chart indicators, XAUUSD is likely to continue its upward movement. If there is a pullback to the support level, it will provide an excellent opportunity for buying.

XAUUSD: Breakout From ConsolidationAfter an extended period of sideways consolidation, the market finally broke out of the consolidation range with strong momentum and also broke through the descending trend line, confirming a clear bullish shift in structure. This breakout indicates that buyers have regained control after absorbing liquidity from both sides of the range.
Following the breakout, price attempted to push further into the upper Fair Value Gap and toward the Upper Order Block but failed to sustain continuation, leading to a corrective move back into the previously broken structure. This retracement is normal and aligns with typical price behavior when retesting major breakout levels.
Price has now reached the Lower Order Block, which acted as a major reaction zone earlier. The rejection from this OB, combined with the fact that it sits directly below the breakout structure, strengthens the likelihood that this zone will serve as the primary demand area for a potential continuation to the upside. As long as the Lower OB holds, the bullish outlook remains intact.
If price maintains support above this Order Block, the next objectives become the upper FVG and the Upper Order Block, as both contain resting liquidity and unmitigated imbalances that the market may want to target. These zones stand as the next main areas of interest for bullish continuation.
However, a break and close below the Lower OB would invalidate the bullish scenario and open the possibility for a deeper drop, as it would signal a structural failure of the current demand zone. Until that happens, the bias remains bullish with expectations of upward continuation following this retest.

12.01 Euro early-session plan for goldXAUUSD (Gold vs. USD) 1-hour Trading Plan for Today’s Europe & US Sessions (Long-Only)
1. Primary Strategy: Buy on Pullback (Priority Execution)
- Trigger: Price pulls back to the 4218-4225 zone (near the "Support Zone" + 0.382 Fib support on the chart) + bullish candlestick pattern forms (e.g., bullish engulfing, hammer).
- Entry: Go long immediately.
- Stop Loss: Below 4210.
- Targets: First target at 4255; if broken, second target at 4285 (Target Zone 1 on the chart).
2. Secondary Strategy: Buy on Breakout (Supplementary Execution)
- Trigger: Price holds above 4255 + closes as a solid breakout bullish candle (no long upper wick).
- Entry: Go long with a smaller position (60%-70% of the primary strategy’s position size).
- Stop Loss: Below 4240.
- Targets: First target at 4285; second target at 4302 (Target Zone 2 on the chart).
3. Supplementary Strategy: Add Position on Extreme Pullback (Execute Cautiously)
- Trigger: Price unexpectedly pulls back to 4214 (0.382 Fib support) + shows reversal signals (e.g., doji, volume-spiked bullish candle).
- Entry: Add to the position with a small size (total position ≤ 1.5x the primary strategy’s size).
- Stop Loss: Below 4200.
- Targets: First target at 4246 (current price level); second target at 4255.
GOOD LUCK!
LESS IS MORE!

XAUUSD Update Breakout Triangle PatternAfter approximately 1 month of consolidation and forming a triangle pattern, the gold price finally broke through the upper area.
It have a big possibility that gold movement have a target to make a new ATH around 4400-4500 level.
Becarefull with a resistance area at 4244 level and 4272 level.
Jump in when the price make a correction ( pullback ).
Have a blessing week ahead !

Gold (XAUUSD) Prices Poised to Break Higher, Targeting 4358Gold (XAUUSD) continues to exhibit a bullish sequence from the 28 October low, suggesting further upside potential. The rally from that low is unfolding as a five‑wave impulse, with wave 1 concluding at 4245.22, as reflected in the one‑hour chart. Following this, wave 2 developed into a zigzag Elliott Wave structure. From the peak of wave 1, wave ((a)) ended at 4144.97, while the subsequent rally in wave ((b)) terminated at 4211.31. The decline in wave ((c)) reached 3996.25, thereby completing wave 2 at a higher degree.
The metal has since resumed its upward trajectory in wave 3, decisively breaking above the prior wave 1 peak. This confirms that the next leg higher has commenced. From the conclusion of wave 2, wave ((i)) ended at 4132.81. The corrective pullback in wave ((ii)) finished at 4022.07, forming a double three structure. One more leg higher is anticipated to complete wave ((iii)), after which a modest pullback in wave ((iv)) should occur. The market is then expected to advance again in wave ((v)), thereby concluding wave 3.
The potential target for this advance lies within the 100% to 161.8% Fibonacci extension of wave 1, calculated at 4358–4579. In the near term, as long as the pivot at 3996.25 remains intact, any pullback should find support within a sequence of 3, 7, or 11 swings, paving the way for continued strength. This structure reinforces the bullish outlook and highlights the importance of maintaining the key pivot level to sustain momentum.

XAUUSD Possible continuation entries?Nothing major on Weekly, daily chart due to the impulsive bullish momentum on Gold.
Using the H12/H4 timeframe, price is in a bullish trend, I am currently expecting price to push higher and take out the daily high/ATH 4381.440.
Following the internal structure price did break above last LH created and formed a new HH which confirmed a shift in market trend. Price then pulled back into discounted levels around the 79.5% Fib level and weekly key level 3997.372, That's when we saw buyers stepping in again and pushed price higher and broke above the last HH created, which was also situated just below a key weekly level of 4259.577. This new HH is not confirmed yet, but I do expect price to push lower towards the marked OB if the new HH is confirmed.
That will be in discounted levels and just around a strong OB that caused last BOS and has clear IMB (4100-4025). I will be looking for longs targeting the daily HH/ATH.

GOLD Consolidation Starts (Correction zone) Buyers Slow ExitNow after the all time high of 3482.
GOLD enters into a Consolidation zone Starts or (Correction zone) Buyers Slow Exit.
So at current market price 4180 Sell and again buy at 4000 and again sell at 4170 range and again buy at 3890 and again sell at 4050 and again buy at 3890 and again sell at 4160 and again buy at 3737.
This is for Education Purpose only, am still testing WD Gann theory!

XAUUSD: Trend in 30-Min timeframeThe color levels are very accurate levels of support and resistance in different time frames, and we have to wait for their reaction in these areas.
You should be noted, that we have two trend (green & purple)
So, Please pay special attention to the very accurate trend, colored levels, accurate channel and you must know that SETUP is very very sensitive.
Be careful
BEST
MT

XAUUSD Bullish Reversal Setup from Extreme POI – SSS Liquidity SChart Analysis
1. Market Context
The chart shows XAUUSD after a decline, now tapping into an EXTREME POI (Point of Interest).
Price reached a previous demand zone where strong reactions occurred before.
2. Liquidity Structure
Multiple areas are labeled “SSS” (Sell-Side Liquidity / Sell-Side Sweep).
Price appears to have:
Swept liquidity beneath local lows (SSS).
Tapped the extreme POI.
Shown an immediate rejection wick, indicating buyers stepping in.
This suggests the market may be exhausting sellers and preparing for a bullish leg.
3. Execution Zone
The grey region represents the entry zone (likely a demand imbalance / mitigation area).
The large blue box above marks the risk-to-reward projection for a long position.
4. Targets
You’ve placed two clear targets:
Target 1
A mid-range liquidity level at approximately 4217.279.
Represents a logical first take-profit based on prior structural inefficiencies.
Target 2
The upper area (labeled “TARGET”), aligning with:
Prior swing highs
A supply zone
A premium pricing zone (after retracement)
This would be the full TP for the bullish move.
5. Bias Summary
Bias: Bullish
Reason: Liquidity sweep + POI tap + structure showing potential for upside displacement.
The setup aligns with Smart Money Concepts:
Sweep → Mitigation → Displacement → Targeting Imbalances & Liquidity Pools

XAUUSD SUPPORT, RESISTANCE & TRENDLINE ANALYSISGood Morning guyzz!!
These are the levels for the day
Go "SHORT" if t stays below 4195.32 with 4180.33 as the first target and sustaining below might lead to 4167.29
Go "LONG" if it stays above 4195.33 with 4224.73 as the first target and it stays above that then go for 4231.39 and above that might lead to 4239.58
Note: Keep a "SHORT" sentiment if it stays below 4220
Keep a "LONG" sentiment if it stays above 4220.

Upward ChannelExpecting to complete wave 5. Watching closely at the very top if will break out or Sell opportunity will be the next move.

OUTLOOK XAUUSD 15m Analysis(4th December 2025)Hey guys, this is just a trade idea not a financial advise
BUY/SELL SCENARIOS:
BUYS:
1) Body Candle Close above the 4216.90 level.
2) Retest the 15m Bullish CHOCH at the 4216.90 level.
3) Create a 3/5m Bullish Engulfing Candle to capitalise on BUYS towards the 4241.60 level.
SELLS:
1) Body candle close below the 4202.31 level.
2) Retest the 15m Bearish CHOCH at the 4202.31 lev/el.
3) Create a 3/5m Bearish Engulfing Candle to capitalize on SELLS towards the 4183.00 level.
Trade smart, trade according to trading plan!

XAUUSD Short to PV.in a one-hour range, blue line was the most respected level among the candles.
if H1 closes below the open, there is a higher chance of continuation,

XAUUSDGold has been in a sustained long-term uptrend since 2019–2020.
Throughout 2025, the bullish structure has remained intact despite strong pullbacks.
Price created a new all-time high around 4,400 before correcting.
This correction formed a consolidation zone near 3,960, followed by a bullish push that created a higher low at 4,250, in relation to the 4,400 high.
The subsequent drop failed to break below the previous consolidation low (3,960), confirming that buyers are still defending the long-term structure. From there, price started moving upward again toward the 4,000 region.
Recently, price has been consolidating on the H4 timeframe between 4,250 (resistance) and 4,175 (support).
A clean breakout above 4,250 would open the way toward the previous high at 4,400.
A break above 4,400 would confirm a continuation of the long-term bullish trend, aligning with the macro expectation since 2020 that gold will eventually reach the 4,000+ extended targets.
Gold remains structurally bullish, but the next decisive move depends on the breakout of the 4,250 zone.
