XAUUSD Bullish Reversal Setup from Extreme POI – SSS Liquidity SChart Analysis
1. Market Context
The chart shows XAUUSD after a decline, now tapping into an EXTREME POI (Point of Interest).
Price reached a previous demand zone where strong reactions occurred before.
2. Liquidity Structure
Multiple areas are labeled “SSS” (Sell-Side Liquidity / Sell-Side Sweep).
Price appears to have:
Swept liquidity beneath local lows (SSS).
Tapped the extreme POI.
Shown an immediate rejection wick, indicating buyers stepping in.
This suggests the market may be exhausting sellers and preparing for a bullish leg.
3. Execution Zone
The grey region represents the entry zone (likely a demand imbalance / mitigation area).
The large blue box above marks the risk-to-reward projection for a long position.
4. Targets
You’ve placed two clear targets:
Target 1
A mid-range liquidity level at approximately 4217.279.
Represents a logical first take-profit based on prior structural inefficiencies.
Target 2
The upper area (labeled “TARGET”), aligning with:
Prior swing highs
A supply zone
A premium pricing zone (after retracement)
This would be the full TP for the bullish move.
5. Bias Summary
Bias: Bullish
Reason: Liquidity sweep + POI tap + structure showing potential for upside displacement.
The setup aligns with Smart Money Concepts:
Sweep → Mitigation → Displacement → Targeting Imbalances & Liquidity Pools
Trade ideas

GOLD ANALYSIS 12/04/20251. Fundamental Analysis:
a) Economy:
• USD:
The USD is recovering slightly after a strong decline earlier this week, mainly due to profit-taking flows from gold and bonds. However, the overall trend of the USD remains weak because the market believes the Fed will keep interest rates low and maintain the rate-cutting cycle to support economic growth.
• U.S. Stock Market:
U.S. equities are rising modestly thanks to expectations of a rebound in Q4 corporate earnings and capital rotating back into the tech sector. This reduces safe-haven demand, but the bullish momentum is not strong enough to exert significant downward pressure on gold.
• FED:
The Fed continues to signal a dovish stance, prioritizing economic stability over inflation control. The market is pricing in the possibility of two rate cuts in 2026, providing strong support for gold.
• TRUMP:
The Trump administration is pushing aggressive stimulus packages and trade-protection policies. Uncertainty surrounding tax strategies and pressure on China–Mexico is creating a mild risk-off sentiment, supporting gold.
• Gold ETF (SPDR):
SPDR continued to sell 1.71 tons yesterday → a slightly negative signal, indicating institutional outflows from gold as prices approached all-time highs → mildly bearish for gold.
b) Geopolitics:
• Ongoing instability in the Middle East and Venezuela, with small conflicts occurring frequently.
• U.S.–China tensions persist over technology and trade.
These factors maintain a cautious market tone and form a supportive foundation for gold to rebound.
c) Market Sentiment:
The market is in a mildly risk-on state, but not stable. Funds still move into gold as a defensive asset whenever the USD or equities show signs of profit-taking.
→ Gold continues to trade within a range, but with a bullish bias.
Asian markets are entering the year-end physical-gold buying season → supportive for gold.
2. Technical Analysis:
Trend:
• Price is holding above the rising trendline.
• MA20 – MA50 are about to cross upward → signal of short-term recovery.
• RSI is rebounding from the 30 zone → selling pressure has weakened.
Pattern:
• The U.S. session bottom has formed → price is retesting the trendline and building a new bullish structure.
• Scenario: a pullback to the trendline followed by a bounce.
RESISTANCE: 4,229 – 4,241 – 4,264
SUPPORT: 4,206 – 4,194 – 4,186
3. Yesterday’s Market (03/12/25):
• Gold moved sideways gently within a 45-dollar range.
→ The bearish structure was rejected and left a long wick → a signal that buyers have returned.
4. Trading Strategy for Today (4/12/25):
🪙 SELL XAUUSD | 4232 – 4230
SL: 4236
TP1: 4224
TP2: 4218
🪙 BUY XAUUSD | 4171 – 4173
SL: 4167
TP1: 4179
TP2: 4185

XAUUSD SMC Outlook - Quick UpdateGold formed a Strong High near 4240 and later shifted downward with a clear CHOCH + BOS.
Price is currently moving around 4194, showing a pause after the drop.
What to look for next: A possible pullback toward 4200-4210. If price respects that zone, we may see continuation toward 4185 → 4160.
Market structure is leaning bearish for now - patience is key.
Caution : This is not a financial advice

XAUUSD Short to PV.in a one-hour range, blue line was the most respected level among the candles.
if H1 closes below the open, there is a higher chance of continuation,

my view on gold gold break the trend and i think its will lead the price to 50 and 61 fibo and also the price created abcd traingle

XAUUSD Possible continuation entries?Nothing major on Weekly, daily chart due to the impulsive bullish momentum on Gold.
Using the H12/H4 timeframe, price is in a bullish trend, I am currently expecting price to push higher and take out the daily high/ATH 4381.440.
Following the internal structure price did break above last LH created and formed a new HH which confirmed a shift in market trend. Price then pulled back into discounted levels around the 79.5% Fib level and weekly key level 3997.372, That's when we saw buyers stepping in again and pushed price higher and broke above the last HH created, which was also situated just below a key weekly level of 4259.577. This new HH is not confirmed yet, but I do expect price to push lower towards the marked OB if the new HH is confirmed.
That will be in discounted levels and just around a strong OB that caused last BOS and has clear IMB (4100-4025). I will be looking for longs targeting the daily HH/ATH.

Gold continues to be bought in the $4200-$4205 range.Gold continues to be bought in the $4200-$4205 range.
My chart analysis shows that the uptrend in gold prices is not yet fully over, currently stabilizing above $4200.
The $4185-$4200 range is currently the strongest support level for gold.
The $4150-$4160 range is currently the most effective resistance level for gold.
Our strategy remains unchanged: as long as the gold price remains above $4195, we will continue to buy low and sell high, profiting from price fluctuations.
In fact, we have already completed two successful trades tonight.
The current strategy remains clear:
Buy: $4200-$4205
Stop Loss: $4185
Take Profit: $4230-$4250
It should be noted that if the gold price falls below $4195, it may be oversold and fall back to around $4150, which is the most likely pullback level. Therefore, strictly adhering to the trading plan is crucial.
Yes, I have a complete table on my public channel recording all my trading signals over the past three months.
Here is my trading model:
1. I set a fixed stop-loss range of 20 pips, based on current market volatility.
2. Profit targets: Profit targets are not fixed. I adjust the profit range independently based on market trends, but I ensure each trading signal yields at least 5 pips of profit.
3. Holding time: I will never close a position prematurely unless the stop-loss is triggered.
4. Order allocation: 1 lot corresponds to $8,000 to $10,000 in capital.
5. I have my own trading system, and I wait for orders to be executed at the appropriate price.
6. I use 1-3 swing trading strategies daily. When using high-frequency trading (HF), I stop all other trading activities, focus solely on HF, and choose an effective trading timeframe. I typically conduct HF trading three hours after and three hours before the US stock market closes. This significantly improves my win rate.
Therefore, this chart summarizes all the trading signals I release on my public channel. Due to very limited time, I only release 1 to 2 trading signals per day on my public channel.
Of course, if you want to achieve the same returns as me, you need to closely monitor all my trading signals and align your trading hours with mine, but this may not be easy. Therefore, I strongly recommend:
You can contact me to establish a long-term, stable partnership.
I will help you plan your funds and build a safe and reliable trading system based on your schedule, order size, and trading habits. This is a win-win collaboration.

Gold on excellent break-outAs discussed throughout my yesterday’s session commentary: “ My position: After Profiting on multiple Medium-term Buying orders, I have turned now to more Intra-day calls as announced and am Buying Gold literally from #4,138.80 on multiple occasions and will continue to do so, and will Buy Big if #4,130.80 is delivered. I will not Sell Gold and my practical suggestion is to not Sell Gold at all costs.”
My position : I have engaged multiple Buying orders throughout yesterday’s session on #4,151.80 test and even though Volume was almost non-existent, I was well aware that Gold is Trading within Ascending Triangle and ready to deliver upside break-out. I have kept my order and on market opening Gold delivered slow but steady break1-out of #4,167.80 Resistance and I closed my set of aggressive Buying orders on #4,172.80 extension. I have re-Bought Gold this morning with #4,167.80 entry point and will continue Buying Gold from my key entry points. Congratulations on Profits and have a great weekend!

Decent Profits on re-Buy ordersAs discussed throughout my yesterday’s session commentary: “ My position: After Profiting on multiple Medium-term Buying orders, I have turned now to more Intra-day calls as announced and am Buying Gold literally from #4,138.80 on multiple occasions and will continue to do so, and will Buy Big if #4,130.80 is delivered. I will not Sell Gold and my practical suggestion is to not Sell Gold at all costs.”
My position : I have engaged multiple Buying orders throughout yesterday’s session on #4,151.80 test and even though Volume was almost non-existent, I was well aware that Gold is Trading within Ascending Triangle and ready to deliver upside break-out. I have kept my order and on market opening Gold delivered slow but steady break1-out of #4,167.80 Resistance and I closed my set of aggressive Buying orders on #4,172.80 extension. I have re-Bought Gold this morning with #4,167.80 entry point and will continue Buying Gold from my key entry points. Congratulations on Profits and have a great weekend!

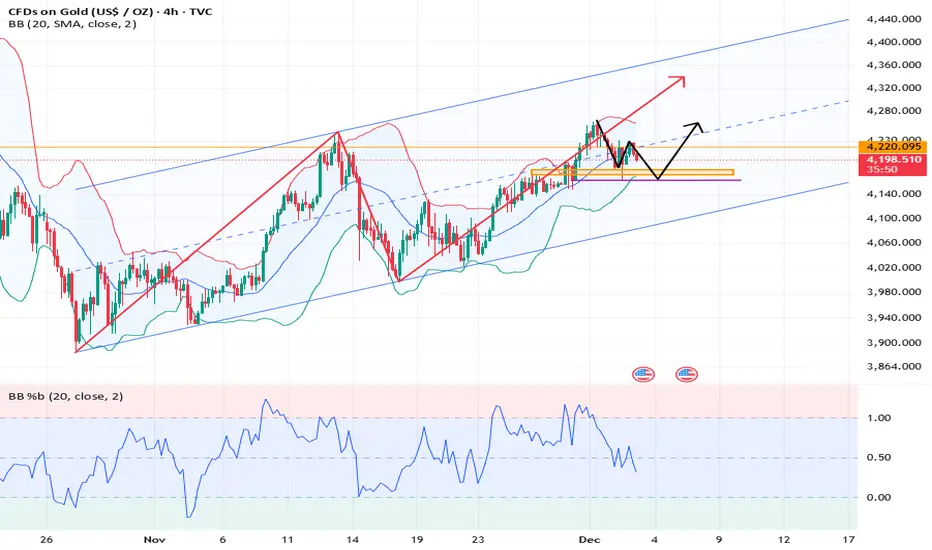
[WEEKLY] ANFIBO | Gold XAUUSD - Purple or Gray? [11.24 - 11.28]Hi guys, Anfibo’s here!
XAUUSD Weekly Trading Plan
Overall Picture:
OANDA:XAUUSD is entering a critical phase as price continues to consolidate within a tightening structure, signaling that a major directional move is likely to occur next week. After a period of strong volatility, the market is now compressing energy between the upper and lower boundaries of the current range. This setup is textbook for a break–retest–continuation model, and that’s exactly why my strategy for the upcoming week revolves around two clear scenarios: the “purple arrow” plan and the “grey arrow” plan.
The market will reveal its next major direction once either the upper boundary is broken or the lower boundary gives way. Until that happens, there is no reason to pre-commit to a biased direction — we trade what price confirms, not what we predict.
Trading Plan for Next Week:
We will react based on breakout confirmation:
>>> Scenario #1: Break ABOVE the range – Follow the “Purple Arrow” plan (BUY)
If gold pushes through the upper boundary with strength and confirms a retest, we will switch to a bullish continuation plan.
Key Resistance Levels to Watch: 4147, 4243, 4340, 4356, 4377.
A clean break above structure opens the path back into macro bullish territory, where gold may attempt to revisit or even surpass recent highs.
>>> Scenario 2: Break BELOW the range – Follow the “Grey Arrow” plan (SELL)
Once price breaks and retests the lower boundary, we will look for sell setups targeting the ladder of support levels outlined below.
Key Support Levels to Watch: 4000, 3917, 3890, 3862, 3820, 3793, 3760
A bearish breakout from the range could trigger a multi-wave continuation pattern, giving us multiple opportunities to scale in according to structure.
Risk Management:
Trade only after confirmed breakouts — avoid guessing tops and bottoms.
Keep tight SLs on retests to avoid liquidity hunts common during range boundaries.
Maintain Risk:Reward ≥ 1:2 across all setups.
Prioritize clean structure; avoid trading inside the choppy middle zone of the range.
Reassess bias immediately if the breakout fails or re-enters the range.
Conclusion:
Next week’s market will be all about patience and reaction, not prediction. With gold coiling tightly, a breakout is imminent, and both the “purple arrow” (bullish) and “grey arrow” (bearish) plans give us a clear and disciplined roadmap. Whether price breaks upward or downward, we already know exactly where our key levels are and how we will execute. Stick to structure, wait for confirmation, and let the market choose the direction for us.
HAVE A POWERFUL NEW WEEK, GUYS!

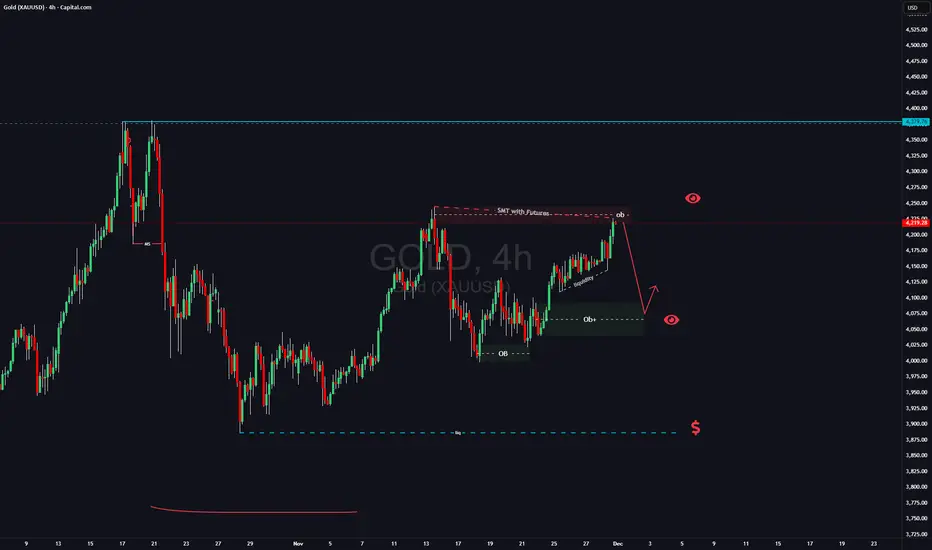
GOLD SETUP: The Liquidity Grab That Could Change Your Month!There is intresting situation on Gold right now:
1) There is SMT with futures(on futures price went higher than previous high from November 13th
2) Have a lot of liqudiity down below which usually means that this liqudiity will be taken
3) strong uptrend on LTF
taking in consideration these factors and that it will be beginign of the month on Monday i will be looking for manipulation at market opening. If i see trend shift on LTF i will be looking for short position till 4110 area (4h OB) , if this wont happen i simply gonna skiip trading GOLD this week.
When price action is not clean and when its hard to see clear picture better to avoid such trade and just watch.
Like and follow if you like my analysis
GOLD: Bearish Continuation & Short Signal
GOLD
- Classic bearish pattern
- Our team expects retracement
SUGGESTED TRADE:
Swing Trade
Sell GOLD
Entry - 4217.9
Stop - 4226.7
Take - 4201.0
Our Risk - 1%
Start protection of your profits from lower levels
Disclosure: I am part of Trade Nation's Influencer program and receive a monthly fee for using their TradingView charts in my analysis.
❤️ Please, support our work with like & comment! ❤️

XAU / USdD 1 Hour ChartHello traders. I have marked my current area of interest for potential scalp buys and sells. he Pre NY volume absolutely corrected the move down from the overnight sessions. So for me, I am waiting to see if I can get in a scalp trade, in either direction. What will happen now is the algorithm trading bots that we spot gold traders trade against will wait to see the orders placed in the order books, and then try to take out leveraged traders in either direction. We, as traders, are trying to ride the institutional wave to win in a trade. Never forget that in order for anyone to win in a trade, someone or some entity has to lose. Be well and trade the trend. Big G gets a shout out. Let's see how this hourly candle closes and how the market reacts as we get closer to the NY open, which may drop gold back down now that most short positions in profit have been eliminataed. All speculation and not based on price action, which is the only wat to trade.


Gold Eyes Support as Fed Cut Bets Fuel Volatility📊 Market Developments
• Gold is trading around ~4,224 USD/ounce, with strong volatility as U.S. bond yields rise slightly → creating downward pressure on gold.
• Expectations that the Fed may cut interest rates soon help gold maintain underlying buying interest.
• The market is awaiting new U.S. economic data to determine a clearer direction.
📉 Technical Analysis
Key Resistance:
1. 4,240 – 4,250 USD (near resistance – recent reaction high).
2. 4,268 – 4,275 USD (extended resistance – breaking above may open the path toward 4,300).
Key Support:
1. 4,180 – 4,200 USD (near support – strong buy zone for bulls).
2. 4,155 – 4,165 USD (mid-term support – aligns with major EMAs; losing this zone may trigger a drop toward 4,130).
EMA:
• Price is hovering around EMA09 on H1/H4 → short-term trend remains indecisive, no clear bullish or bearish confirmation yet.
Candles / Volume / Momentum:
• Volume leans bearish, momentum slightly declining.
• Waiting for confirmation candles: a bullish reversal at 4,180–4,200 or a strong breakdown below 4,165.
📌 Outlook
Gold may retest support with mild downside, especially if U.S. yields continue rising.
However, weak economic data and stronger expectations of Fed rate cuts could trigger a rebound from support.
➡️ Current trend: Neutral – slightly bearish, waiting for reaction at support.
💡 Suggested Trading Strategy
🔻 SELL XAU/USD: 4,242 – 4,245
🎯 TP: 40 / 80 / 200 pips
❌ SL: ~4,248
🔺 BUY XAU/USD: 4,158 – 4,155
🎯 TP: 40 / 80 / 200 pips
❌ SL: ~4,152

XAUUSD Another correction below 3900 is likely.Last week (November 24, see chart below), we gave a buy signal on Gold (XAUUSD), which has already hit Target 1 at $4180 and is about to hit Target 2 at $4275:
This time we move on to the longer time-frames, namely the 1W, where Gold's 2-year Channel Up suggests that another correction is likely at this point.
The reason is the 1D MA100 (black trend-line), which Gold has hit 3 times out of the 4 corrections it has had within this 2-year pattern. October's pull-back saw it pull-back just above the 1D MA50 (red trend-line) but it didn't break, something that always happened during these past corrections.
At the same time, it is very likely to hit the 0.382 Fibonacci retracement level (has done so 2 out of 4 times) once the 1D MA100 contact is made, which gives us a medium-term Target at $3860. That would make a perfect Higher Low on the Channel Up.
Notice also how during the past 3 corrections, the 1W RSI always hit the Support Zone. If this is get hit before the price reaches $3860, it is technically a good idea to take profit earlier.
---
** Please LIKE 👍, FOLLOW ✅, SHARE 🙌 and COMMENT ✍ if you enjoy this idea! Also share your ideas and charts in the comments section below! This is best way to keep it relevant, support us, keep the content here free and allow the idea to reach as many people as possible. **
---
💸💸💸💸💸💸
👇 👇 👇 👇 👇 👇

Gold Trade Plan 03/12/2025Dear traders,
The market is ranging around the 4200 zone without any news of a Russia–Ukraine agreement or reduced tensions between the U.S. and Venezuela. The buy zone is very risky, but as long as no agreement is announced, the price is likely to move upward given the weakness of the dollar. With the first news of a peace agreement, I expect a sharp move on gold.
Regards,
Alireza!

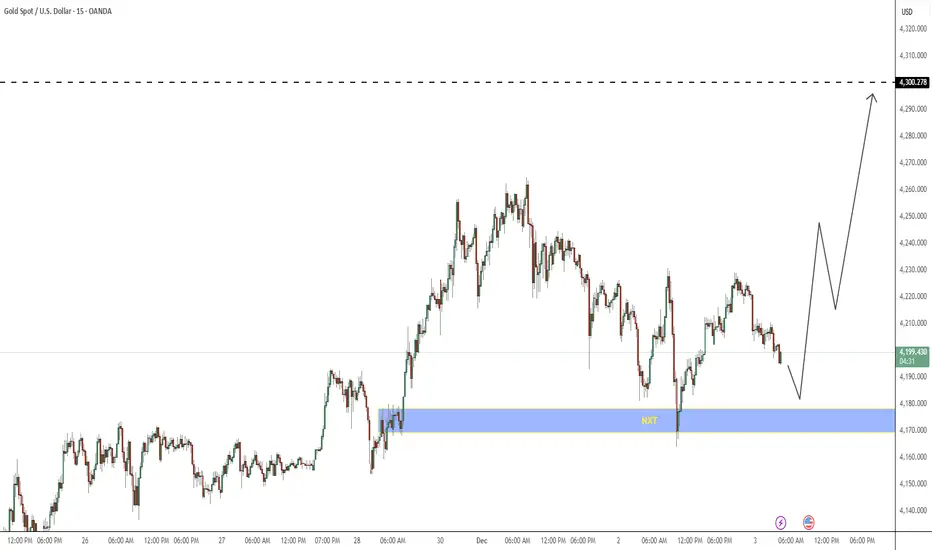
The $4200 Re-Fueling Scenario Before $4300 Blast Off?Market Scenario: Gold is expected to enter a consolidation (ranging) phase between $4170 and $4200 to gather the necessary liquidity and energy.
Bullish Condition: To confirm the move higher, the price must decisively break the $4200 resistance and successfully flip it into support.
Ultimate Target: If the consolidation and breakout are successful, the next target is $4300.
XAUUSD: Market Analysis and Strategy for December 3rd.Gold Technical Analysis:
Daily Resistance: 4300, Support: 4131
4-Hour Resistance: 4245, Support: 4160
1-Hour Resistance: 4230, Support: 4180
Technically, the "hammer" candlestick pattern on the daily chart from the previous trading day indicates strong buying pressure on dips. Both the daily and 4-hour charts maintain an upward channel, and the moving average correction is largely complete, suggesting a continuation of the upward trend. The next key resistance level to watch is the 4245/4250 area; a decisive break above this level is crucial for short-term gains. The MACD/KDJ correction is also largely complete, with support around 4180.
Combined with the 1-hour chart, the price has pulled back after a surge. We await a bottoming out before looking for buying opportunities.
During the NY session, we plan to buy on a pullback to around 4180/4170.
BUY: 4180near
BUY: 4170near
More Analysis →

XAU/USD Looking sell from supply zone at 4240 strong sellXAUUSD (Gold) – 1H Bearish Setup
Price is currently reacting from the 4240 supply zone, showing signs of weakness on the 1-hour timeframe.
I’m looking for a sell opportunity at the 4220 level.
Targets:
• TP1: 4207
• TP2: 4190
• TP3: 4171
Market structure remains bearish for now, but always remember:
✔️ Follow your trading plan
✔️ Use proper risk management
✔️ Protect your capital first
If you find this analysis helpful—Like, Follow, Comment & Share 🔄

Buyers’ Interest Zone (Neutral View)“Price is pulling back into a demand area. I’m watching how the market responds within this zone.”

XAUUSD: Pullbacks are opportunities; remain bullishThe direction I've been aiming for these past two days has been correct, but unfortunately, the limited pullback in gold prices hasn't provided a suitable entry opportunity.
Currently, gold remains in an overall bullish trend. Gold has been consistently hitting new recent highs, indicating continued bullish strength. Pullbacks during the US session present buying opportunities. Now that gold is testing lower levels again, consider buying in the 4220-4230 support zone.
Looking at the 1-hour chart, the moving averages are still in a bullish golden cross and diverging upwards, suggesting further upward momentum and potential for continued gains.
Gold is currently in a bullish trend; pullbacks present buying opportunities. Trade with the trend.
Trading strategy:
Buy gold at 4220-4230
TP1: 4255
TP2: 4280
Set your stop-loss order according to your own situation. Good luck!
