GOLD Is Bullish! Buy!
Take a look at our analysis for GOLD.
Time Frame: 4h
Current Trend: Bullish
Sentiment: Oversold (based on 7-period RSI)
Forecast: Bullish
The market is approaching a significant support area 4,188.16.
The underlined horizontal cluster clearly indicates a highly probable bullish movement with target 4,233.29 level.
P.S
Overbought describes a period of time where there has been a significant and consistent upward move in price over a period of time without much pullback.
Like and subscribe and comment my ideas if you enjoy them!
Trade ideas

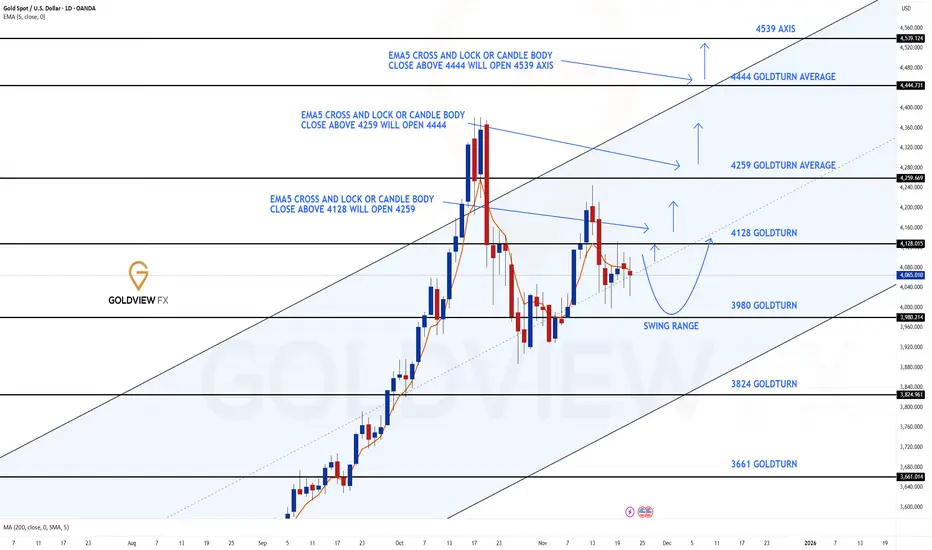
GOLD DAILY CHART ROUTE MAPHey everyone,
Please see our updated Daily chart route map with updated levels.
Price is currently playing between the longer daily chart range 4128 and 3980, with the channel half-line acting as support.
If this support holds, we should see a move toward the 4128 target. A body close or ema5 cross and lock below the half-line would open the swing range for a test and bounce. We're also watching for a break above 41238 to confirm a continuation above.
This is the beauty of our Goldturn channels, which we draw in our unique way, using averages rather than price. This enables us to identify fake-outs and breakouts clearly, as minimal noise in the way our channels are drawn.
We will use our smaller timeframe analysis on the 1H and 4H chart to buy dips from the weighted Goldturns for 30 to 40 pips clean. Ranging markets are perfectly suited for this type of trading, instead of trying to hold longer positions and getting chopped up in the swings up and down in the range.
We will keep the above in mind when taking buys from dips. Our updated levels and weighted levels will allow us to track the movement down and then catch bounces up using our smaller timeframe ideas.
Our long term bias is Bullish and therefore we look forward to drops from rejections, which allows us to continue to use our smaller timeframes to buy dips using our levels and setups.
Buying dips allows us to safely manage any swings rather then chasing the bull from the top.
Thank you all for your likes, comments and follows, we really appreciate it!
Mr Gold
GoldViewFX
Gold & Silver- Very strong finish of the year? (charts say so)It has been an exceptional year for gold bulls. With more than 60% growth year-to-date, the metal has delivered one of its strongest yearly performances in the past two decades.
Even though I’m primarily a short-term trader — rarely holding positions for more than one or two days — it’s impossible to ignore the bigger picture.
The macro-structure is sending a very clear message.
So let’s skip the fluff and dive straight into the charts.
1. XAUUSD: A Violent Range that Formed Something Very Clean
After printing a new all-time high just below 4400, gold collapsed nearly 5,000 pips, only to recover 3,500 pips in a similarly aggressive fashion.
Despite the day-to-day volatility — with 1,000-pip daily swings becoming normal — the structure has settled into a remarkably clean pattern:
A symmetrical triangle.
This pattern is typically a trend continuation structure, and given that the dominant trend is unquestionably bullish, the implication is obvious.
Recent bullish evidence:
- Price broke decisively above 4100
- Short-term structure flipped bullish
- The market is now consolidating tightly just under the descending trendline of the triangle
The most probable scenario?
👉 An upside breakout.
A confirmed break above this compression would target:
- 4250 – the next major resistance
- 4500 – psychological level
- 4700 – the full measured move of the triangle (approx. 5000 pips)
Of course, all eyes remain on the ATH zone, but structurally, the path of least resistance is still up.
2. XAUEUR: Same Pattern, Same Message
XAUEUR is forming an almost identical symmetrical triangle, with a measured target of roughly 4,000 pips if the breakout is confirmed.
When multiple major gold crosses deliver the same structure, it usually means one thing:
➡️ The underlying metal, not the currency pair, is driving the move. (and, as I said at least 5 times by now, STOP LOOKING AT DXY!!!!)
3. XAUGBP: Slightly Behind, but Still Bullish
XAUGBP also reflects the same pattern, though price is currently sitting ~200 pips below the descending resistance line.
Still, the structure remains bullish as long as the market holds its higher-low sequence.
4. XAUJPY: Even More Bullish
Unlike the symmetrical structures above, XAUJPY has formed an ascending triangle since its ATH.
Ascending triangles carry an even stronger bullish bias, showing that demand absorbs every pullback with increasing strength.
This chart is arguably the most aggressively bullish of the group.
5. Gold Futures: Breakout Already in Motion
Gold futures show the same broader pattern — but with one notable difference:
The trendline is already broken.
This makes futures the “leading chart,” often hinting at what spot XAUUSD may do next.
Outlook: When All Stars Align
When XAUUSD, XAUEUR, XAUGBP, XAUJPY, and Gold Futures all point in the same direction, the message is difficult to argue with.
Unless gold breaks back below 4050, the bias into year-end remains decisively:
⭐ Bullish.
⭐ Momentum-driven.
⭐ Trend-confirming.
Gold bull trend intact.
6. Silver: Quietly the Stronger Metal
Silver has actually been outperforming gold this year, with price nearly doubling. It is now sitting just under its most recent ATH.
After reclaiming the 50.50 level and establishing it as solid support, the structure is extremely bullish.
A clean break above the ATH would activate a measured move target near 65.
Silver continues to behave like the higher-beta version of gold — and right now, that beta is paying.
BY THE WAY, THIS IS MY PREVIOUS ANALYSIS COVERING GOLD CROSSES FROM 3 MONTHS AGO:

Risk/Reward 2.24 on XAUUSD-GOLD – Is Opportunity Coming?Good Morning Guys
I’ve put together a 4-hour timeframe analysis on XAUUSD – GOLD.
Once the harmonic pattern completes, I’m expectin’ a correction right around the 4215.0 level.
That’s where the pattern should wrap up, and from there price is likely to pull back.
✅ Entry Level: 4215.0
🛑 Stop: 4270.0
🎯 TP1: 4189.0
🎯 TP2: 4149.0
🎯 TP3: 4097.0
⚖️ Risk/Reward Ratio: 2.24
Also, the Supply-Demand zone sits between 4045.0 – 4000.0.
If price drops into that area, I’ll be lookin’ to buy.
Once we hit that zone, I’ll drop another signal for y’all.
Every single like from you guys keeps me motivated to share these analyses.
Big thanks to all my friends who support me with their likes – y’all are the reason I keep postin’.

XAUUSD 1H — Bullish Structure Holding | Retest Setup ActiveGold has moved out of a range market and built momentum toward premium pricing. After a liquidity grab and correction, the market is now retesting the breakout structure. If the retest holds, this will likely serve as the continuation point toward the next liquidity target at 4378.
Key Scenarios
✅ Bullish Case 🚀
If price retests 4156–4175 and holds with bullish reaction:
🎯 Target 1: 4255
🎯 Target 2: 4378 (major liquidity sweep)
❌ Bearish Case 📉
A sustained break and close below 4107 may shift momentum and open deeper corrective downside.
Current Levels to Watch
Support / Retest Zone: 4156–4175
Secondary Support: 4107
Liquidity Target: 4378
⚠️ Disclaimer: This analysis is for educational purposes only. Not financial advice OANDA:XAUUSD OANDA:XAUUSD

Gold Buyers Regain Momentum — Aiming for 4,240 RetestHello traders! Let’s break down the current XAUUSD structure. Gold is trading within a broad ascending structure after forming a strong local bottom around the Support Line, where buyers entered the market and started to push the price higher. This upward movement follows a long corrective phase, during which the price respected the diagonal Support Line multiple times — confirming the presence of a stable bullish trend. Earlier, XAUUSD broke out of the Buyer Zone (4,110–4,120), retested it, and successfully held above it. This zone now acts as a key demand area and the primary level where buyers continue defending the trend. A previous bearish attempt failed here, forming a fake breakout and leading to a new bullish impulse. The price is now approaching the descending Resistance Line, which has repeatedly pushed gold lower during the recent correction. A clean breakout above this trendline may open the way for the price to move toward the major Resistance Level at 4,240.00, which also aligns with the first take-profit area (TP1). This Resistance Level has acted as a strong reaction zone multiple times, causing sharp pullbacks and marking the boundaries of the Seller Zone. Buyers will likely face significant opposition here once again. If gold respects the Buyer Zone and maintains trading above 4,110, the bullish scenario remains intact, and the price may push toward TP1 → 4,240. A confirmed breakout above this level would signal continuation toward higher targets within the broader bullish structure. However, if XAUUSD fails to hold the Buyer Zone and breaks below 4,110, the bullish outlook becomes invalid. In this case, the price may revisit the lower trendline or enter a deeper correction toward previous support areas. For now, the structure remains moderately bullish, with buyers dominating as long as the price stays above demand and respects the ascending Support Line. Please share this idea with your friends and click "Boost" 🚀

Gold next move (mild correction is on the cards)(01-12-2025)Go through the analysis carefully and do trade accordingly.
Anup 'BIAS for the day (01-12-2025)
Current price- 4245
"if Price stays below 4263, then next target is 4230, 4216 and 4190 and 4170 and above that 4280, 4300 ".
-POSSIBILITY-1
Wait (as geopolitical situation are worsening )
-POSSIBILITY-2
Wait (as geopolitical situation are worsening)
Best of luck
Never risk more than 1% of principal to follow any position.
Support us by liking and sharing the post.

Gold UpdateNot sure what's up with the futures chart but GLD trades on spot price, and the breakout is a lot more clear on spot price.
RSI did hit overbought, but melt up is possible since MFI is not overbought.

GOLD → Consolidation above the support level of the new rangeFX:XAUUSD is consolidating above 4150 but within the distribution phase after breaking through consolidation. The upward price movement is supported by the weakening of the dollar...
The metal remains on track for a fourth month of growth thanks to expectations of further Fed rate cuts and geopolitical tensions.
Despite strong US data, markets are still pricing in a 76-85% probability of a rate cut in December. The dollar is weakening, although yields are rising slightly.
Against the backdrop of the holiday week in the US, volatility may decrease and gold may consolidate. Talks about a possible peace between Russia and Ukraine could reduce demand for safe-haven assets, but the overall backdrop remains favorable for XAU/USD growth.
Resistance levels: 4170, 4211
Support levels: 4146, 4139
Gold is consolidating above the key support zone of 4140-4146. A long squeeze could trigger a shift in market imbalance in favor of buyers. If the bulls keep the price above 4150, this could trigger further growth, a breakout of 4170, and a retest of 4211.
Best regards, R. Linda!

Gold 1H – 4262 Sweep Drop or 4188 Hold the Floor?🟡 XAUUSD – Intraday Smart Money Plan | by Ryan_TitanTrader (03/12)
📈 Market Context
Gold is trading into policy-driven liquidity engineering as former White House adviser Kevin Hassett gains renewed spotlight after public commentary from former U.S. President Donald Trump referencing potential Federal Reserve leadership influence. Expect sharp liquidity sweeps both sides before institutions commit.
Technically, H1 price coils between premium and discount extremes, and the next leg unlocks only after MSS (CHoCH) + BOS + displacement validation.
🔎 Technical Framework – Smart Money Structure (1H)
Current phase = liquidity-rich compression at H1 extremes
Liquidity zones & key triggers
• 🔴 SELL GOLD 4265 – 4267 | SL 4275
Institutional idea: sweep above premium → bearish MSS + valid BOS down → FVG/OB retest → delivery into discount.
• 🟢 BUY GOLD 4186 – 4184 | SL 4176
Institutional idea: sweep below discount → bullish MSS + BOS up → FVG/OB retest → demand expansion.
• 🟡 Equilibrium / Chop: no trading unless structure proves intent.
Expected sequence = Sweep → MSS/CHoCH → BOS → Displacement → Retest → Expansion
🎯 Execution Rules (unchanged methodology, matching your zones)
🔴 SELL GOLD 4265 – 4267 | SL 4275
Rules:
✔ Price taps 4266 zone → bearish MSS/CHoCH (M5–M15)
✔ Confirm clean bearish BOS down with displacement
✔ Enter on FVG fill or OB retest after displacement
Targets:
1. 4245 – 4240
2. 4225 – 4215
3. 4186 – 4184
🟢 BUY GOLD 4186 – 4184 | SL 4176
Rules:
✔ Price sweeps 4185 → bullish MSS/CHoCH + BOS up
✔ Confirm displacement away from discount
✔ Enter on wick rejection + FVG fill or OB retest confirmation
Targets:
1. 4215
2. 4240
3. 4265+
⚠️ Risk Notes
• Both sweeps = traps until BOS + displacement proves intent.
• No averaging inside compression.
• SL = structure invalidation only.
• Reduce lot size during volatility spikes from headline risk.
📍 Summary
Two institutional routes today:
• 4266 sweep → bearish MSS/BOS → retest → delivery into 4185
or
• 4185 sweep → bullish MSS/BOS → retest → expansion into new 4266+
Trade the structure. Let price narrate intent. Patience = edge.
📌 Follow @Ryan_TitanTrader for daily Smart Money breakdowns.

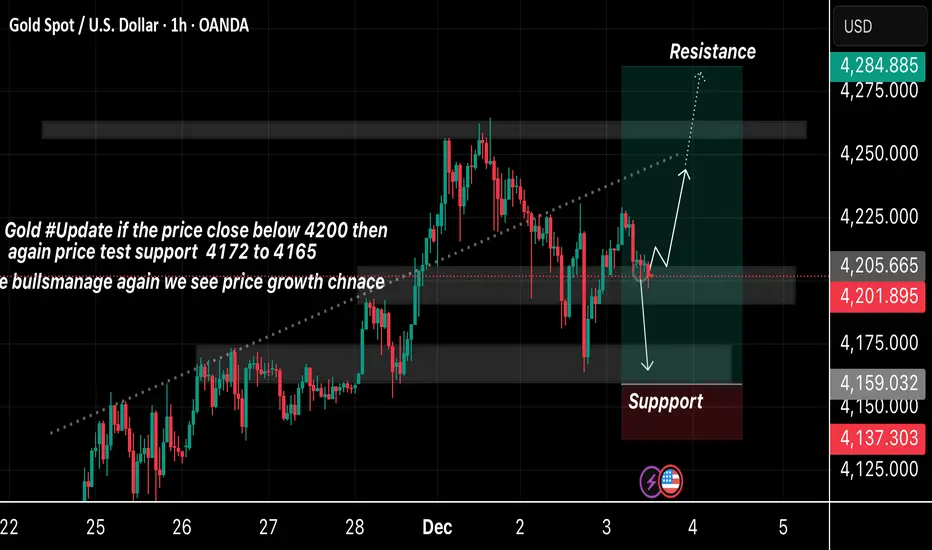
Gold Price Update – Clean & Clear ExplanationGold the market is trading around the 4200 zone, which is an important level.
✅ If the price closes below 4200, it may fall toward the support area between 4172 and 4165.
✅ This zone is highlighted as a strong support, where buyers have previously stepped in
✅ If the support holds and buyers regain control, the price may bounce upward again, giving a new chance for bullish growth
✅ On the upside, the next major resistance area is marked near 4242–4284 where the price could face selling pressure.
Overall, the chart outlines both possible scenarios a drop toward support if 4200 breaks, or a bullish move toward resistance if buyers maintain strength.
If you find it helpful please like and comments for this post and share thanks.
XAUUSD: Channel Push Points to $4,220 as Next TargetHello everyone, here is my breakdown of the current Gold setup.
Market Analysis
Gold remains in a broader bullish structure, but the recent price action is developing inside a well-defined ascending channel, where price is currently moving from the lower boundary toward the upper one. After a sharp correction, XAUUSD found strong support at the $4,040 level, which aligns with the bottom of the channel and produced a fake breakout, signaling lack of bearish continuation.
Currently, price has started a new upward swing, respecting both the channel structure and the mid-line trend dynamics. However, despite the recovery, XAUUSD is still trading below the major $4,220 resistance, which previously acted as a strong reaction zone and remains the key obstacle for buyers.
My Scenario & Strategy
My scenario is bullish, as long as price stays above the support zone around $4,040 and maintains structure inside the ascending channel. I expect Gold to continue climbing toward the $4,220 resistance, where the upper channel boundary also converges, forming a strong confluence area.
Therefore, a clean breakout above $4,220 would open the way for higher targets and continuation of the broader trend. However, if price reaches this zone and shows strong rejection or weakness, we may see a pullback into the channel — but the bullish structure remains intact as long as the lower boundary holds. For now, the market supports a long bias, with the key objective being a retest of the $4,220 resistance zone, which is the next major level buyers are aiming for.
That's the setup I'm tracking. Thank you for your attention, and always manage your risk.

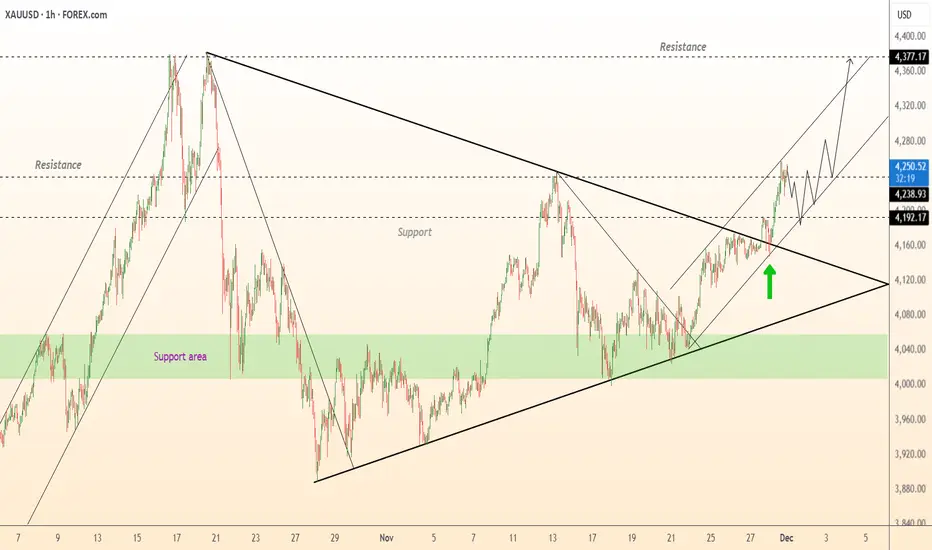
DeGRAM | GOLD will break the $4250 level📊 Technical Analysis
● XAU/USD broke out of a long-term triangle and retested the confluence of trendline support and the 4,190 zone, confirming bullish continuation.
● Price is now moving inside an ascending channel, targeting the 4,300–4,380 resistance region as momentum strengthens after the breakout.
💡 Fundamental Analysis
● Falling U.S. yields and renewed safe-haven demand support further upside in gold as markets price in a softer Fed stance.
✨ Summary
● Bullish bias above 4,190. Targets: 4,300 → 4,377. Key support: 4,190.
-------------------
Share your opinion in the comments and support the idea with a like. Thanks for your support!
Elise | XAU/USD 2H – Liquidity Sweep + Retest Demand ZoneOANDA:XAUUSD
Multiple range phases indicate institutional accumulation. Price reacted cleanly to previous demand and is now preparing for continuation if support holds. A break-and-hold above 4,225 unlocks open liquidity toward 4,350-4,380.
Key Scenarios
🟢 Bullish Case (Preferred)
Hold above 4,175 → 4,180
🎯 Target 1: 4,260
🎯 Target 2: 4,320
🎯 Final Target: 4,375 – 4,380
🔻 Bearish Case (Invalidation)
If price closes below 4,111-4,115
📉 Downside exposure opens toward 4,040 – 4,000
Current Levels to Watch
Resistance 🔴: 4,260 / 4,318 / 4,380
Support 🟢: 4,175 / 4,115 (Invalidation)
⚠️ Disclaimer: This analysis is for educational purposes only. Not financial advice.

Gold Awakens: Sharp Pullback but Outlook Remains BrightFrom a technical perspective, gold is currently moving within a parallel ascending channel, showing a clear bullish momentum with a rhythm that is hard to ignore. The price recently bounced away from the resistance area, indicating a typical overbought reaction. At the moment, the market is approaching the lower boundary of this projected channel, an area considered important. The convergence of several technical support levels in this zone is likely to attract renewed buying interest.
I expect the price to rebound toward the 4,250 area, which aligns with the mid-channel region. The bullish momentum may not appear immediately. The situation could develop into a consolidation phase, a false decline, or even a sudden acceleration.

Gold next move (sell continued but it is risky now)(02-12-2025)Go through the analysis carefully and do trade accordingly.
Anup 'BIAS for the day (02-12-2025)
Current price- 4231
"if Price stays below 4242, then next target is 4221, 4200 and 4190 and 4170 and above that 4280, 4300 ".
if price managed to break and close above 4235 on 1H time frame, then we may buy as marked in the chart.
-POSSIBILITY-1
Wait (as geopolitical situation are worsening )
-POSSIBILITY-2
Wait (as geopolitical situation are worsening)
Best of luck
Never risk more than 1% of principal to follow any position.
Support us by liking and sharing the post.

Gold Extends Rally Toward New Highs as Fed Cut Bets IncreaseGold Extends Rally Toward New Highs as Fed Cut Bets Increase
We are following gold from 4030 to the current price and the price has already reached our first major target at 4150.
Currently, gold came out of a strong area near 4130. We can also see that Gold wanted to fall again but stopped near 4110.
After the weaker-than-expected US PPI data, the market is expecting a possible rate cut from the FED meeting in December, thus increasing the chances of gold rising further.
Volume is still low but it may increase during the coming days. Gold appears poised to reach 4,230 and 4,290.
Our analysis did not change because there is nothing to change :)
You may find more details in the chart!
Thank you and Good Luck!
❤️PS: Please support with a like or comment if you find this analysis useful for your trading day❤️

XAUUSD – 30m | Channel Break → Retest → Bearish Liquidity Sweep OANDA:XAUUSD
The 4,240 resistance remains a strong rejection point, with price now trading inside a lower-timeframe distribution. Liquidity sits below 4,177 and 4,155 where previous reaction points remain untested. As long as market holds beneath 4,240, the downside continuation remains the more probable scenario.
Key Scenarios
📉 Bearish Continuation (Primary Plan)
Confirmation: Lower-high → rejection from 4,210–4,220
🎯 Target 1 → 4,177.5 (Liquidity sweep)
🎯 Target 2 → 4,155 (Support zone base)
📈 Bullish Invalidation
A clean break and hold above 4,240 would flip the structure bullish again.
Current Levels to Watch
Resistance 🔴: 4,240.677
Support 🟢: 4,177 | 4,155
⚠️ Disclaimer: This analysis is for educational purposes only — not financial advice

Gold (xauusd): two inverse head and shouldersHi!
Gold continues to show constructive bullish behavior on the 1-hour timeframe, validated by consecutive inverse Head & Shoulders (iH&S) formations that developed around major support areas.
The first iH&S appeared near 4,173–4,180 USD, where price formed a clear left shoulder, deep head, and right shoulder inside a well-defined demand zone. The neckline was broken cleanly, confirming bullish intent. The projected target for this larger pattern lies in the 4,265–4,272 USD region (pink zone), which remains the ultimate upside objective as long as structure holds.
After the breakout, Gold retraced and created another smaller iH&S nested within the broader pattern. This second structure also built its head inside the same support region, highlighting strong buyer defense. Its neckline breakout signals a nearer target at 4,242–4,250 USD (green zone).
Gold is currently trading above the smaller neckline, retesting the breakout level. A successful retest followed by higher lows would likely fuel continuation toward the green zone, and eventually toward the pink zone, completing the larger pattern’s measured move.
Failure to hold above the neckline may lead to a deeper pullback toward 4,185–4,195 USD, but the bullish pattern remains valid unless the head area is breached.
Overall, structure supports a continuation of the uptrend as long as price remains above the neckline and key support levels.
Disclaimer: As part of ThinkMarkets’ Influencer Program, I am sponsored to share and publish their charts in my analysis.

XAUUSD – LANA WATCHES BUY SCALPING 4180–4185 BEFORE PCE DATA XAUUSD – LANA WATCHES BUY SCALPING 4180–4185 BEFORE PCE DATA
1. Fundamental Analysis
This weekend, the market is almost "holding its breath" waiting for the PCE report – the Fed's preferred inflation gauge, seen as the final piece before the year-end meeting.
Surveys show weakening consumer confidence, increasing recession risks. But shopping season sales and Black Friday indicate purchasing power is still quite strong.
Therefore, PCE will decide: If inflation continues to cool, the market strengthens the expectation ~87% that the Fed will cut 25bps, supporting stocks and in the medium term also providing a positive foundation for gold.
Before the data release, gold tends to move sideways, compressing the range, with money staying out waiting for more signals.
Today Lana only sees this as a weekend scalping session, not opening additional long positions.
2. Technical Analysis
H1 Frame: Gold is moving in an upward price channel, with higher lows. The lower trendline of the channel passes through the 4180–4185 area.
Above is the 4219 resistance zone and further is the POC cluster 4241–4244, but with the current sideways state, the price has not shown a clear breakout intention.
On Thursday and Friday morning, the fluctuation range was quite noisy, with candles crisscrossing around the middle of the channel – indicating an accumulation state, waiting for a breakout.
Therefore, Lana does not chase Buy/Sell in the middle of the zone, but only chooses a clear liquidity area near the upward trendline for scalping.
3. Price Areas to Watch
Buy scalping area: 4185 – 4180 (coincides with upward trendline + support)
Secondary support: 4165 – 4156
Near resistance: 4219
Far resistance / POC: 4241 – 4244
4. Trading Scenario
⭐️ Only Scenario – Weekend Buy Scalping
Buy: 4185 – 4180
SL: 4178
TP: minimum +15–20 points from entry (you can actively close around near resistance zones).
Today Lana does not open additional long-term positions, only focusing on this one entry. Next week, if a larger wave forms more clearly after the PCE data and the Fed's decision, I will update everyone. 💛
👉 Follow Lana on TradingView to receive the earliest gold updates

Fib Analysis - Bullish Trendbased on previous analysis with Fib. This is the idea i have for the current trend on XAU USD. Also based on potential news later on in the day in the US. I can see this being very bullish

XAUUSD–Volume Profile buy scenario around 4,200, target 4,265+XAUUSD–Volume Profile buy scenario around 4,200, target 4,265+
Brian – Prioritize buying with the trend, use VAL to position entry
Market snapshot
At the end of the US session yesterday, gold had a strong increase and then stabilized, currently moving sideways around 4,216 on H1.
The structure is still an uptrend, the current decline is mainly a technical correction within the value area.
On the chart, the 4,264–4,265 area is marked as important resistance, where if broken, the medium-term uptrend could be unleashed more strongly.
Volume Profile & key price areas
The VAL (Value Area Low) of the Volume Profile is currently around 4,200 – this is an area where the market has previously accepted a large volume of trades, suitable for trend-following buys.
A deeper support area is around 4,164 (Supportsides on the chart), where buyers have previously intervened very clearly.
Above: 4,265 – confirmed resistance, if broken will strengthen the scenario of gold heading to higher price areas, matching the "super cycle 5,000 USD" story in the long term.
Trading plan for next week (according to H1 & Volume Profile)
Priority scenario – Buy at VAL with the trend
Buying area: around 4,200 (VAL of Volume Profile).
Can flexibly range 4,198–4,203 depending on spread and market conditions.
Idea: wait for the price to pull back to the VAL area, observe H1 candle reactions (long lower tail, rejection candles...) before entering the order.
Immediate targets:
TP1: area 4,240–4,245
TP2: 4,265 – important resistance marked as "important resistance, confirming medium term increase".
If the price closes clearly above 4,265 and successfully retests, consider holding part of the position or finding additional entry points, according to the scenario of expanding to higher areas in the new cycle.
Defensive scenario – Deep support
If the 4,200 area does not hold, the 4,164 area will be the next support to watch.
Closing H1/D1 below 4,164 will be a signal to reduce short-term expectations and wait for a new structure instead of trying to "buy every dip".
Fundamental context – Reasons gold is still supported
Gold is heading for its best growth year since 1979, with an increase of over 60% in 2025 – this is the context of a true bull market, not just a recovery wave.
YTD performance of XAU outperforms BTC, showing that large capital flows prioritize stability and gold's safe haven role.
Current supporting factors: US bond yields cooling, USD weakening.
Geopolitical tensions escalating, Russia–US negotiations have not brought clear breakthroughs.
The market prices in nearly a 90% chance of the Fed cutting rates at the next meeting, making non-yielding assets like gold more attractive.
Follow Brian to share the Gold scenario together

BUY SIGNAL Trend trade setupAccording to the 4hr/1hr chart TF: Gold is in a BULLISH MODE
On 1hr chart we encounter a shallow correcting and the mini sellers are done.
BULLS are to resume with the trend.
This is my 1st attempt long.
Will be holding till price reaches the recent high on daily TF or till momentum begin to fade.
Trade is ACTIVE!
Eventually Trading
Undefeated!
#gold #buy #anesuralph #xauusd #daytrader #trendcontinuation #signal
